| Param | Original file | Final file |
|---|---|---|
| Filename | modeM0/AS1G05_219T01_9000000540_04344cztM0_level2.evt | modeM0/AS1G05_219T01_9000000540_04344cztM0_level2_quad_clean.evt |
| Size (bytes) | 876,409,920 | 66,908,160 |
| Size | 835.8 MB | 63.8 MB |
| Events in quadrant A | 3,237,100 | 480,276 |
| Events in quadrant B | 16,345,120 | 156,235 |
| Events in quadrant C | 3,215,295 | 469,831 |
| Events in quadrant D | 3,298,123 | 456,878 |
| Mode SS | |||
|---|---|---|---|
| Quadrant | BADHDUFLAG | Total packets | Discarded packets |
| A | 0 | 132 | 0 |
| B | 0 | 132 | 0 |
| C | 0 | 132 | 0 |
| D | 0 | 132 | 0 |
| Mode M9 | |||
|---|---|---|---|
| Quadrant | BADHDUFLAG | Total packets | Discarded packets |
| A | 0 | 10 | 0 |
| B | 0 | 10 | 0 |
| C | 0 | 10 | 0 |
| D | 0 | 10 | 0 |
| Mode M0 | |||
|---|---|---|---|
| Quadrant | BADHDUFLAG | Total packets | Discarded packets |
| A | 0 | 14159 | 2 |
| B | 0 | 52994 | 1 |
| C | 0 | 14150 | 1 |
| D | 0 | 14314 | 1 |
| Quadrant | Total seconds | Saturated seconds | Saturation percentage |
|---|---|---|---|
| A | 6608 | 139 | 2.103511% |
| B | 6608 | 5930 | 89.739709% |
| C | 6608 | 102 | 1.543584% |
| D | 6608 | 106 | 1.604116% |
Noise dominated data is calculated using 1-second bins in cleaned event files. If a bin has >2000 counts, and if more than 50% of those come from <1% of pixels, then it is considered to be noise-dominated and hence unusable.
| Quadrant | # 1 sec bins | Bins with >0 counts | Bins with >2000 counts | High rate bins dominated by noise | Noise dominated (total time) | Noise dominated (detector-on time) | Marked lightcurve |
|---|---|---|---|---|---|---|---|
| A | 7578 | 6608 | 15 | 15 | 0.20% | 0.23% | 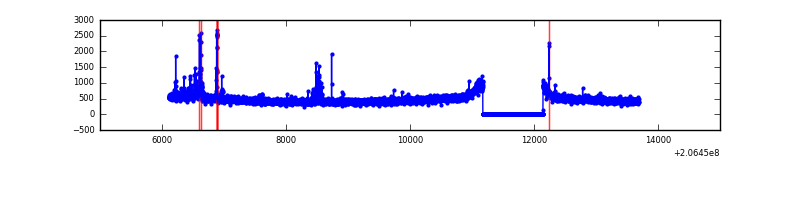 |
| B | 7577 | 6607 | 5766 | 5766 | 76.10% | 87.27% |  |
| C | 7578 | 6608 | 8 | 8 | 0.11% | 0.12% | 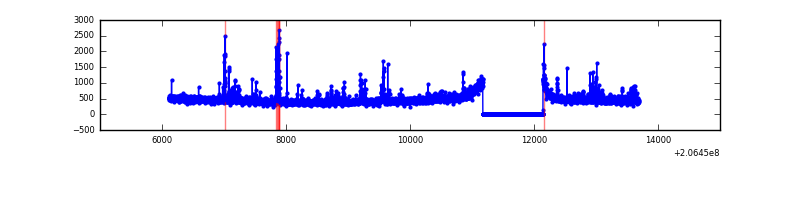 |
| D | 7578 | 6608 | 16 | 16 | 0.21% | 0.24% | 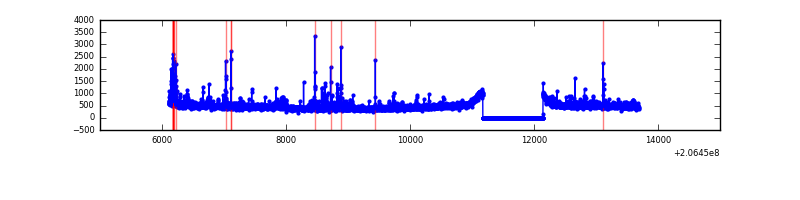 |
Top three noisy pixels from each quadrant. If the there are fewer than three noisy pixels in the level2.evt file, extra rows are filled as -1
| Pixel properties | Quadrant properties | ||||||
|---|---|---|---|---|---|---|---|
| Quadrant | DetID | PixID | Counts | Sigma | Mean | Median | Sigma |
| A | 7 | 16 | 90207 | 541.75 | 799 | 782 | 165.1 |
| A | 15 | 234 | 32565 | 192.55 | 799 | 782 | 165.1 |
| A | 8 | 15 | 22463 | 131.35 | 799 | 782 | 165.1 |
| B | 3 | 0 | 13825944 | 181842.56 | 391 | 383 | 76.0 |
| B | 10 | 16 | 557588 | 7328.71 | 391 | 383 | 76.0 |
| B | 0 | 187 | 328558 | 4316.37 | 391 | 383 | 76.0 |
| C | 9 | 247 | 180971 | 998.45 | 766 | 770 | 180.5 |
| C | 9 | 16 | 38327 | 208.09 | 766 | 770 | 180.5 |
| C | 13 | 61 | 6408 | 31.24 | 766 | 770 | 180.5 |
| D | 13 | 53 | 141041 | 748.69 | 772 | 750 | 187.4 |
| D | 2 | 136 | 80635 | 426.32 | 772 | 750 | 187.4 |
| D | 12 | 233 | 41522 | 217.59 | 772 | 750 | 187.4 |
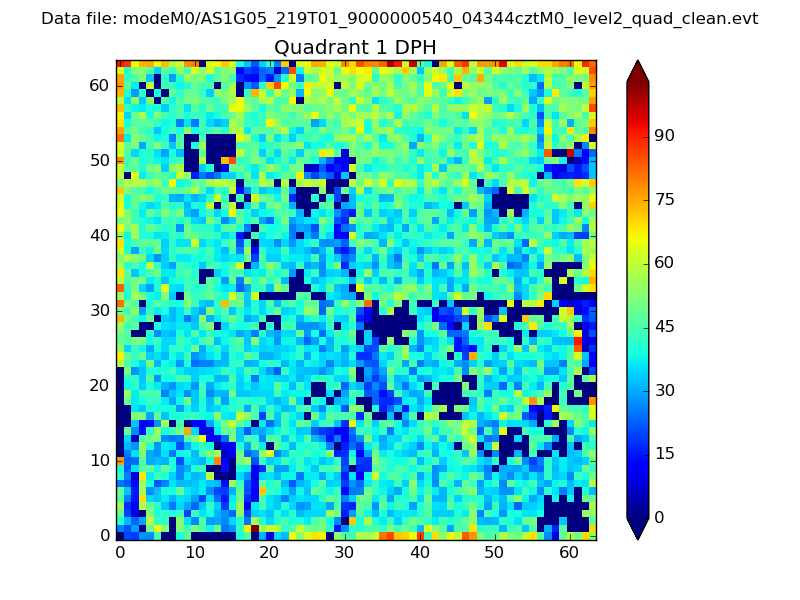
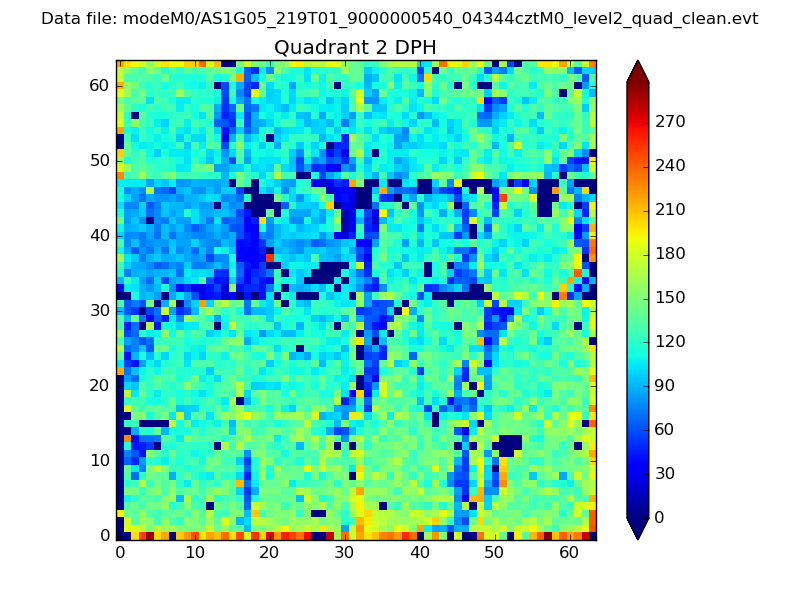
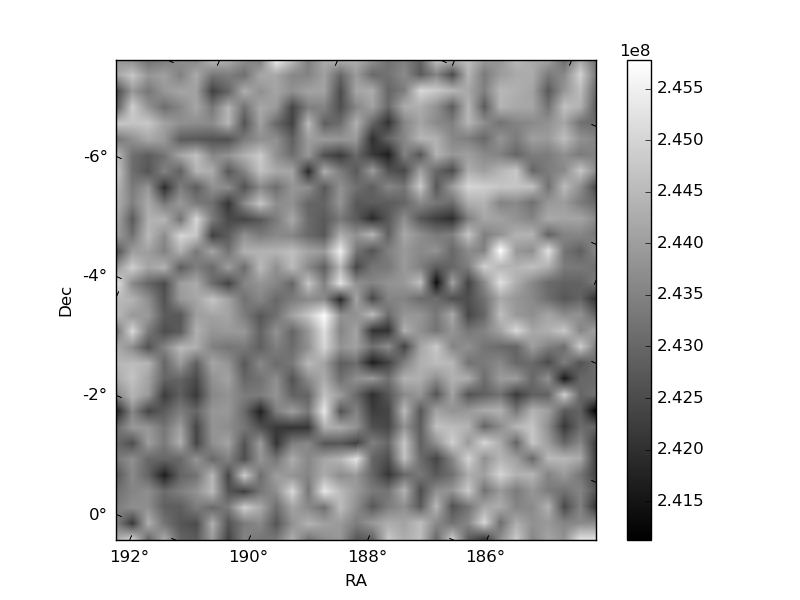
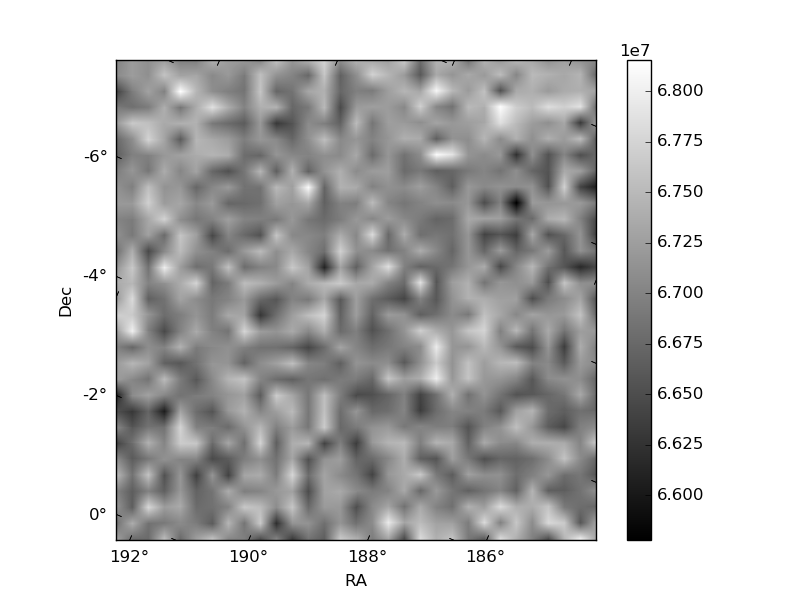
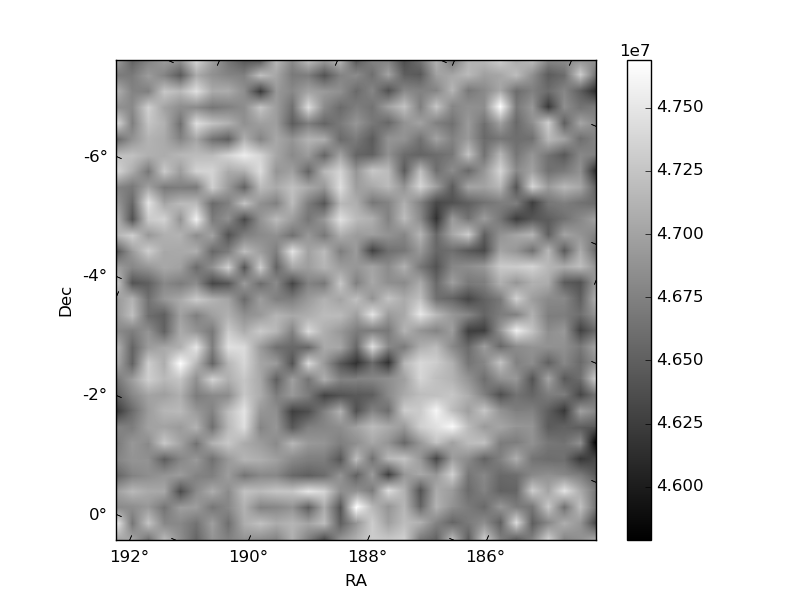
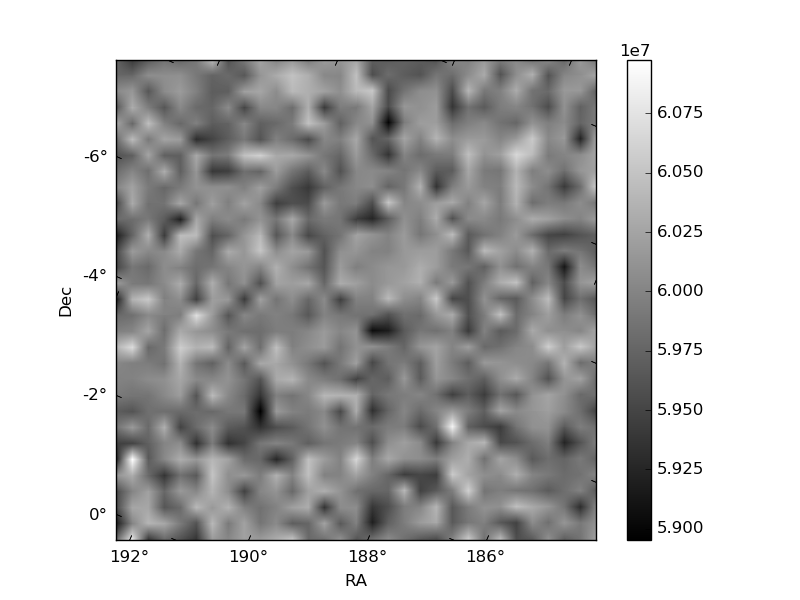
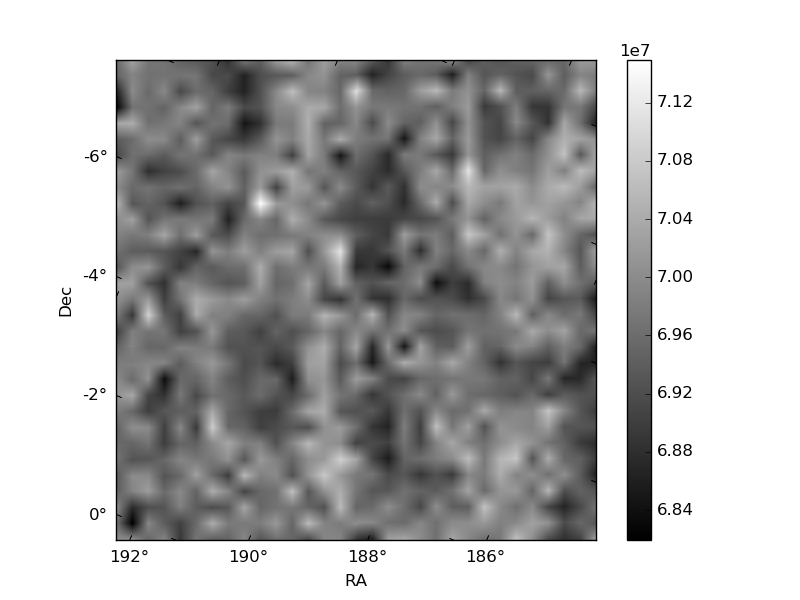
Histogram calculated using DETX and DETY for each event in the final _common_clean file
| Quadrant A | 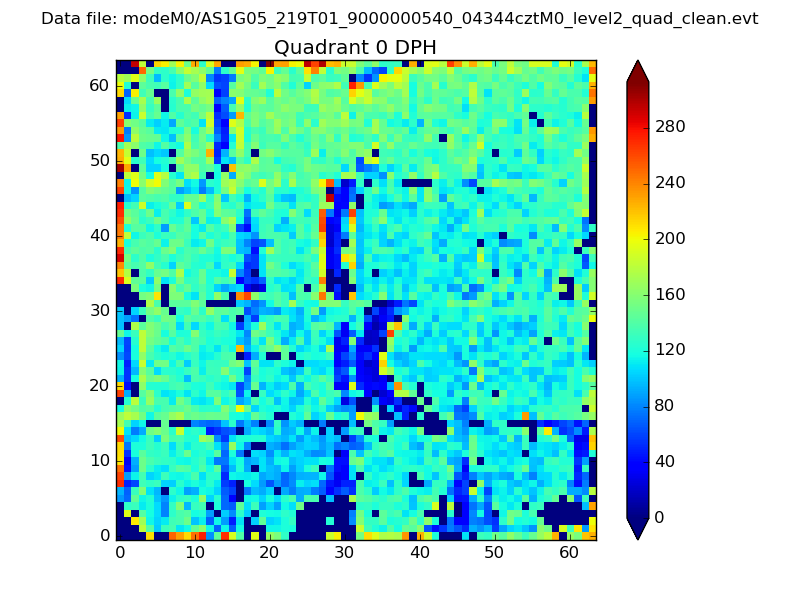 |
 |
Quadrant B |
|---|---|---|---|
| Quadrant D | 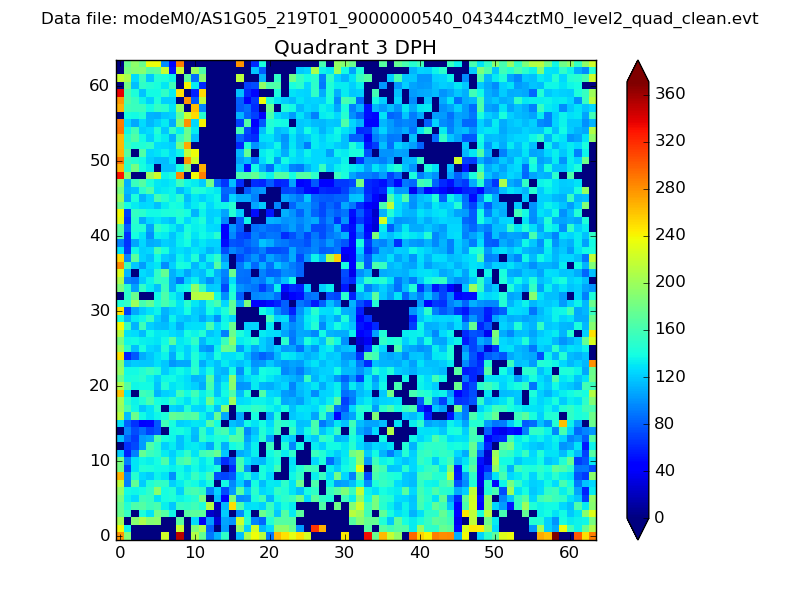 |
 |
Quadrant C |
| Plot type | Count rate plots | Images |
|---|---|---|
| Comparison with Poisson distribution Blue bars denote a histogram of data divided into 1 sec bins. Red curve is a Poisson curve with rate = median count rate of data. |
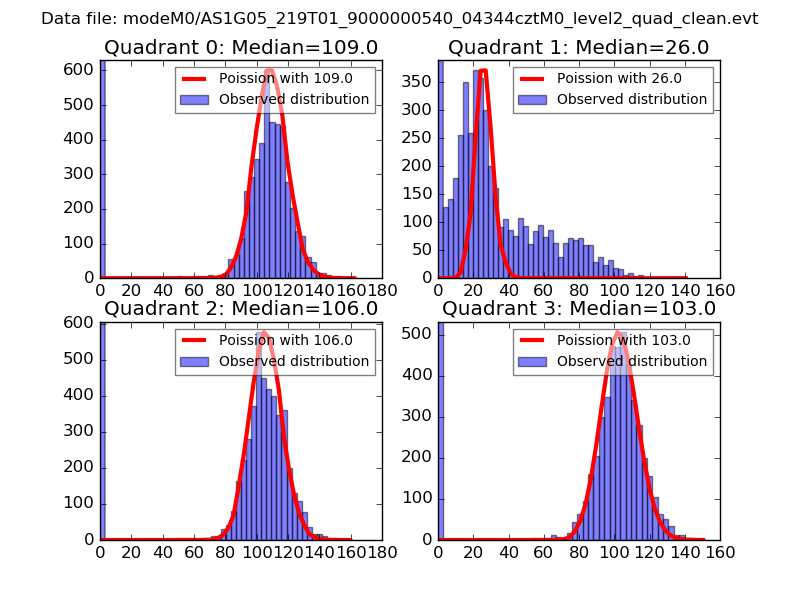 |
 |
| Quadrant-wise count rates Data is divided into 100 sec bins |
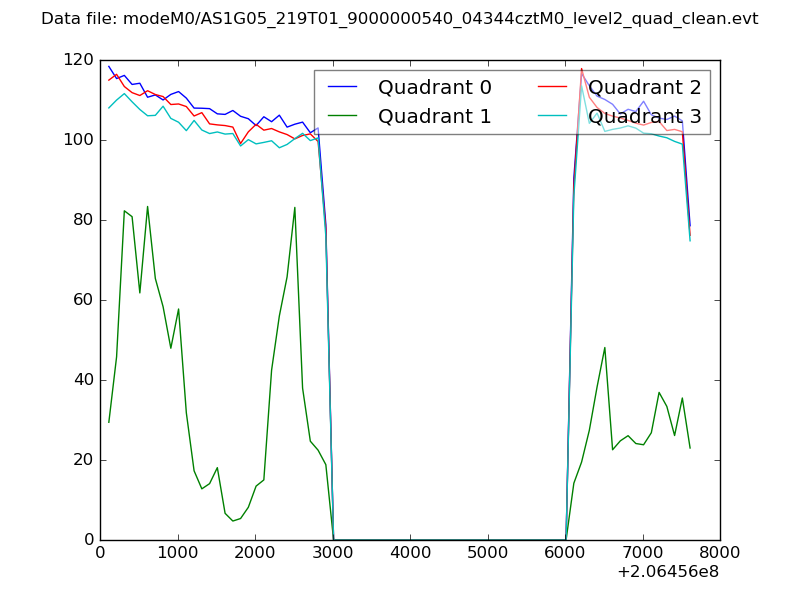 |
|
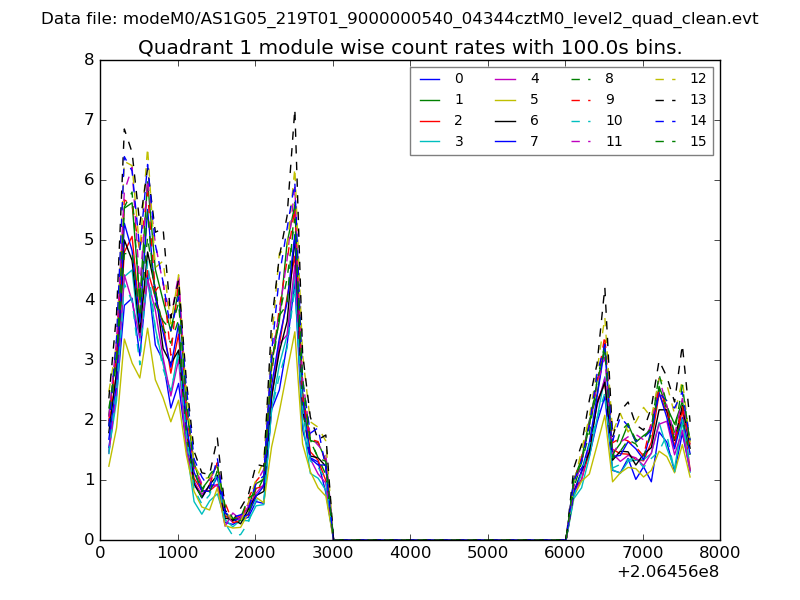
| Module-wise count rates for Quadrant A Data is divided into 100 sec bins |
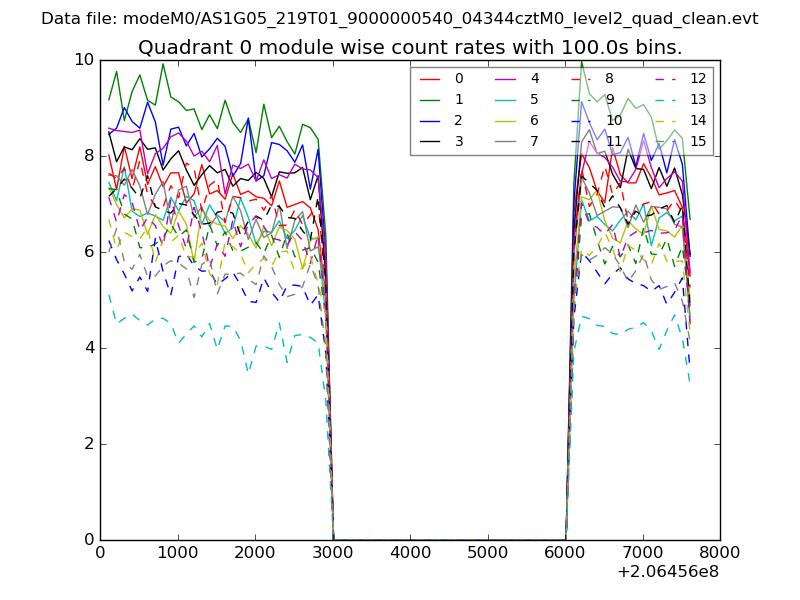 |
 |
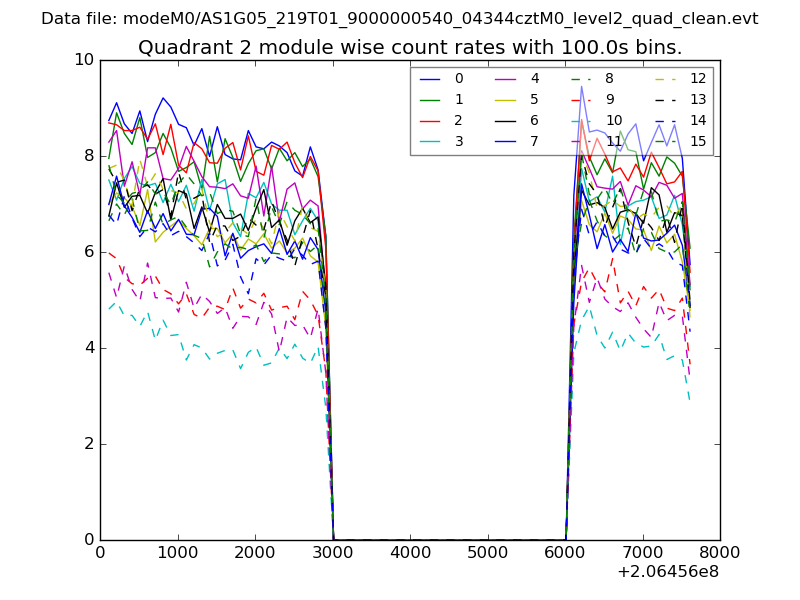
| Module-wise count rates for Quadrant B Data is divided into 100 sec bins |
 |
 |
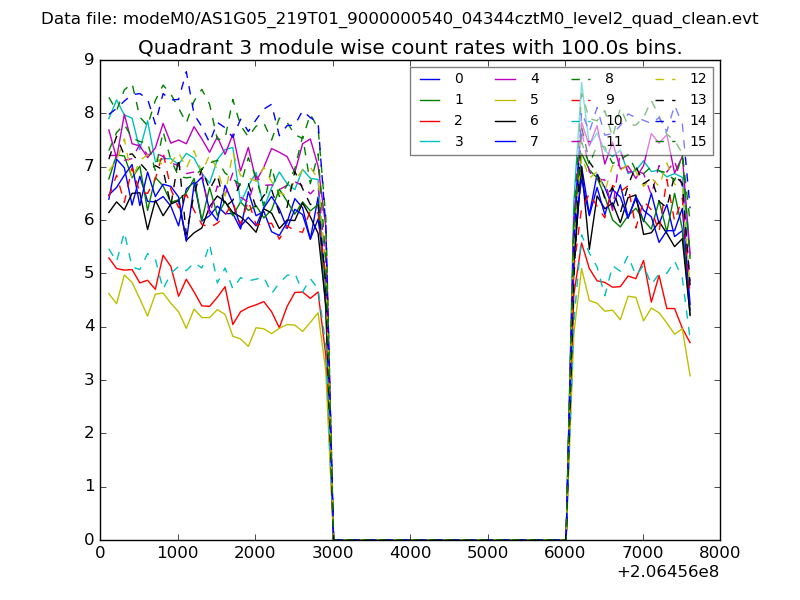
| Module-wise count rates for Quadrant C Data is divided into 100 sec bins |
 |
 |
| Module-wise count rates for Quadrant D Data is divided into 100 sec bins |
 |
 |
| Parameter | Plot |
|---|---|
| CZT HV Monitor | 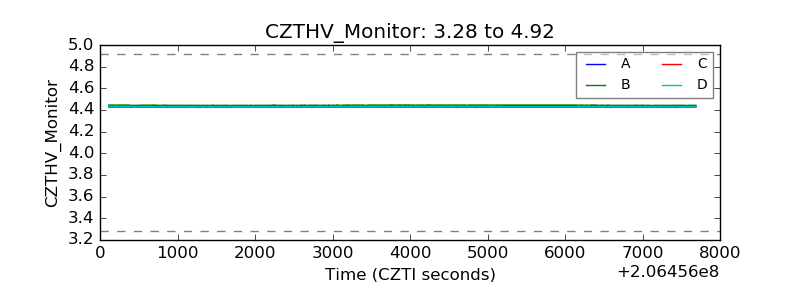 |
| D_VDD | 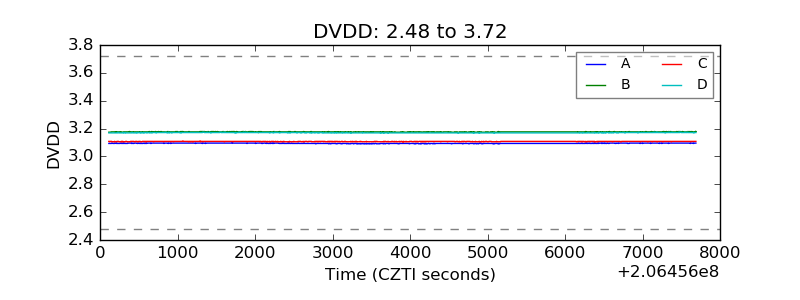 |
| Temperature 1 | 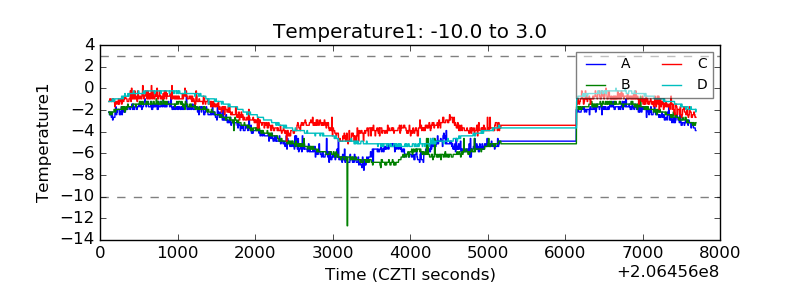 |
| Veto HV Monitor | 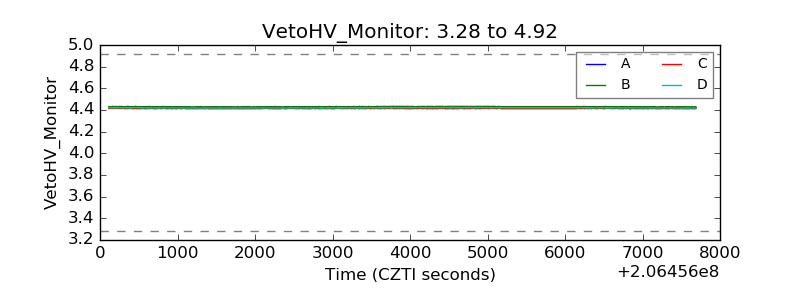 |
| Veto LLD | 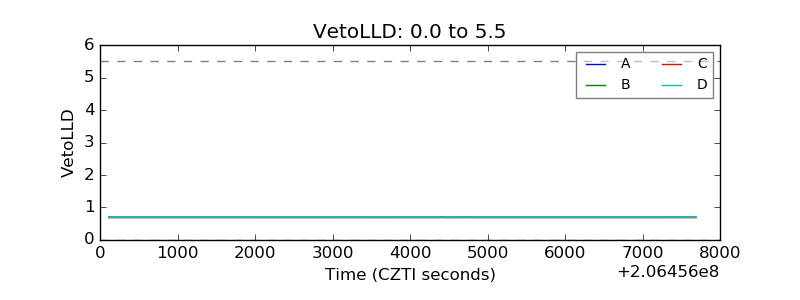 |
| Alpha Counter | 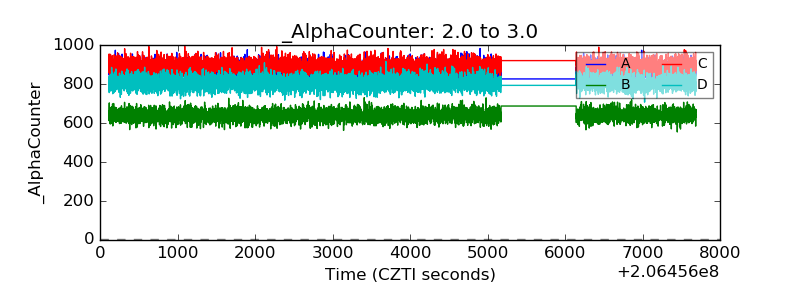 |
| _CPM_Rate | 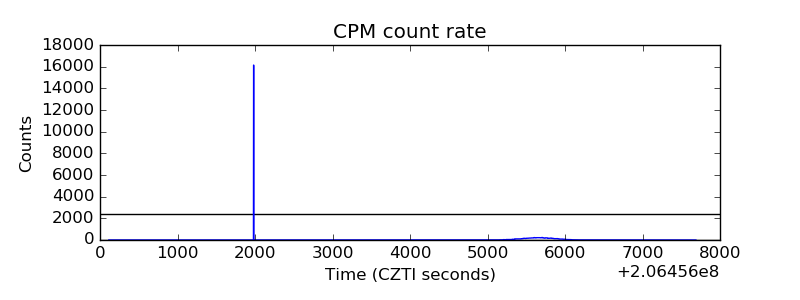 |
| CZT Counter | 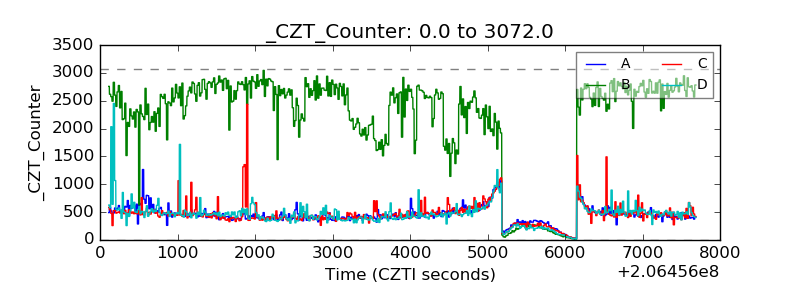 |
| +2.5 Volts monitor |  |
| +5 Volts monitor |  |
| _ROLL_ROT | 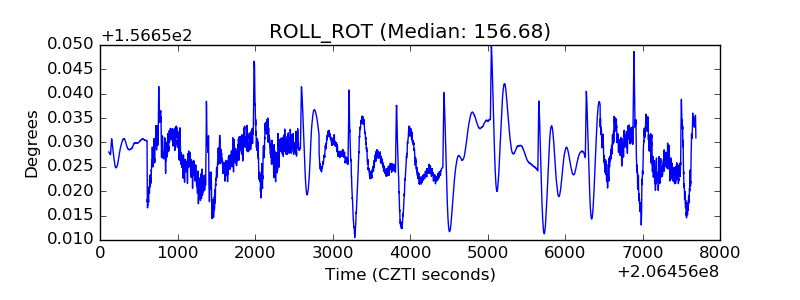 |
| _Roll_DEC | 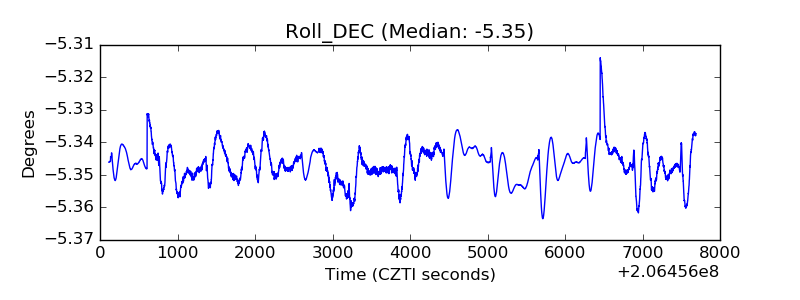 |
| _Roll_RA | 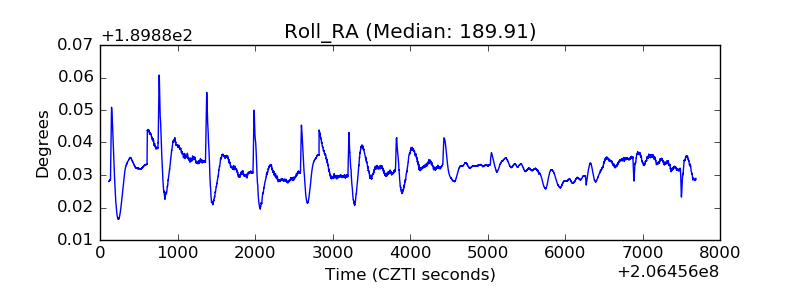 |
| Veto Counter | 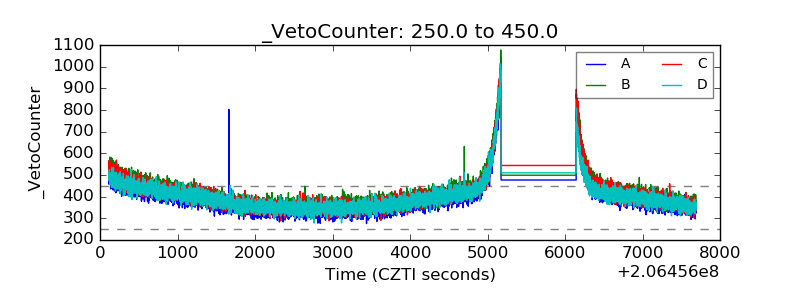 |