| Param | Original file | Final file |
|---|---|---|
| Filename | modeM0/AS1G05_219T01_9000000540_04345cztM0_level2.evt | modeM0/AS1G05_219T01_9000000540_04345cztM0_level2_quad_clean.evt |
| Size (bytes) | 972,256,320 | 68,080,320 |
| Size | 927.2 MB | 64.9 MB |
| Events in quadrant A | 3,346,344 | 499,347 |
| Events in quadrant B | 17,869,310 | 116,776 |
| Events in quadrant C | 4,112,139 | 486,136 |
| Events in quadrant D | 3,648,499 | 473,537 |
| Mode SS | |||
|---|---|---|---|
| Quadrant | BADHDUFLAG | Total packets | Discarded packets |
| A | 0 | 140 | 0 |
| B | 0 | 140 | 0 |
| C | 0 | 140 | 0 |
| D | 0 | 140 | 0 |
| Mode M9 | |||
|---|---|---|---|
| Quadrant | BADHDUFLAG | Total packets | Discarded packets |
| A | 0 | 7 | 0 |
| B | 0 | 7 | 0 |
| C | 0 | 7 | 0 |
| D | 0 | 8 | 0 |
| Mode M0 | |||
|---|---|---|---|
| Quadrant | BADHDUFLAG | Total packets | Discarded packets |
| A | 0 | 14844 | 3 |
| B | 0 | 57780 | 2 |
| C | 0 | 16997 | 2 |
| D | 0 | 15715 | 2 |
| Quadrant | Total seconds | Saturated seconds | Saturation percentage |
|---|---|---|---|
| A | 6939 | 105 | 1.513186% |
| B | 6939 | 6547 | 94.350771% |
| C | 6939 | 198 | 2.853437% |
| D | 6939 | 92 | 1.325839% |
Noise dominated data is calculated using 1-second bins in cleaned event files. If a bin has >2000 counts, and if more than 50% of those come from <1% of pixels, then it is considered to be noise-dominated and hence unusable.
| Quadrant | # 1 sec bins | Bins with >0 counts | Bins with >2000 counts | High rate bins dominated by noise | Noise dominated (total time) | Noise dominated (detector-on time) | Marked lightcurve |
|---|---|---|---|---|---|---|---|
| A | 7629 | 6940 | 41 | 41 | 0.54% | 0.59% | 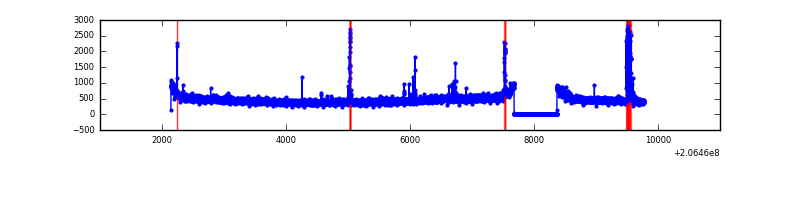 |
| B | 7628 | 6938 | 6450 | 6450 | 84.56% | 92.97% | 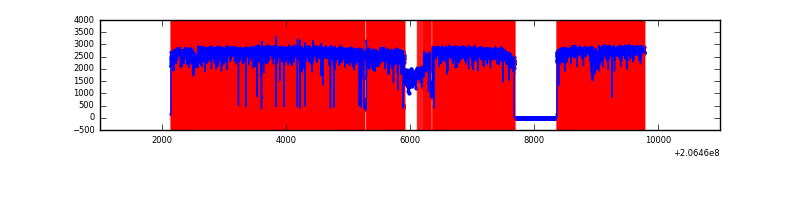 |
| C | 7629 | 6940 | 155 | 155 | 2.03% | 2.23% | 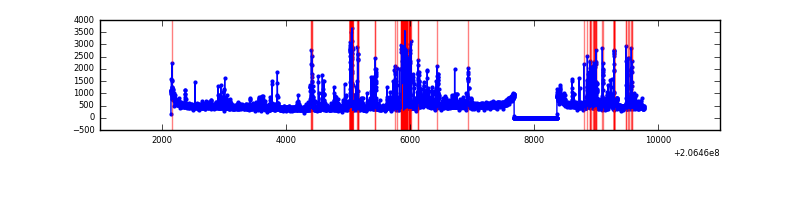 |
| D | 7629 | 6940 | 64 | 64 | 0.84% | 0.92% | 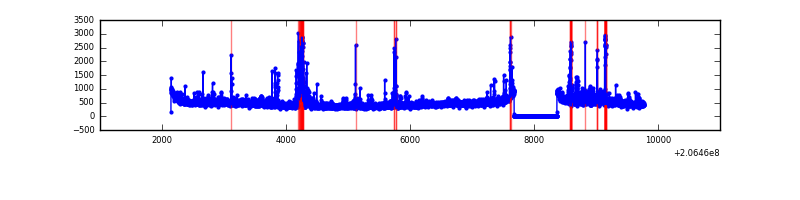 |
Top three noisy pixels from each quadrant. If the there are fewer than three noisy pixels in the level2.evt file, extra rows are filled as -1
| Pixel properties | Quadrant properties | ||||||
|---|---|---|---|---|---|---|---|
| Quadrant | DetID | PixID | Counts | Sigma | Mean | Median | Sigma |
| A | 13 | 251 | 101629 | 597.45 | 822 | 804 | 168.8 |
| A | 0 | 50 | 55818 | 325.99 | 822 | 804 | 168.8 |
| A | 12 | 194 | 8406 | 45.05 | 822 | 804 | 168.8 |
| B | 3 | 0 | 16534012 | 265109.69 | 317 | 311 | 62.4 |
| B | 15 | 204 | 26146 | 414.25 | 317 | 311 | 62.4 |
| B | 15 | 54 | 24362 | 385.65 | 317 | 311 | 62.4 |
| C | 9 | 247 | 581848 | 3132.91 | 785 | 788 | 185.5 |
| C | 9 | 16 | 451019 | 2427.52 | 785 | 788 | 185.5 |
| C | 12 | 4 | 8022 | 39.0 | 785 | 788 | 185.5 |
| D | 2 | 136 | 242031 | 1242.73 | 793 | 770 | 194.1 |
| D | 13 | 53 | 173531 | 889.89 | 793 | 770 | 194.1 |
| D | 13 | 105 | 54064 | 274.52 | 793 | 770 | 194.1 |
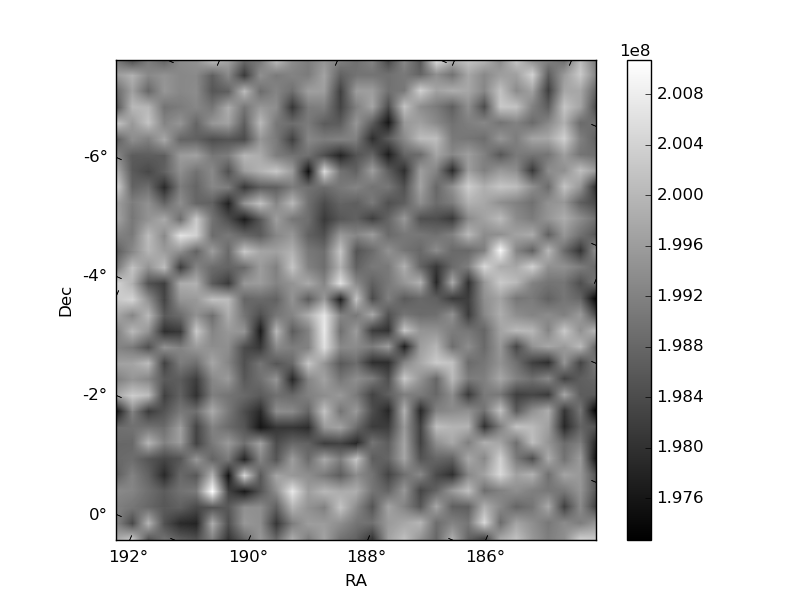
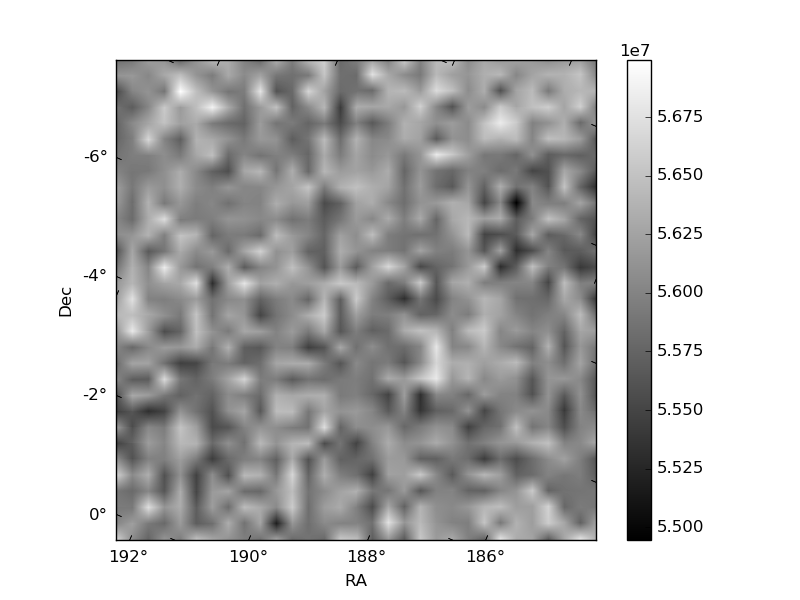
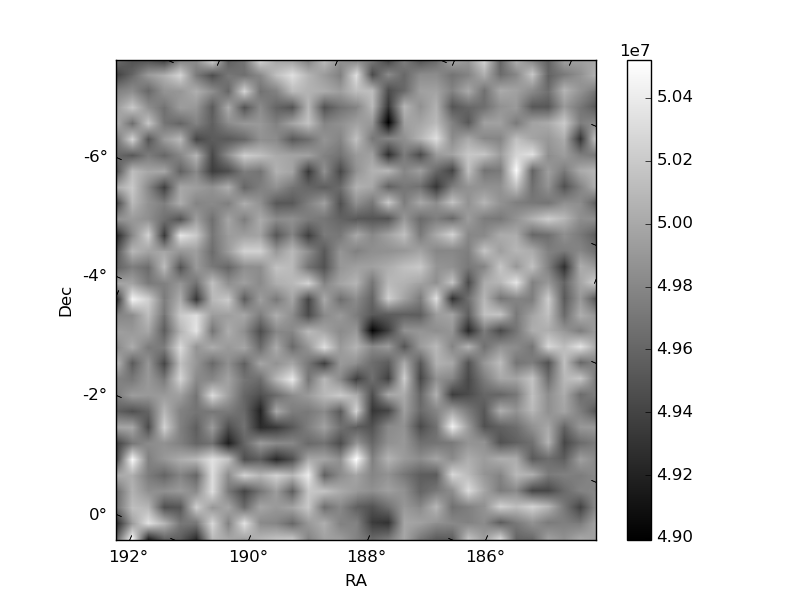
Histogram calculated using DETX and DETY for each event in the final _common_clean file
| Quadrant A | 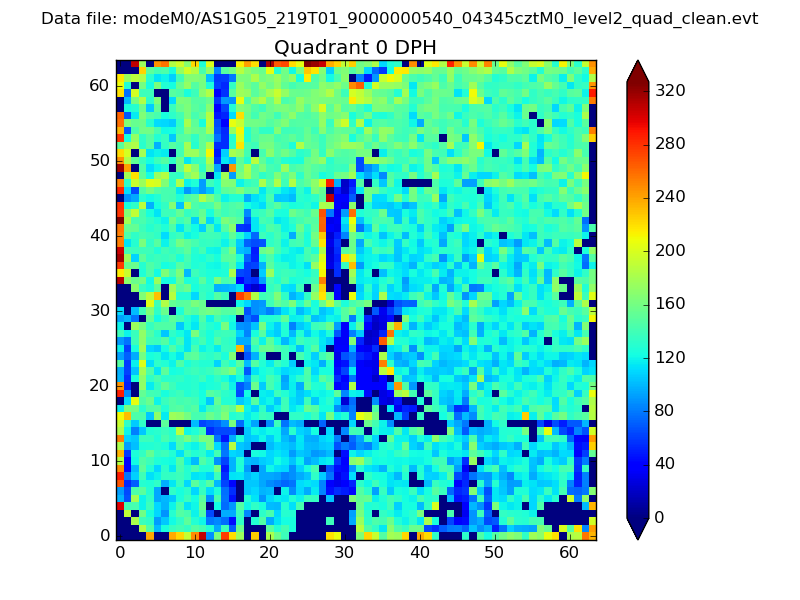 |
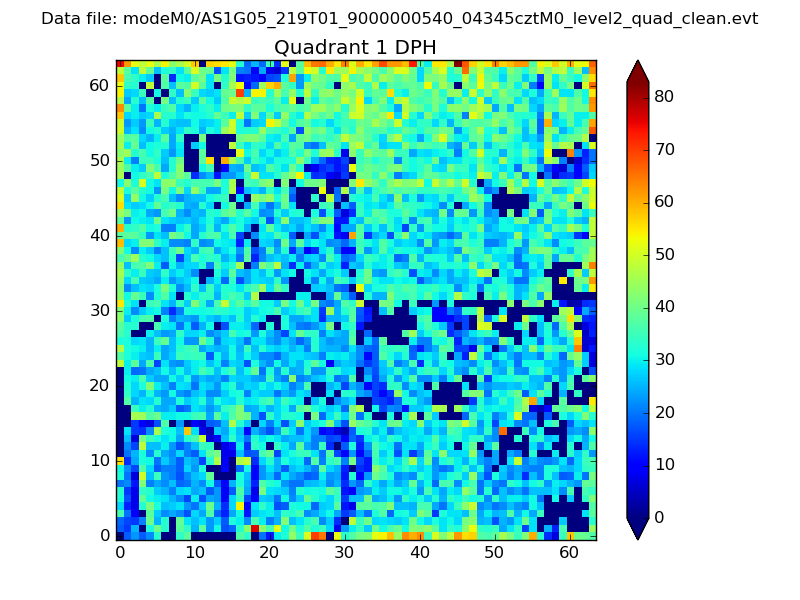 |
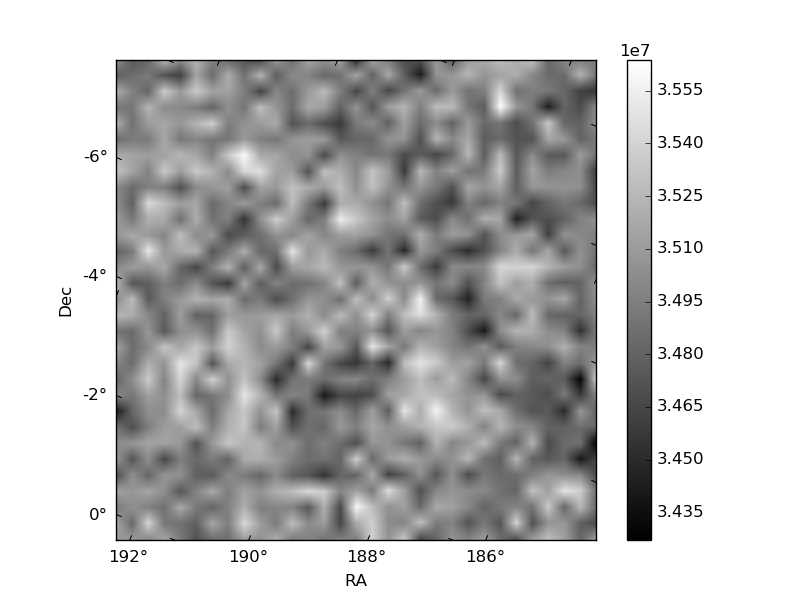
Quadrant B |
|---|---|---|---|
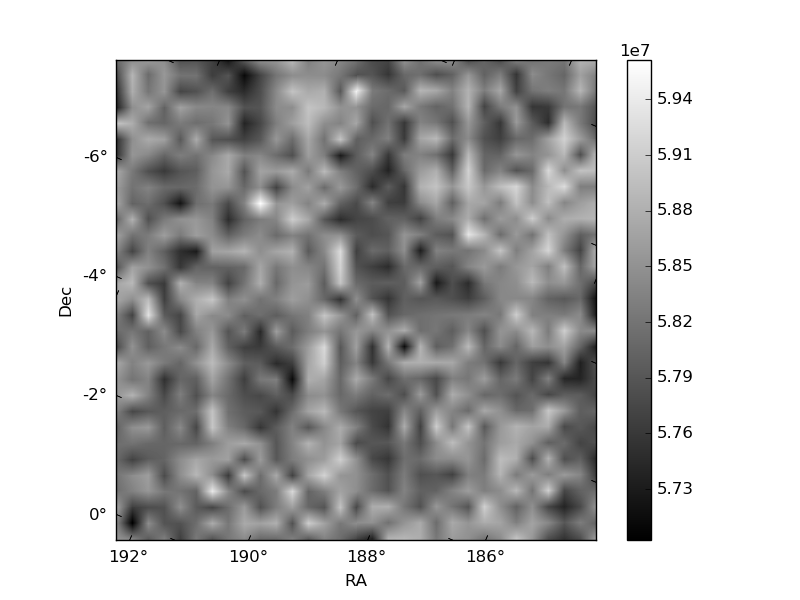
| Quadrant D | 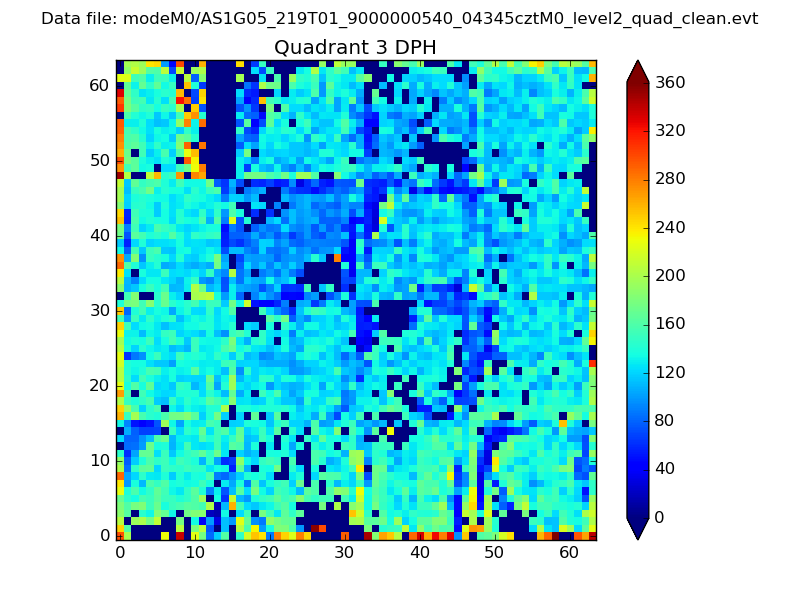 |
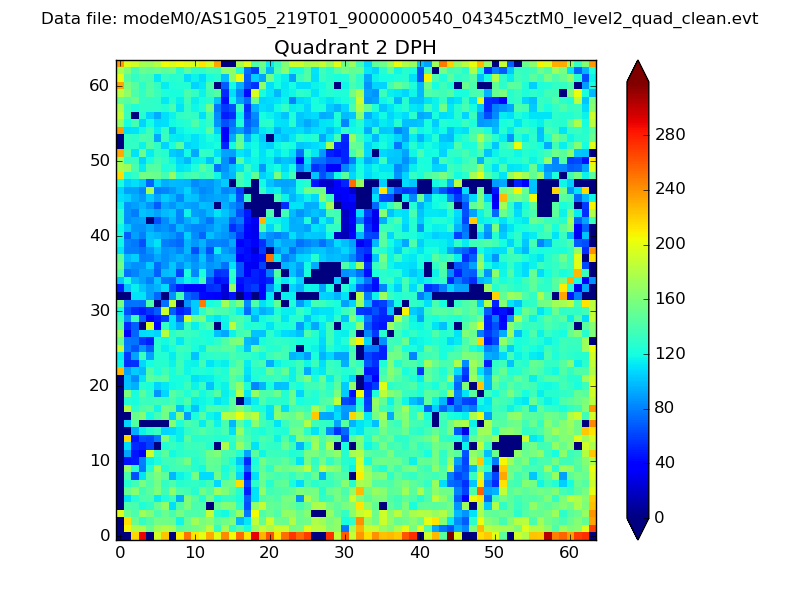 |
Quadrant C |
| Plot type | Count rate plots | Images |
|---|---|---|
| Comparison with Poisson distribution Blue bars denote a histogram of data divided into 1 sec bins. Red curve is a Poisson curve with rate = median count rate of data. |
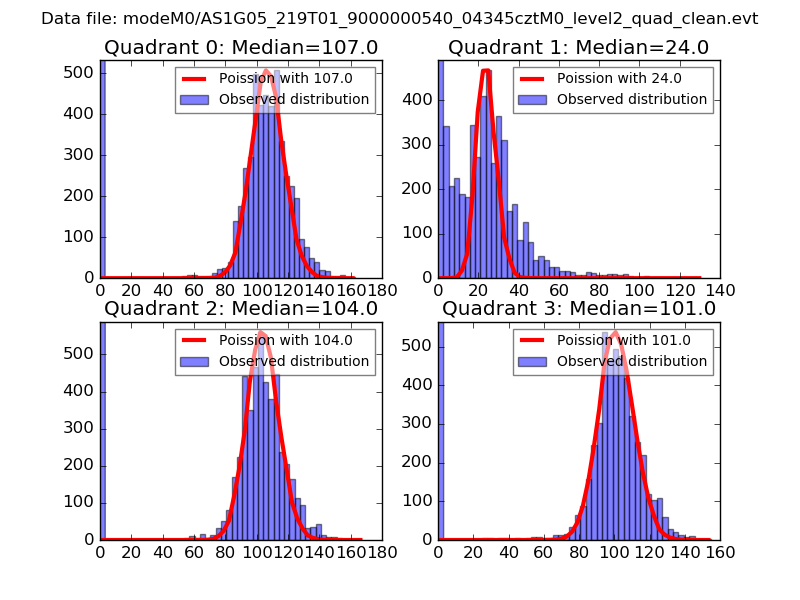 |
 |
| Quadrant-wise count rates Data is divided into 100 sec bins |
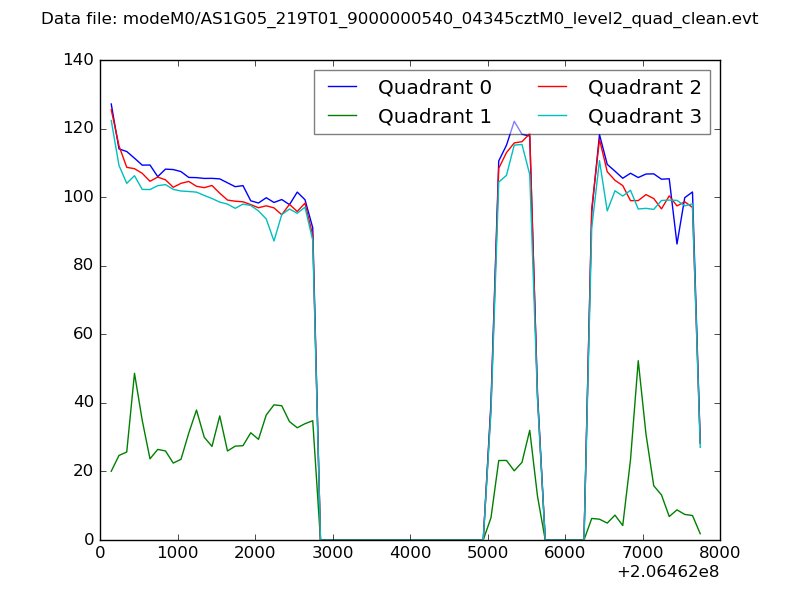 |
|
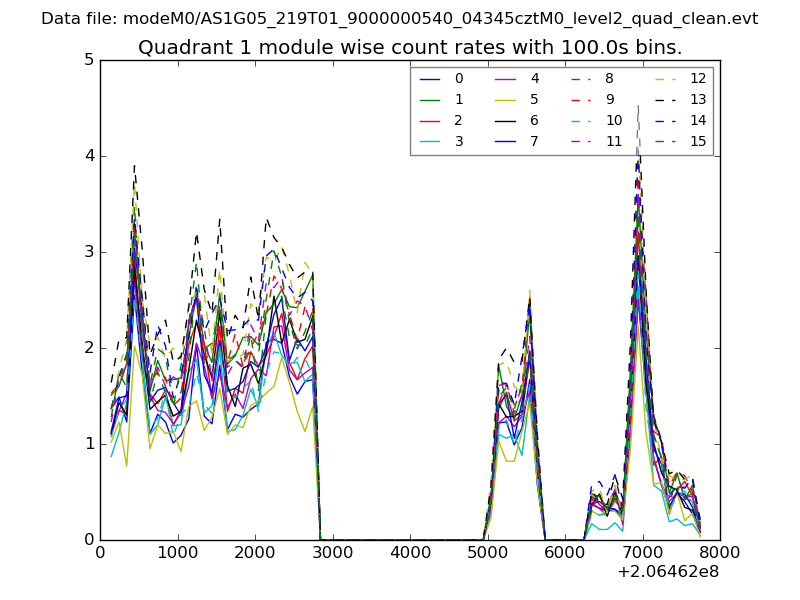
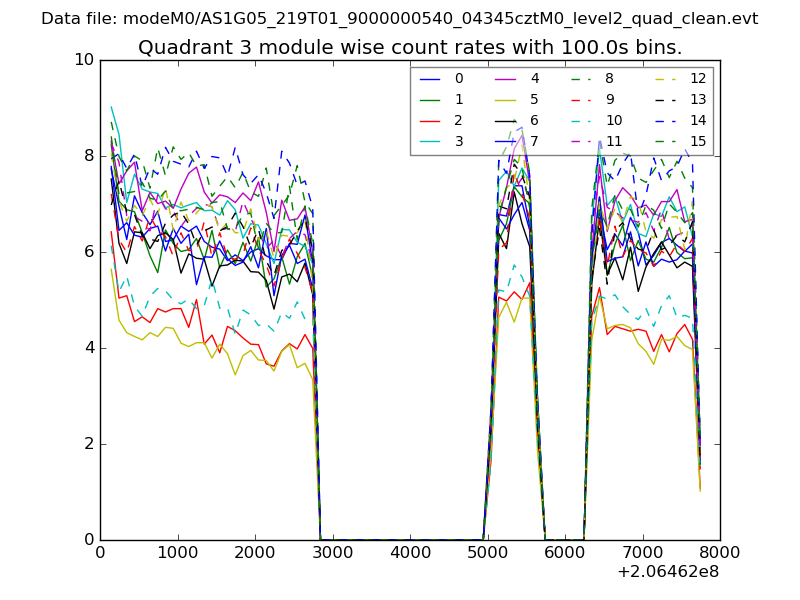
| Module-wise count rates for Quadrant A Data is divided into 100 sec bins |
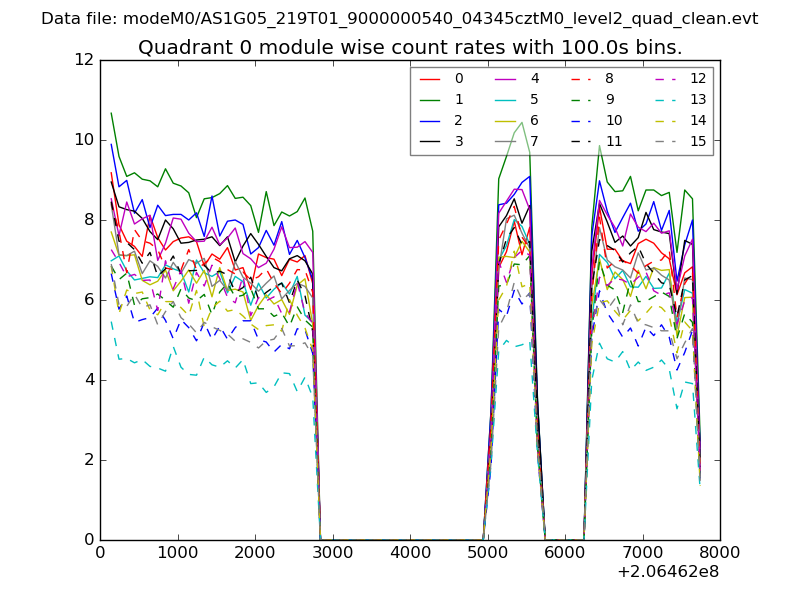 |
 |
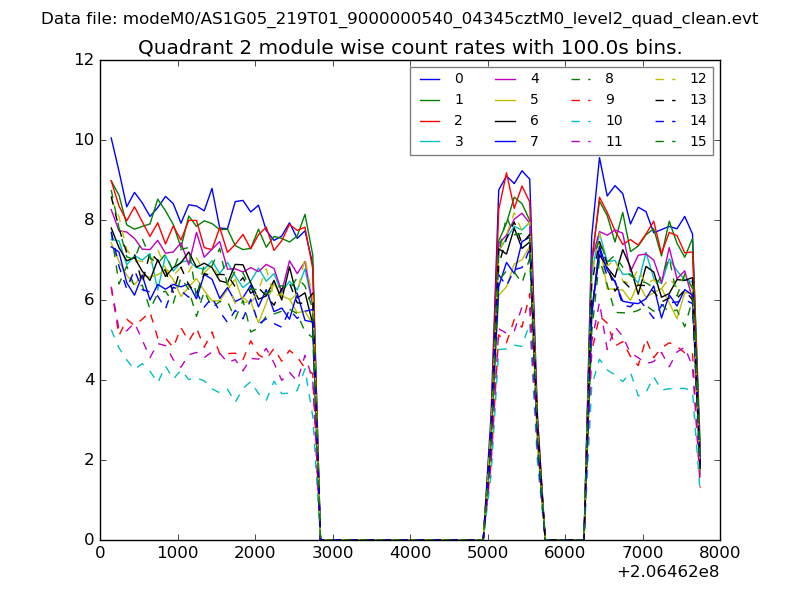
| Module-wise count rates for Quadrant B Data is divided into 100 sec bins |
 |
 |
| Module-wise count rates for Quadrant C Data is divided into 100 sec bins |
 |
 |
| Module-wise count rates for Quadrant D Data is divided into 100 sec bins |
 |
 |
| Parameter | Plot |
|---|---|
| CZT HV Monitor | 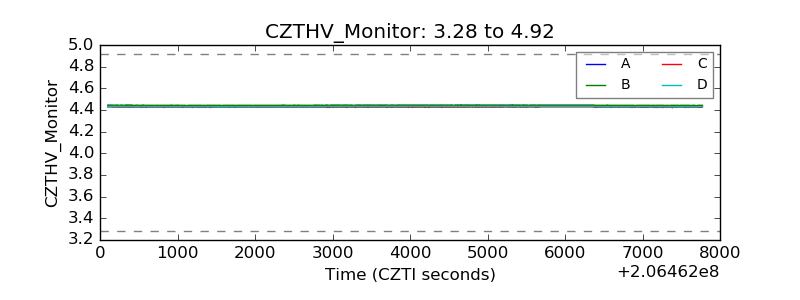 |
| D_VDD | 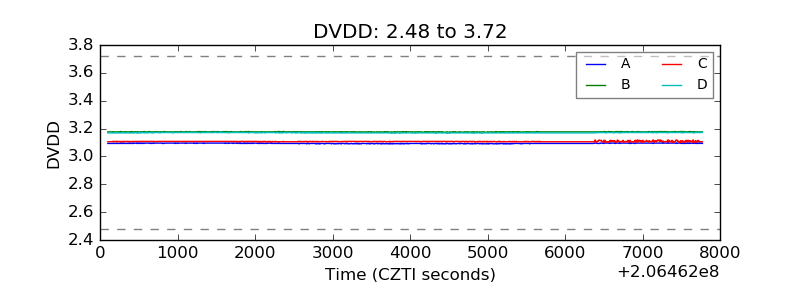 |
| Temperature 1 | 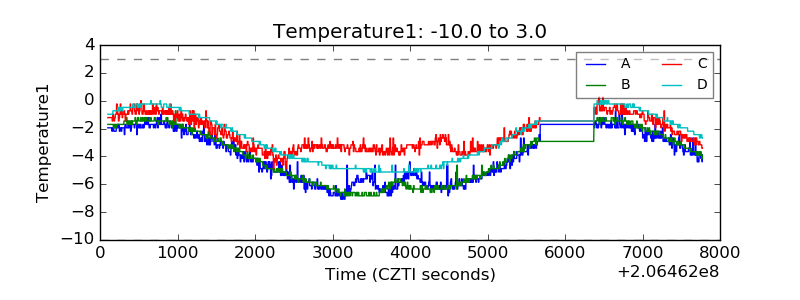 |
| Veto HV Monitor | 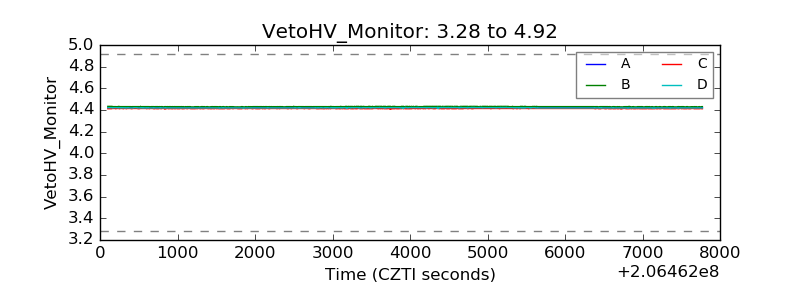 |
| Veto LLD | 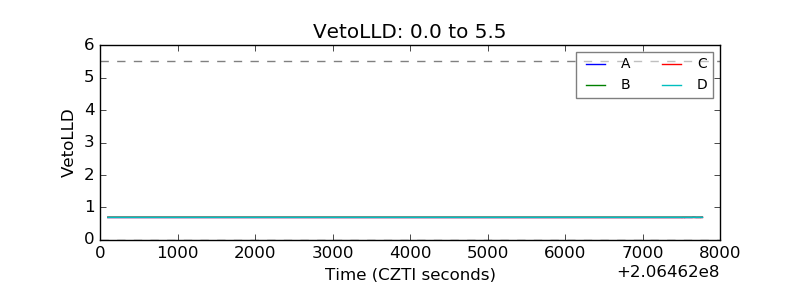 |
| Alpha Counter | 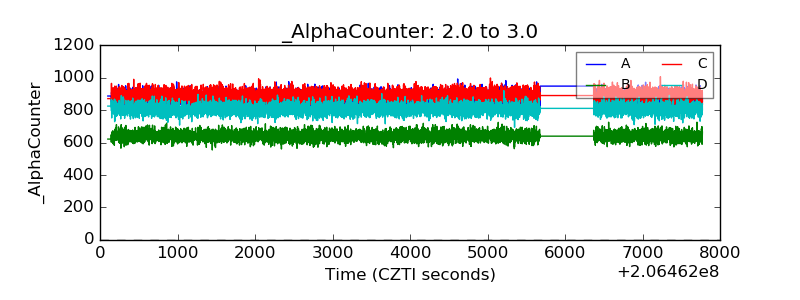 |
| _CPM_Rate | 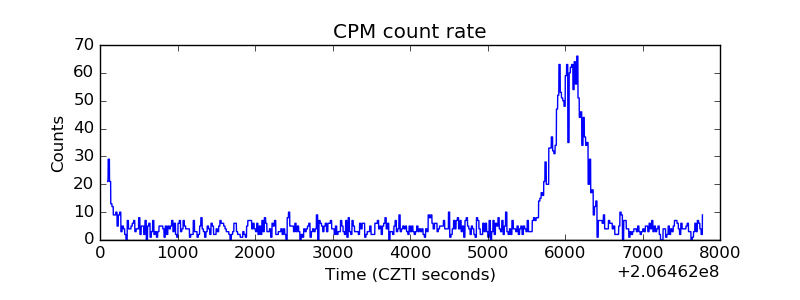 |
| CZT Counter | 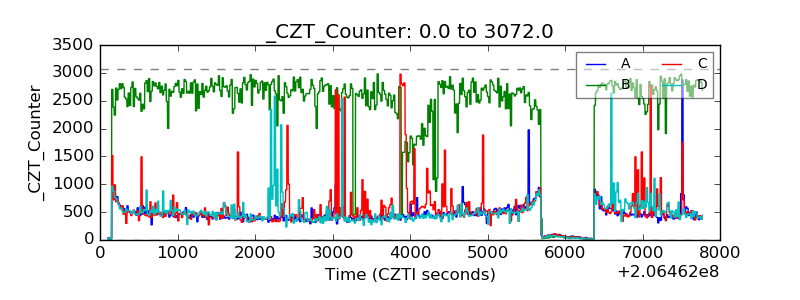 |
| +2.5 Volts monitor |  |
| +5 Volts monitor |  |
| _ROLL_ROT | 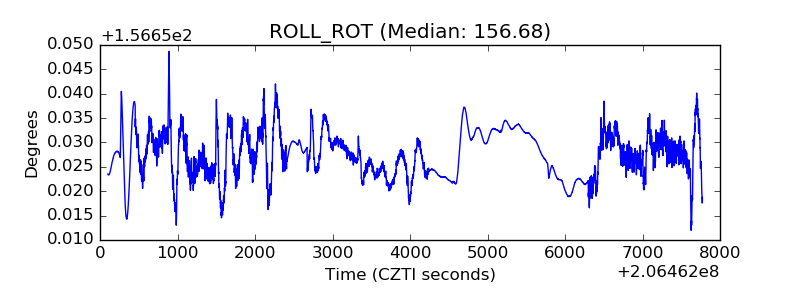 |
| _Roll_DEC |  |
| _Roll_RA | 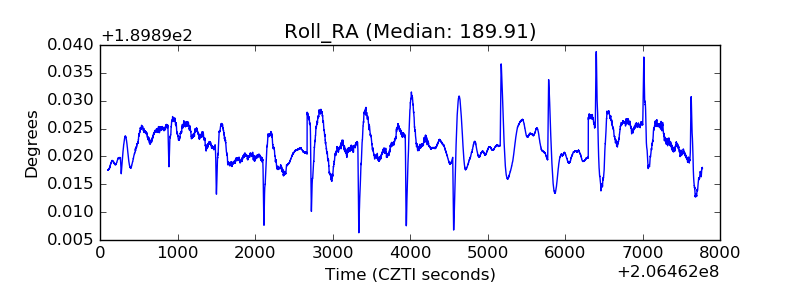 |
| Veto Counter | 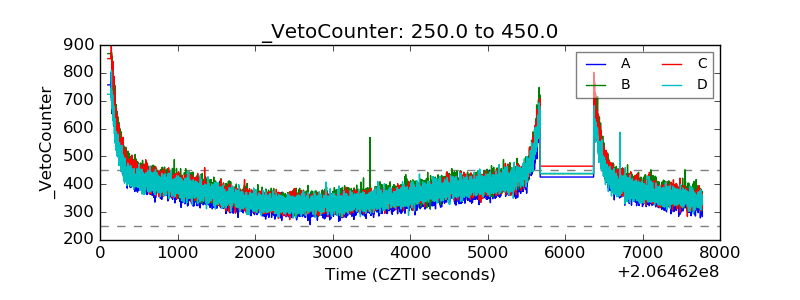 |