| Param | Original file | Final file |
|---|---|---|
| Filename | modeM0/AS1G05_219T01_9000000540_04347cztM0_level2.evt | modeM0/AS1G05_219T01_9000000540_04347cztM0_level2_quad_clean.evt |
| Size (bytes) | 999,699,840 | 68,641,920 |
| Size | 953.4 MB | 65.5 MB |
| Events in quadrant A | 3,236,243 | 503,859 |
| Events in quadrant B | 18,813,568 | 117,393 |
| Events in quadrant C | 3,885,704 | 489,520 |
| Events in quadrant D | 3,857,139 | 467,056 |
| Mode SS | |||
|---|---|---|---|
| Quadrant | BADHDUFLAG | Total packets | Discarded packets |
| A | 0 | 146 | 0 |
| B | 0 | 146 | 0 |
| C | 0 | 146 | 0 |
| D | 0 | 146 | 0 |
| Mode M9 | |||
|---|---|---|---|
| Quadrant | BADHDUFLAG | Total packets | Discarded packets |
| A | 0 | 2 | 0 |
| B | 0 | 2 | 0 |
| C | 0 | 2 | 0 |
| D | 0 | 2 | 0 |
| Mode M0 | |||
|---|---|---|---|
| Quadrant | BADHDUFLAG | Total packets | Discarded packets |
| A | 0 | 14744 | 2 |
| B | 0 | 60645 | 1 |
| C | 0 | 16652 | 1 |
| D | 0 | 16498 | 1 |
| Quadrant | Total seconds | Saturated seconds | Saturation percentage |
|---|---|---|---|
| A | 7147 | 43 | 0.601651% |
| B | 7147 | 7117 | 99.580243% |
| C | 7147 | 85 | 1.189310% |
| D | 7147 | 224 | 3.134182% |
Noise dominated data is calculated using 1-second bins in cleaned event files. If a bin has >2000 counts, and if more than 50% of those come from <1% of pixels, then it is considered to be noise-dominated and hence unusable.
| Quadrant | # 1 sec bins | Bins with >0 counts | Bins with >2000 counts | High rate bins dominated by noise | Noise dominated (total time) | Noise dominated (detector-on time) | Marked lightcurve |
|---|---|---|---|---|---|---|---|
| A | 7397 | 7148 | 4 | 4 | 0.05% | 0.06% | 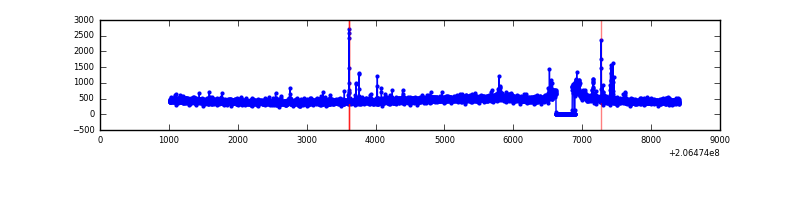 |
| B | 7396 | 7146 | 7027 | 7027 | 95.01% | 98.33% | 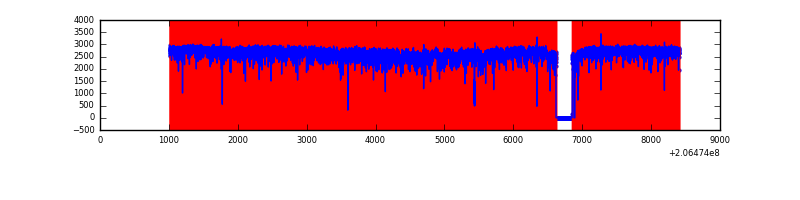 |
| C | 7397 | 7149 | 62 | 62 | 0.84% | 0.87% | 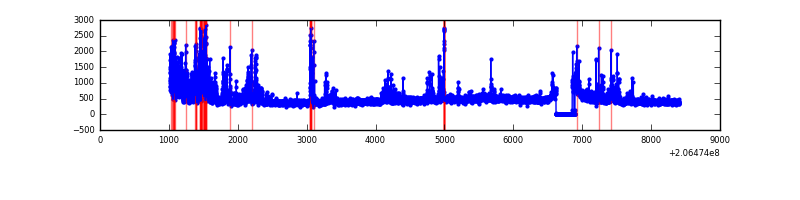 |
| D | 7397 | 7149 | 213 | 213 | 2.88% | 2.98% | 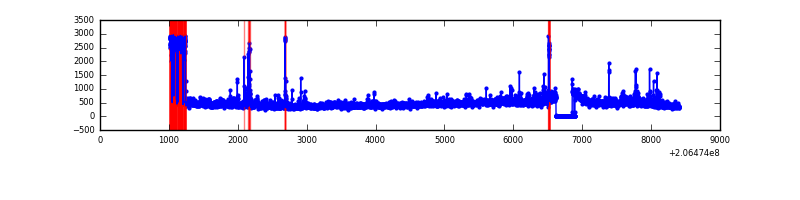 |
Top three noisy pixels from each quadrant. If the there are fewer than three noisy pixels in the level2.evt file, extra rows are filled as -1
| Pixel properties | Quadrant properties | ||||||
|---|---|---|---|---|---|---|---|
| Quadrant | DetID | PixID | Counts | Sigma | Mean | Median | Sigma |
| A | 13 | 251 | 34449 | 201.76 | 814 | 797 | 166.8 |
| A | 15 | 234 | 25415 | 147.6 | 814 | 797 | 166.8 |
| A | 0 | 13 | 16195 | 92.32 | 814 | 797 | 166.8 |
| B | 3 | 0 | 17581569 | 302823.92 | 300 | 293 | 58.1 |
| B | 14 | 167 | 30416 | 518.85 | 300 | 293 | 58.1 |
| B | 15 | 204 | 10224 | 171.05 | 300 | 293 | 58.1 |
| C | 9 | 247 | 821484 | 4460.6 | 782 | 785 | 184.0 |
| C | 10 | 65 | 6863 | 33.03 | 782 | 785 | 184.0 |
| C | 13 | 61 | 6502 | 31.07 | 782 | 785 | 184.0 |
| D | 9 | 35 | 497635 | 2646.98 | 768 | 744 | 187.7 |
| D | 13 | 53 | 156269 | 828.49 | 768 | 744 | 187.7 |
| D | 8 | 112 | 98810 | 522.41 | 768 | 744 | 187.7 |
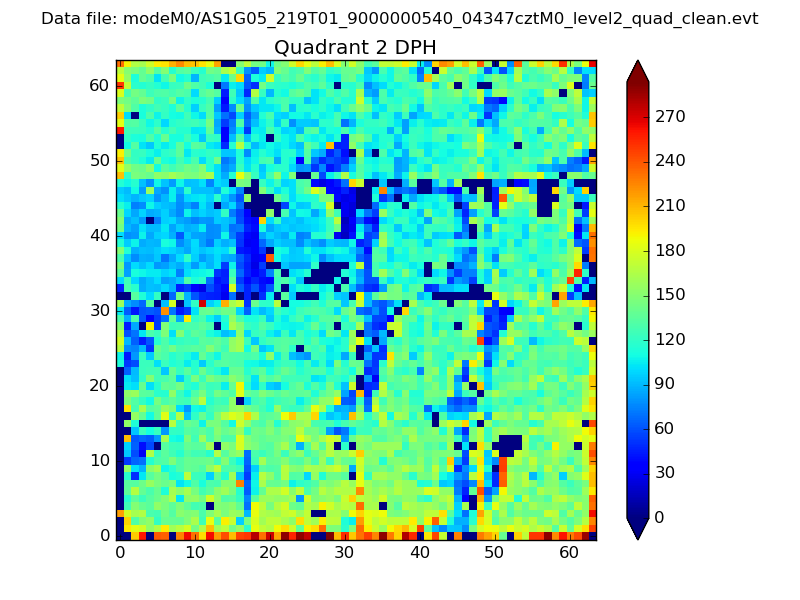
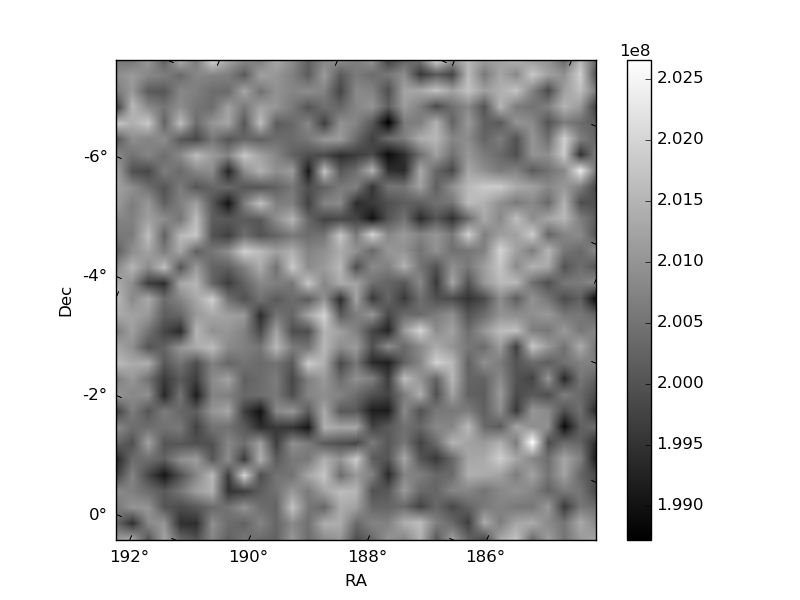
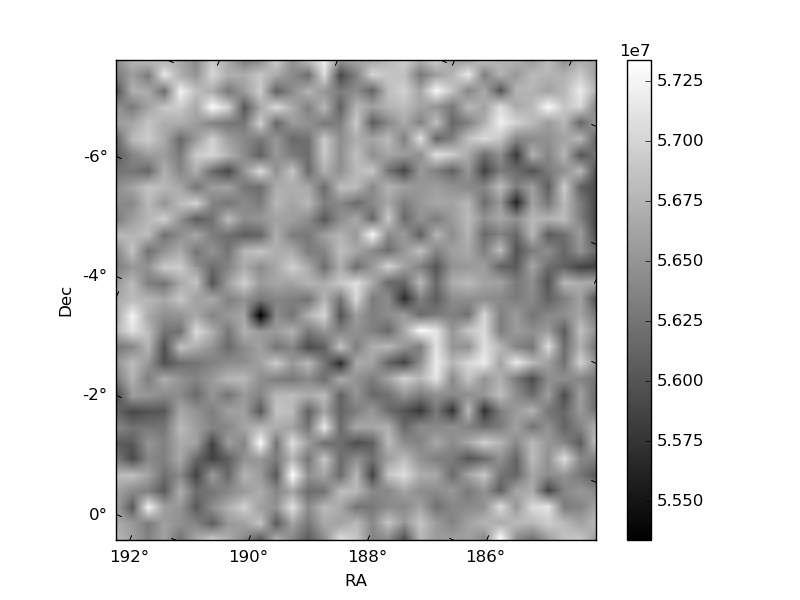
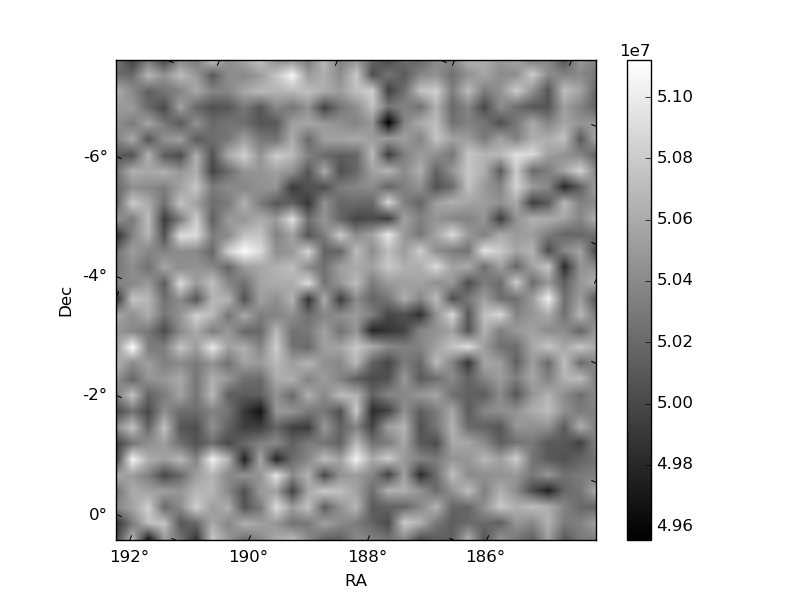
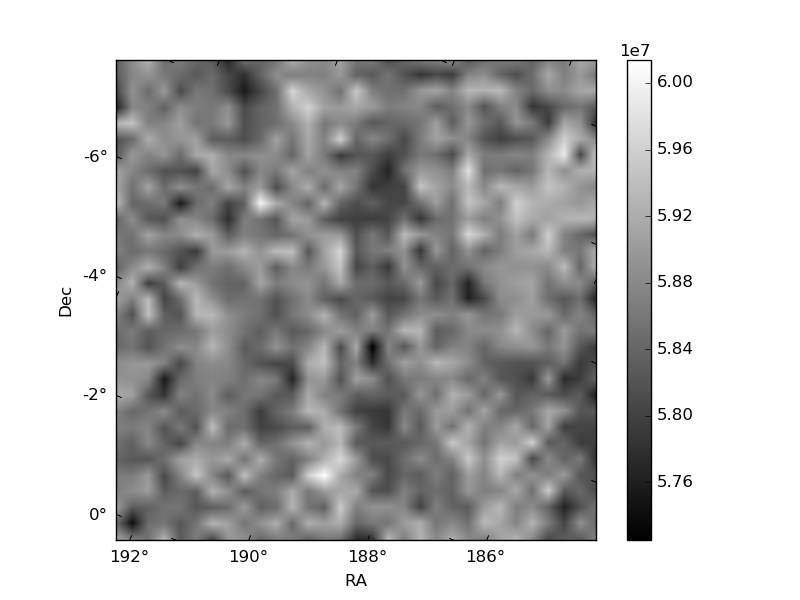
Histogram calculated using DETX and DETY for each event in the final _common_clean file
| Quadrant A | 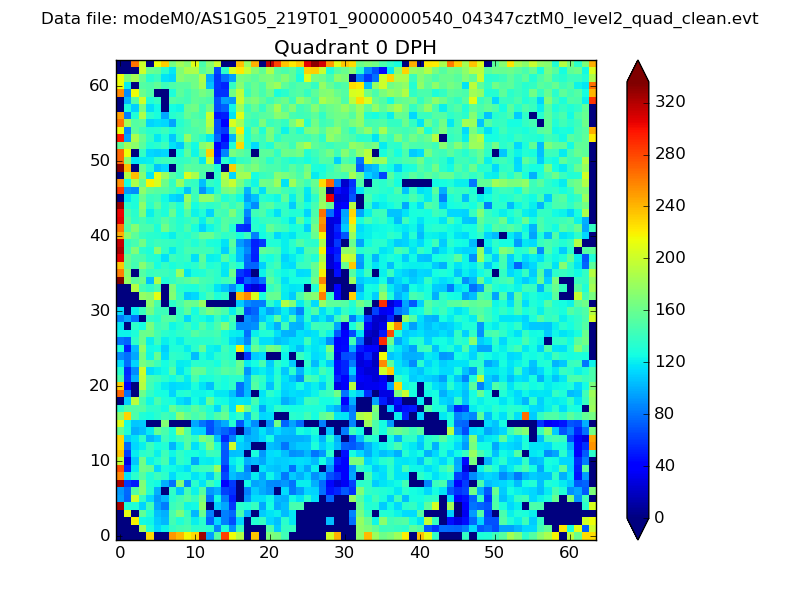 |
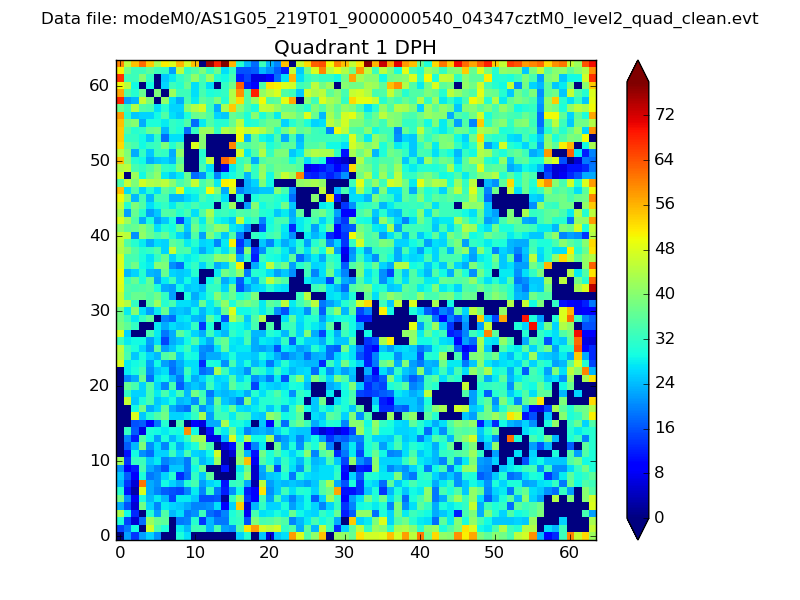 |
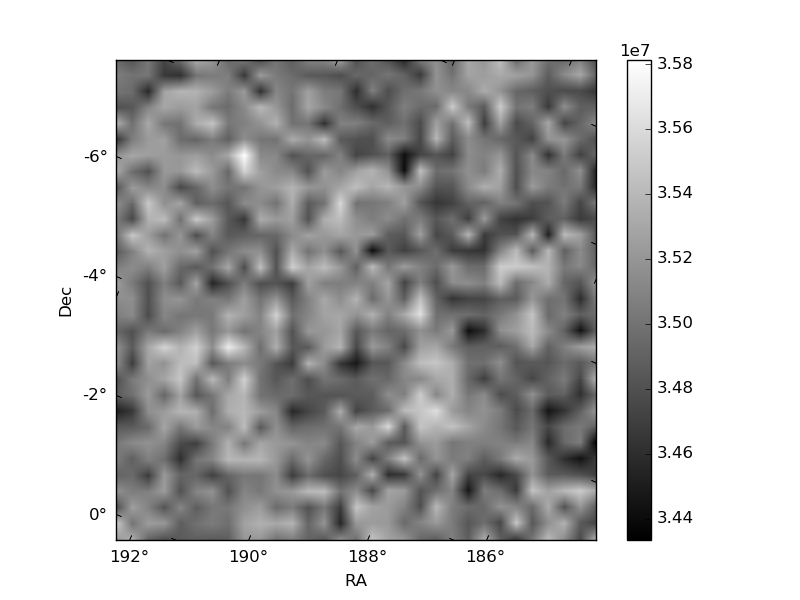
Quadrant B |
|---|---|---|---|
| Quadrant D | 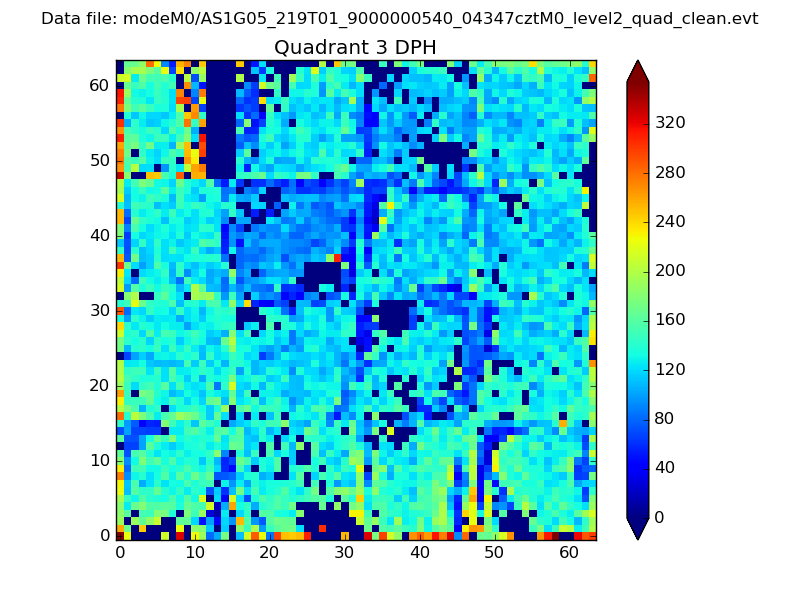 |
 |
Quadrant C |
| Plot type | Count rate plots | Images |
|---|---|---|
| Comparison with Poisson distribution Blue bars denote a histogram of data divided into 1 sec bins. Red curve is a Poisson curve with rate = median count rate of data. |
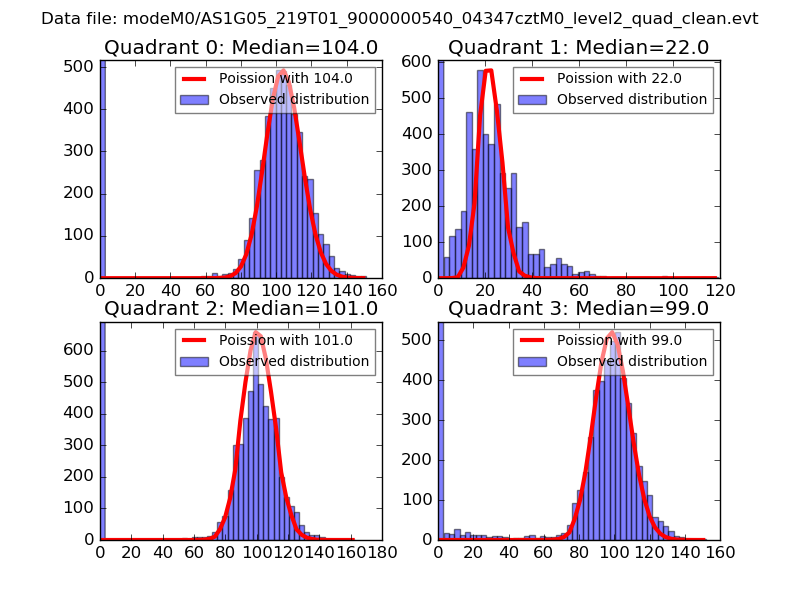 |
 |
| Quadrant-wise count rates Data is divided into 100 sec bins |
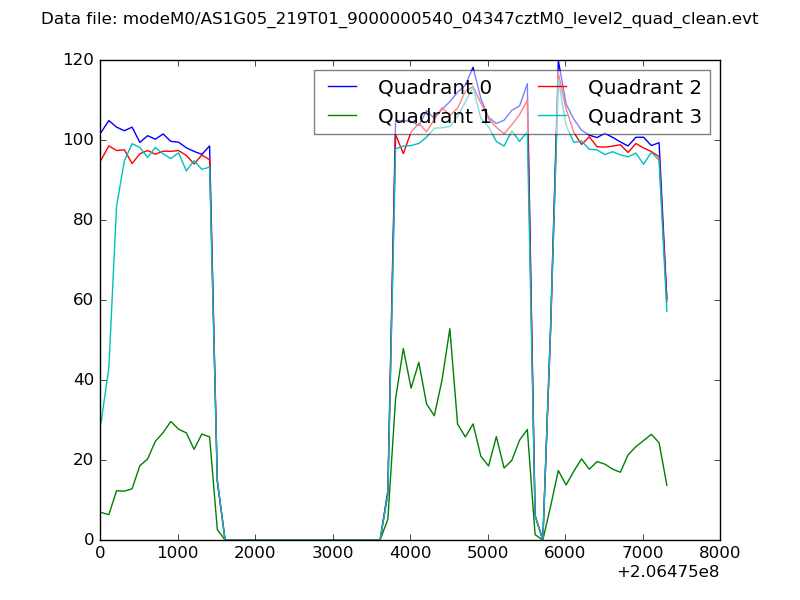 |
|
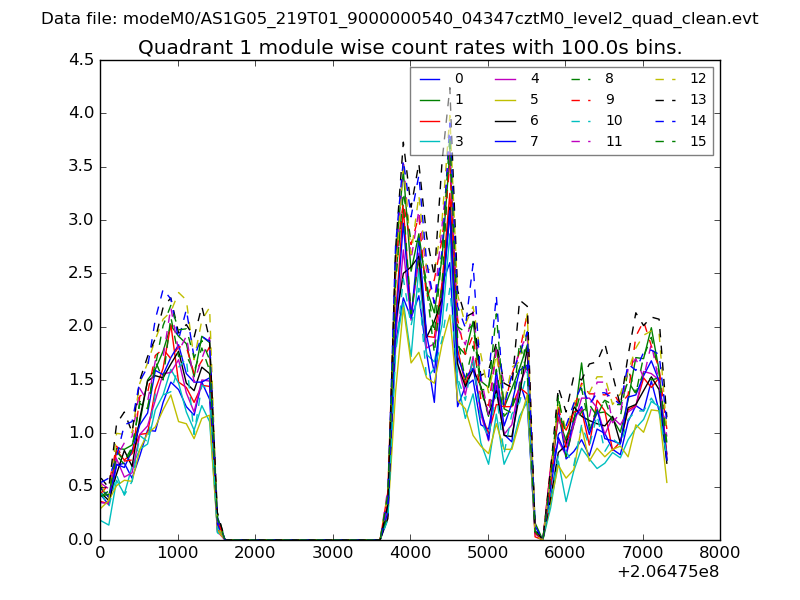
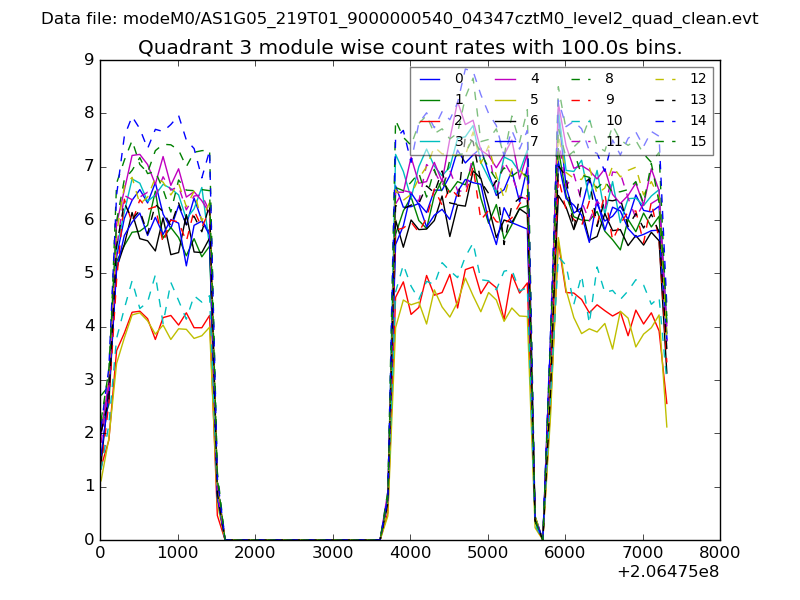
| Module-wise count rates for Quadrant A Data is divided into 100 sec bins |
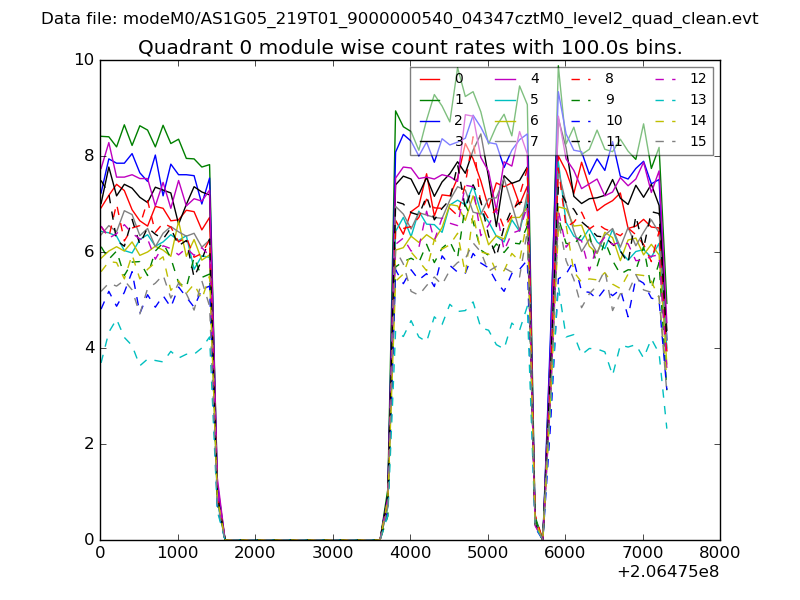 |
 |
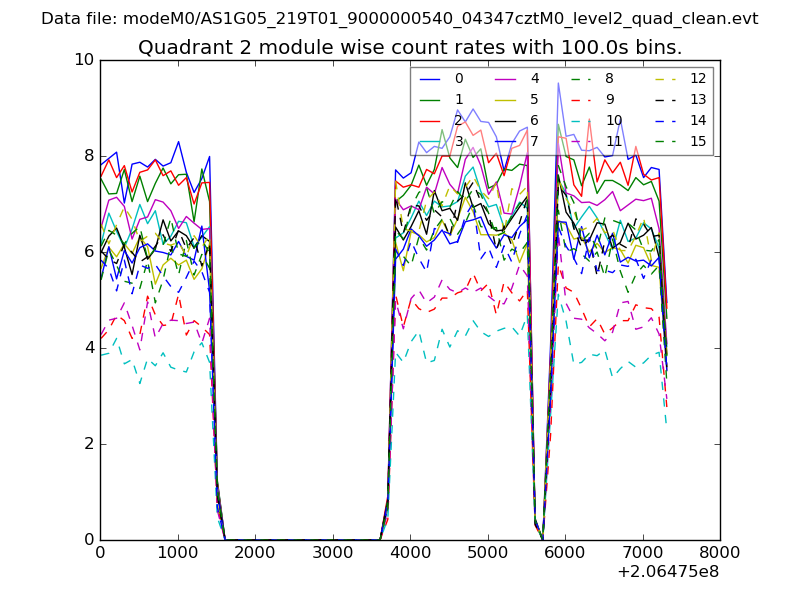
| Module-wise count rates for Quadrant B Data is divided into 100 sec bins |
 |
 |
| Module-wise count rates for Quadrant C Data is divided into 100 sec bins |
 |
 |
| Module-wise count rates for Quadrant D Data is divided into 100 sec bins |
 |
 |
| Parameter | Plot |
|---|---|
| CZT HV Monitor |  |
| D_VDD | 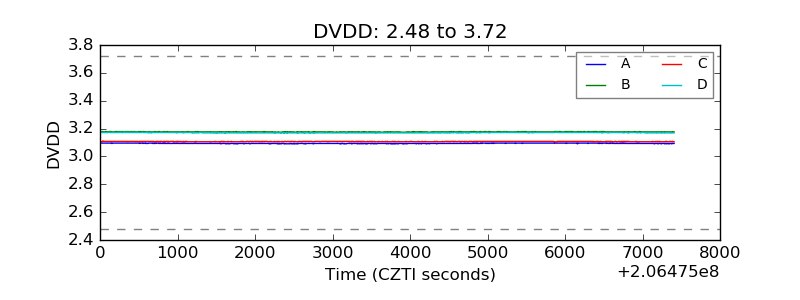 |
| Temperature 1 | 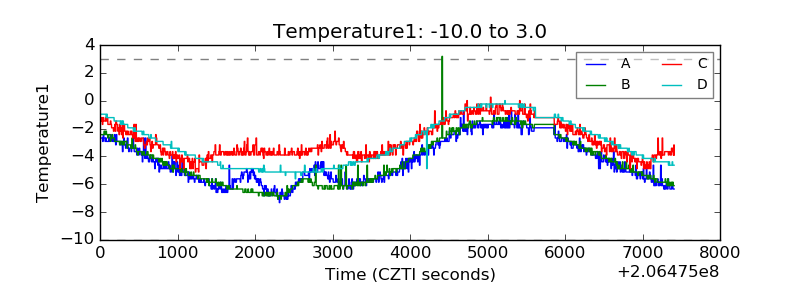 |
| Veto HV Monitor | 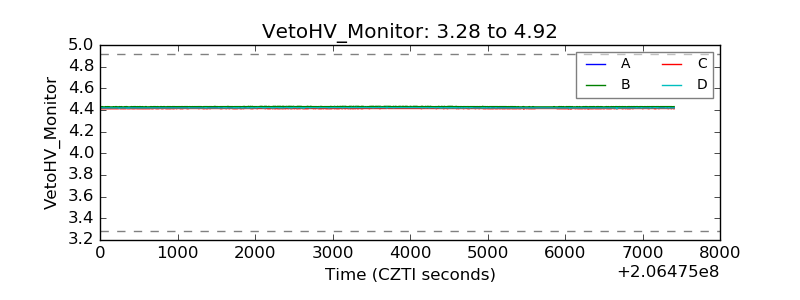 |
| Veto LLD | 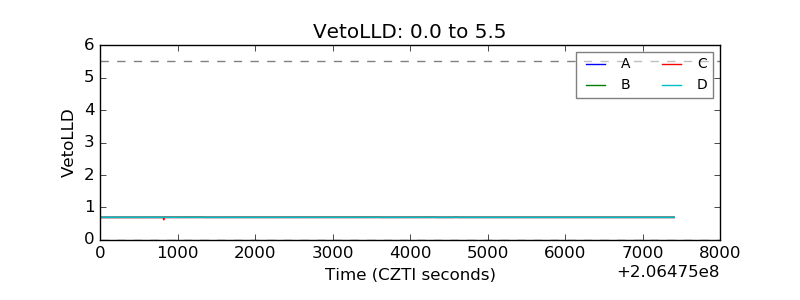 |
| Alpha Counter | 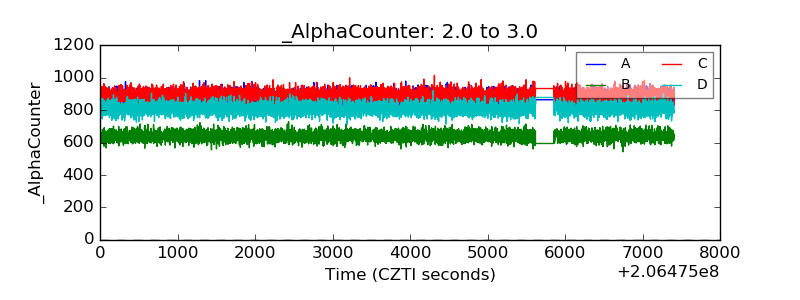 |
| _CPM_Rate | 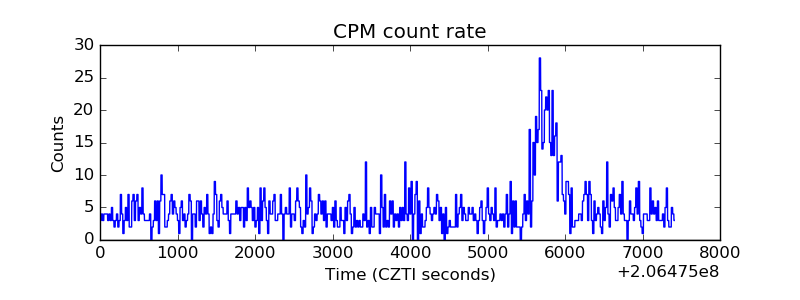 |
| CZT Counter | 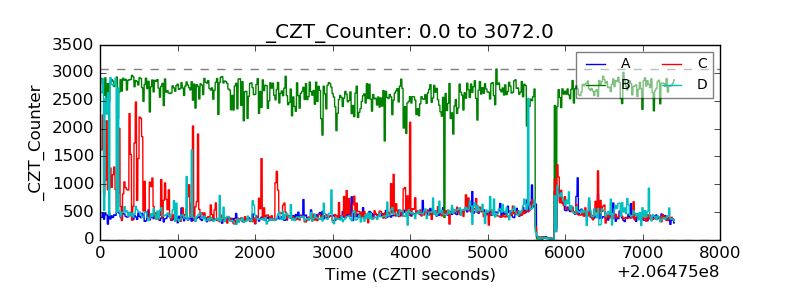 |
| +2.5 Volts monitor |  |
| +5 Volts monitor |  |
| _ROLL_ROT | 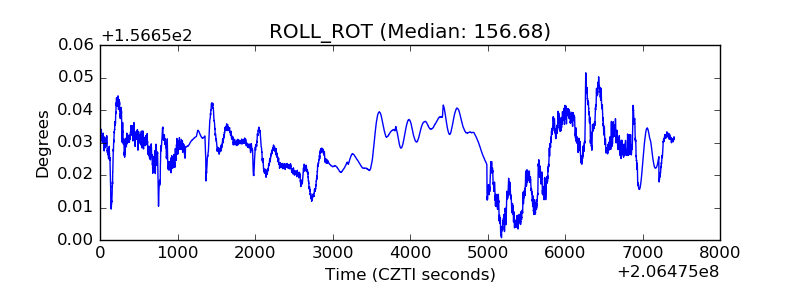 |
| _Roll_DEC | 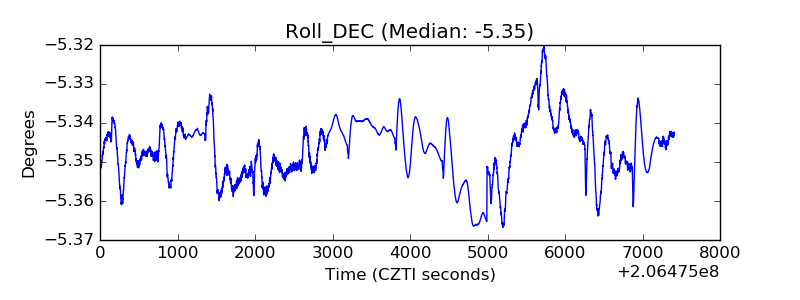 |
| _Roll_RA | 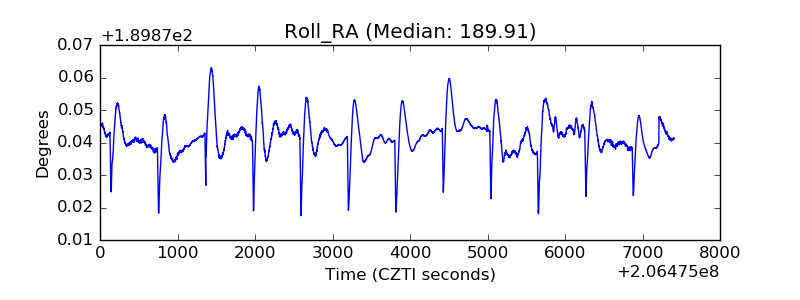 |
| Veto Counter | 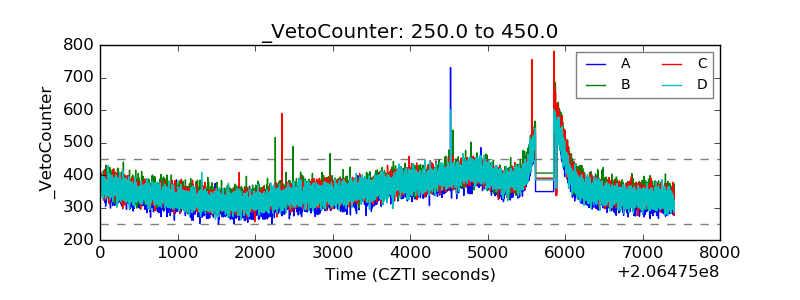 |