| Param | Original file | Final file |
|---|---|---|
| Filename | modeM0/AS1G05_219T01_9000000540_04348cztM0_level2.evt | modeM0/AS1G05_219T01_9000000540_04348cztM0_level2_quad_clean.evt |
| Size (bytes) | 324,924,480 | 16,488,000 |
| Size | 309.9 MB | 15.7 MB |
| Events in quadrant A | 1,024,015 | 100,274 |
| Events in quadrant B | 6,392,600 | 21,518 |
| Events in quadrant C | 1,039,474 | 98,567 |
| Events in quadrant D | 1,211,101 | 96,567 |
| Mode SS | |||
|---|---|---|---|
| Quadrant | BADHDUFLAG | Total packets | Discarded packets |
| A | 0 | 50 | 0 |
| B | 0 | 50 | 0 |
| C | 0 | 50 | 0 |
| D | 0 | 50 | 0 |
| Mode M0 | |||
|---|---|---|---|
| Quadrant | BADHDUFLAG | Total packets | Discarded packets |
| A | 0 | 5087 | 1 |
| B | 0 | 20706 | 0 |
| C | 0 | 5158 | 0 |
| D | 0 | 5573 | 5 |
| Quadrant | Total seconds | Saturated seconds | Saturation percentage |
|---|---|---|---|
| A | 2524 | 0 | 0.000000% |
| B | 2524 | 2262 | 89.619651% |
| C | 2524 | 1 | 0.039620% |
| D | 2522 | 16 | 0.634417% |
Noise dominated data is calculated using 1-second bins in cleaned event files. If a bin has >2000 counts, and if more than 50% of those come from <1% of pixels, then it is considered to be noise-dominated and hence unusable.
| Quadrant | # 1 sec bins | Bins with >0 counts | Bins with >2000 counts | High rate bins dominated by noise | Noise dominated (total time) | Noise dominated (detector-on time) | Marked lightcurve |
|---|---|---|---|---|---|---|---|
| A | 2525 | 2525 | 0 | 0 | 0.00% | 0.00% |  |
| B | 2524 | 2523 | 2235 | 2235 | 88.55% | 88.59% |  |
| C | 2525 | 2525 | 1 | 1 | 0.04% | 0.04% |  |
| D | 2524 | 2524 | 19 | 19 | 0.75% | 0.75% |  |
Top three noisy pixels from each quadrant. If the there are fewer than three noisy pixels in the level2.evt file, extra rows are filled as -1
| Pixel properties | Quadrant properties | ||||||
|---|---|---|---|---|---|---|---|
| Quadrant | DetID | PixID | Counts | Sigma | Mean | Median | Sigma |
| A | 13 | 251 | 10560 | 186.91 | 259 | 254 | 55.1 |
| A | 13 | 14 | 6074 | 105.55 | 259 | 254 | 55.1 |
| A | 14 | 111 | 4793 | 82.32 | 259 | 254 | 55.1 |
| B | 3 | 0 | 5856428 | 221160.11 | 129 | 126 | 26.5 |
| B | 14 | 167 | 14997 | 561.6 | 129 | 126 | 26.5 |
| B | 4 | 48 | 6431 | 238.1 | 129 | 126 | 26.5 |
| C | 9 | 247 | 54050 | 886.1 | 251 | 251 | 60.7 |
| C | 10 | 65 | 2321 | 34.09 | 251 | 251 | 60.7 |
| C | 13 | 61 | 2134 | 31.01 | 251 | 251 | 60.7 |
| D | 12 | 233 | 77250 | 1248.02 | 246 | 238 | 61.7 |
| D | 13 | 53 | 51373 | 828.67 | 246 | 238 | 61.7 |
| D | 13 | 223 | 47462 | 765.29 | 246 | 238 | 61.7 |
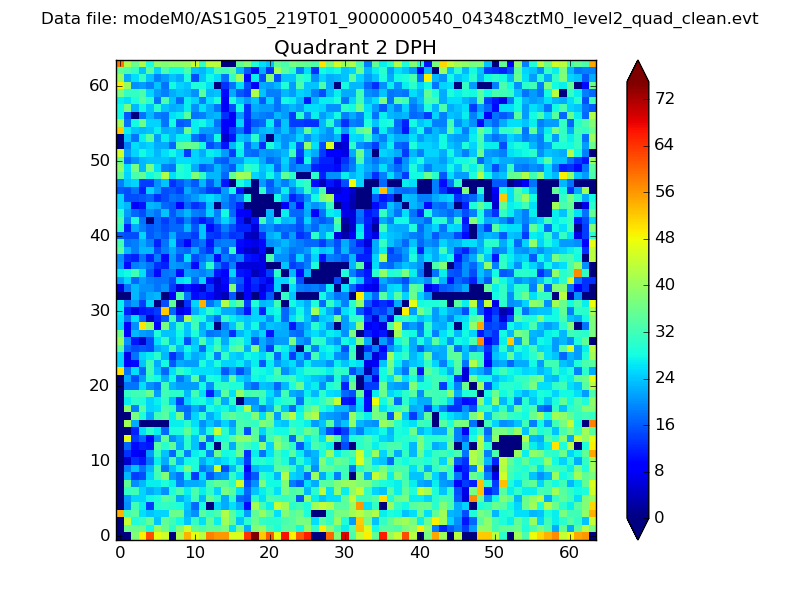
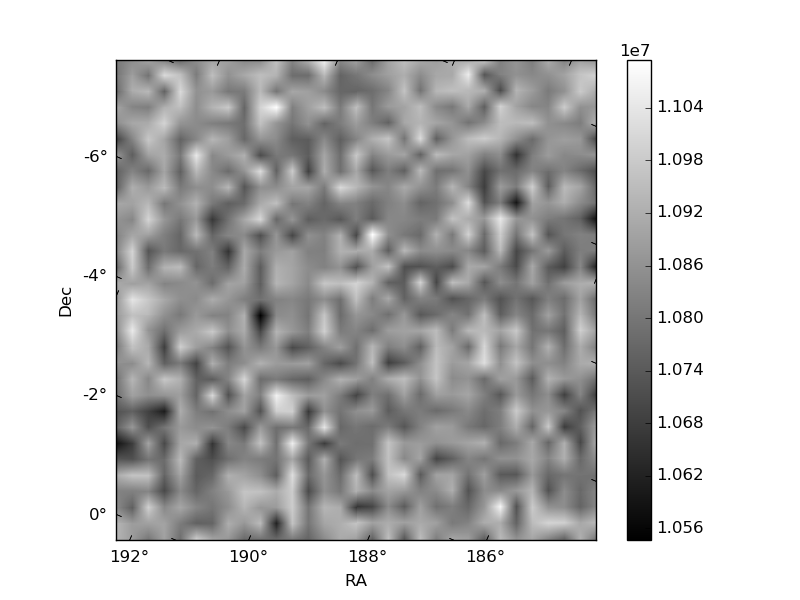
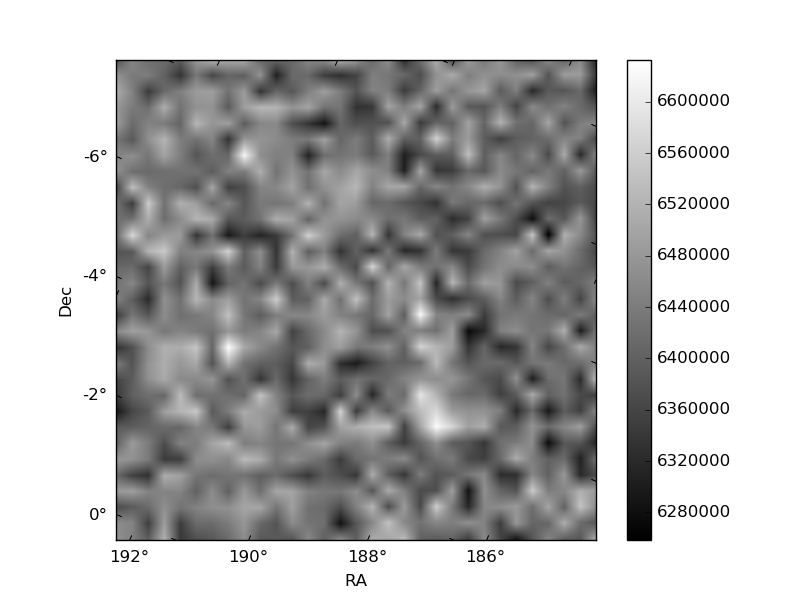
Histogram calculated using DETX and DETY for each event in the final _common_clean file
| Quadrant A | 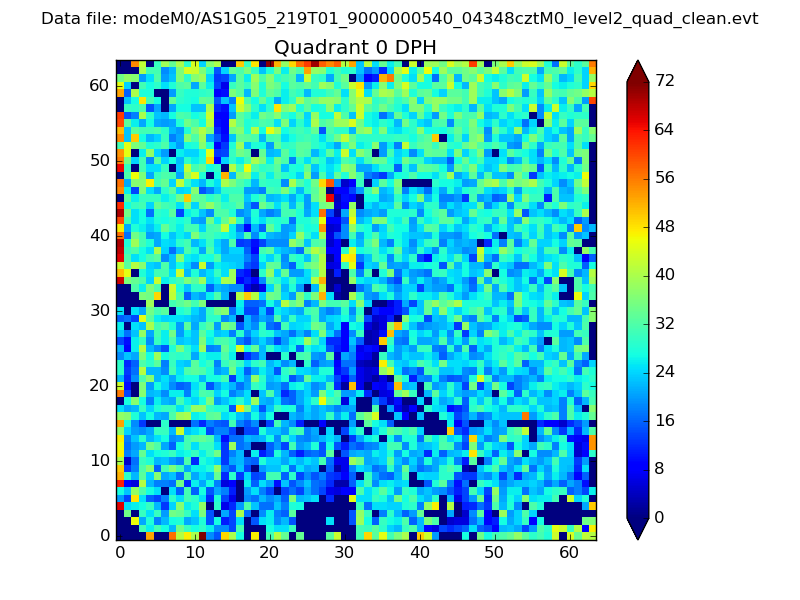 |
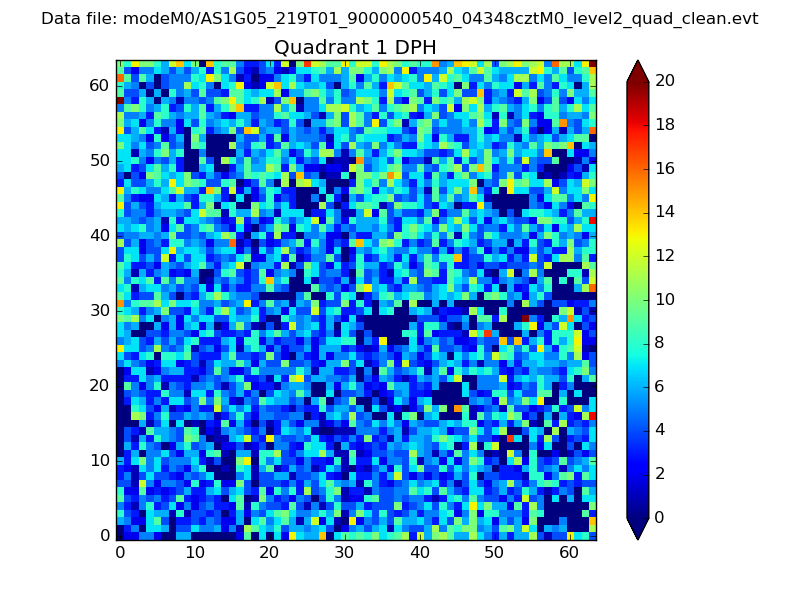 |
Quadrant B |
|---|---|---|---|
| Quadrant D | 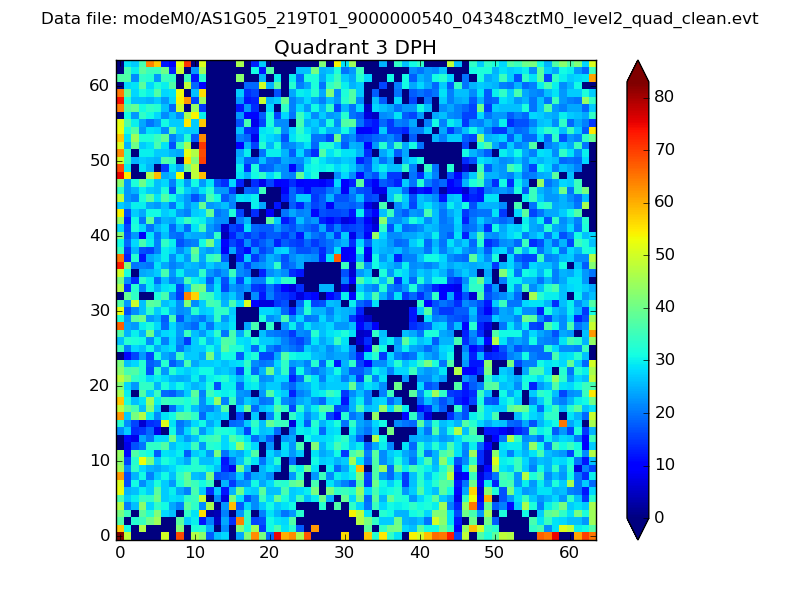 |
 |
Quadrant C |
| Plot type | Count rate plots | Images |
|---|---|---|
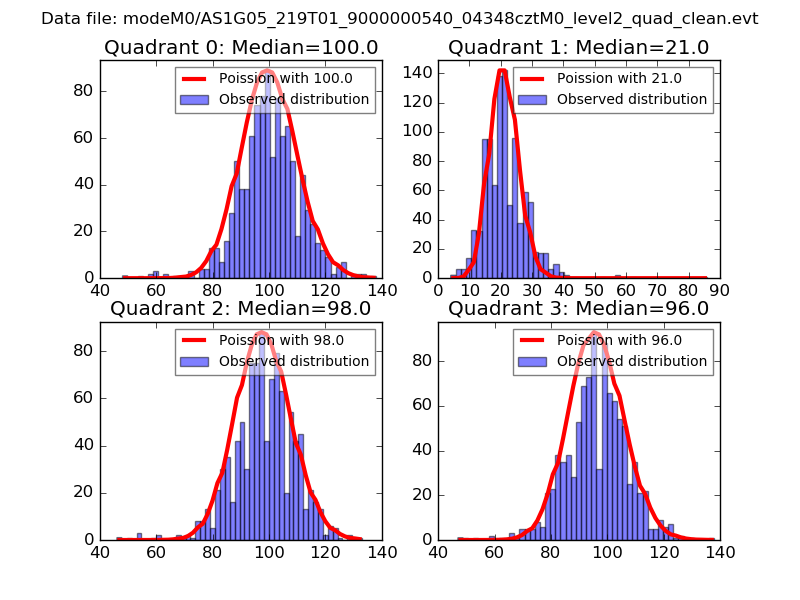
| Comparison with Poisson distribution Blue bars denote a histogram of data divided into 1 sec bins. Red curve is a Poisson curve with rate = median count rate of data. |
 |
 |
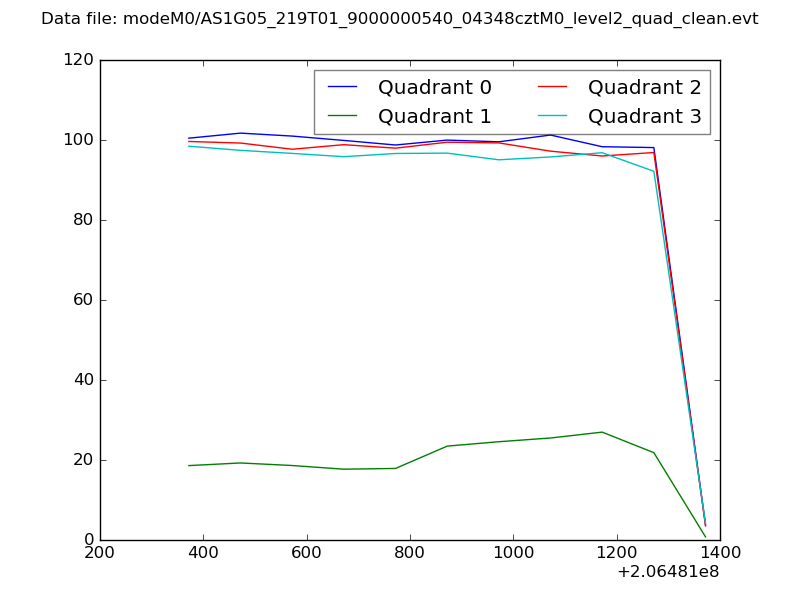
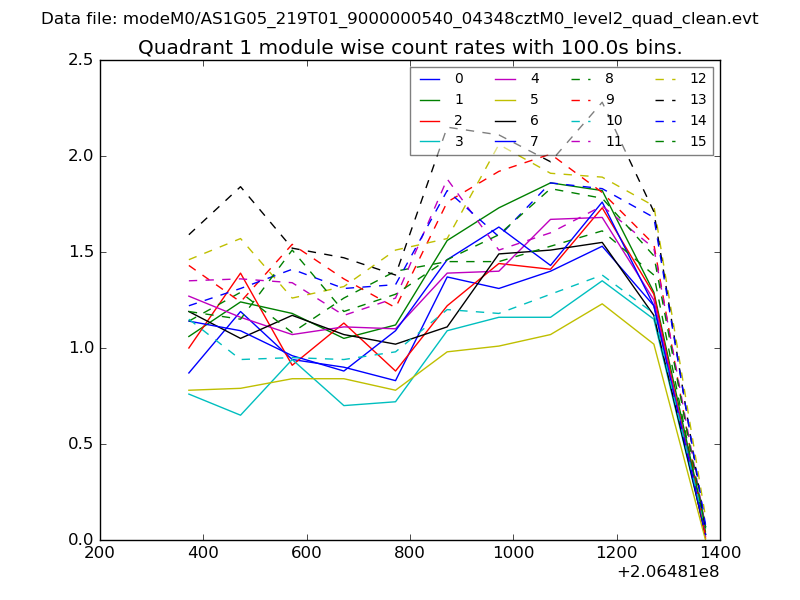
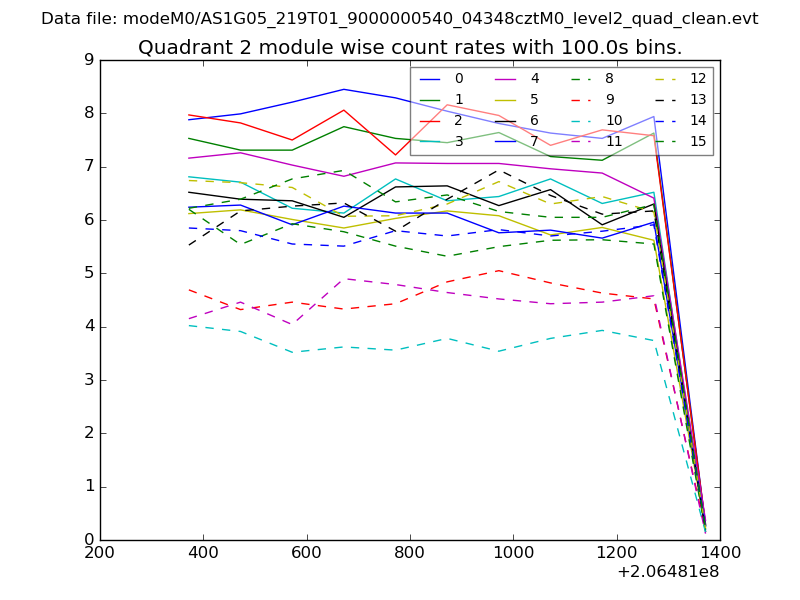
| Quadrant-wise count rates Data is divided into 100 sec bins |
 |
|
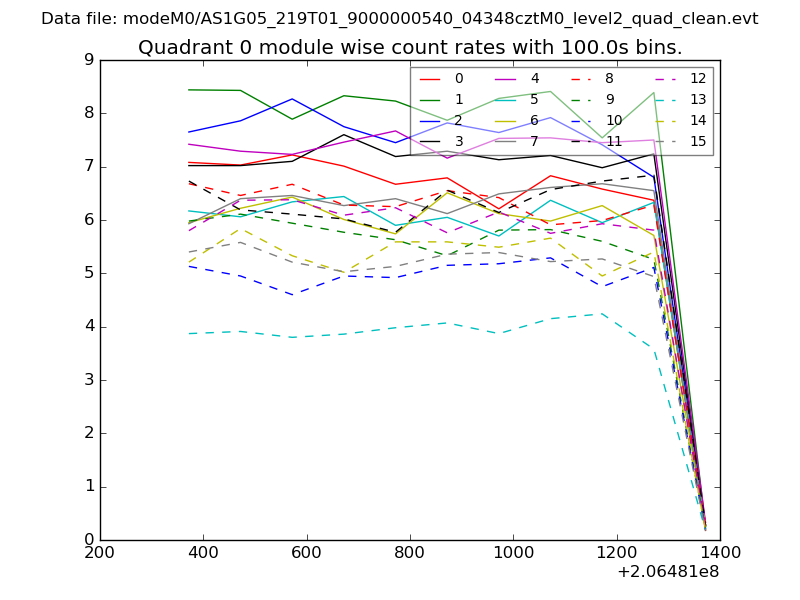
| Module-wise count rates for Quadrant A Data is divided into 100 sec bins |
 |
 |
| Module-wise count rates for Quadrant B Data is divided into 100 sec bins |
 |
 |
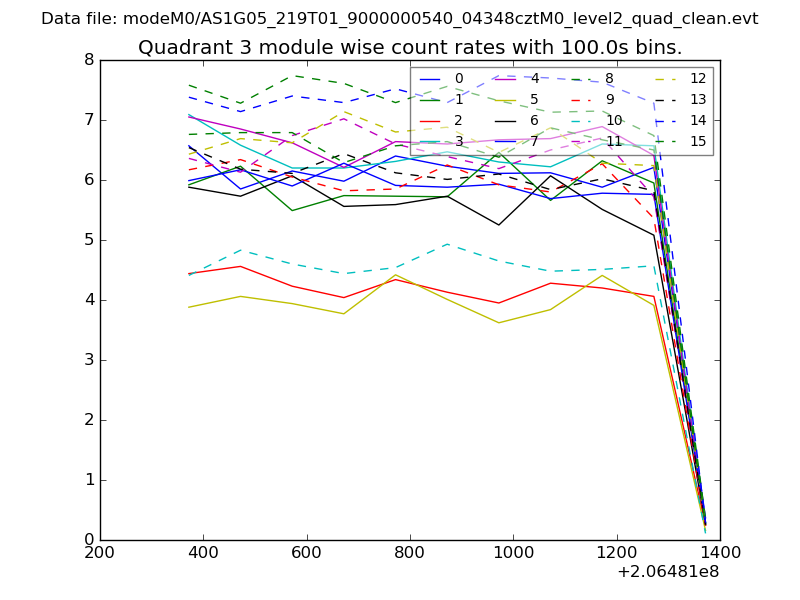
| Module-wise count rates for Quadrant C Data is divided into 100 sec bins |
 |
 |
| Module-wise count rates for Quadrant D Data is divided into 100 sec bins |
 |
 |
| Parameter | Plot |
|---|---|
| CZT HV Monitor | 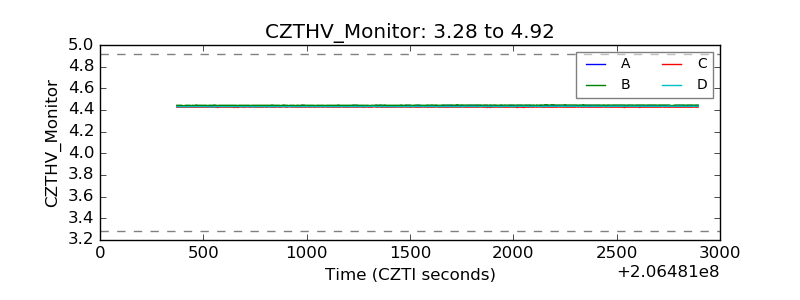 |
| D_VDD | 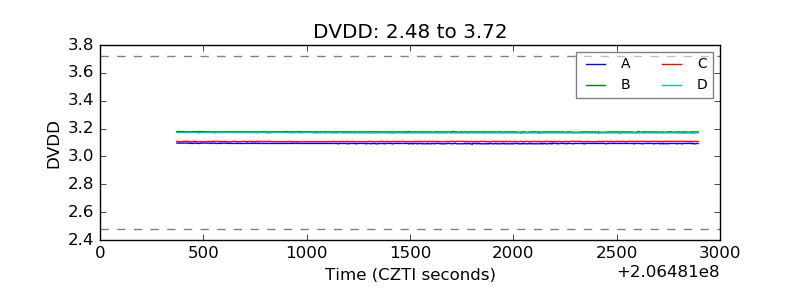 |
| Temperature 1 | 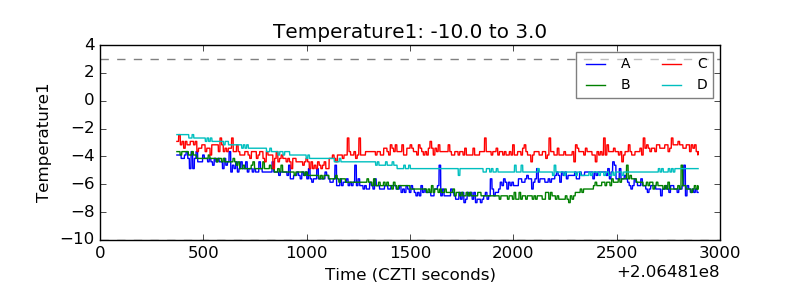 |
| Veto HV Monitor | 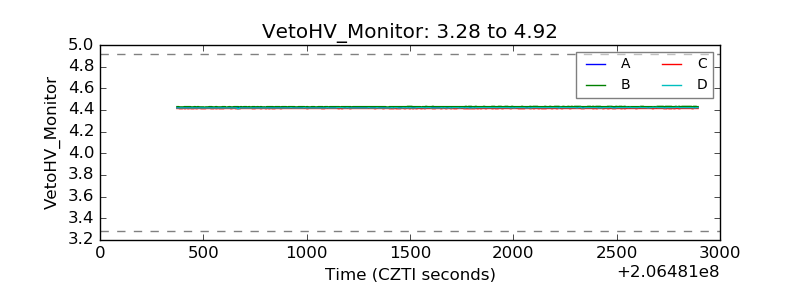 |
| Veto LLD | 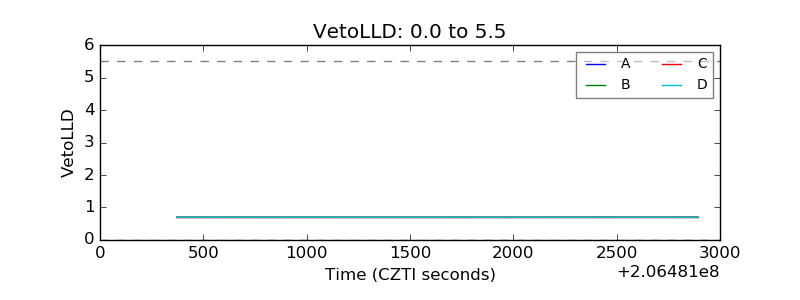 |
| Alpha Counter | 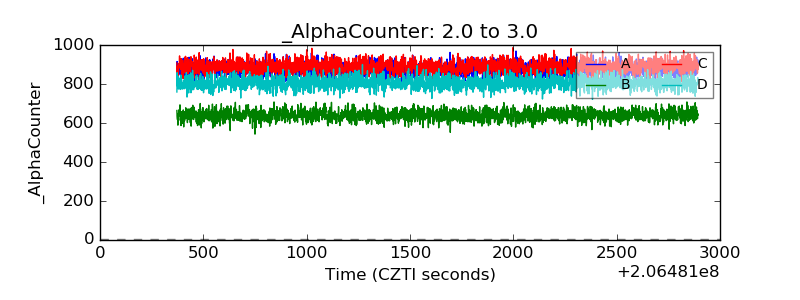 |
| _CPM_Rate | 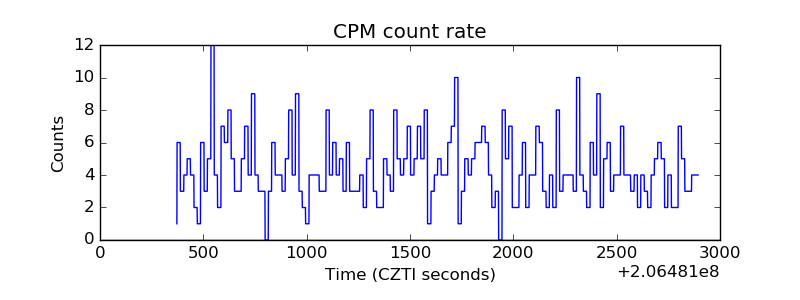 |
| CZT Counter | 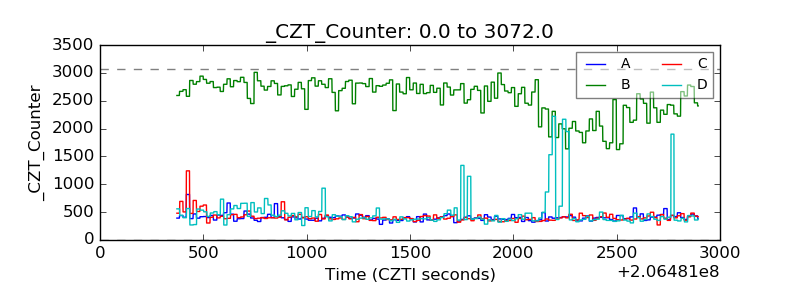 |
| +2.5 Volts monitor |  |
| +5 Volts monitor | 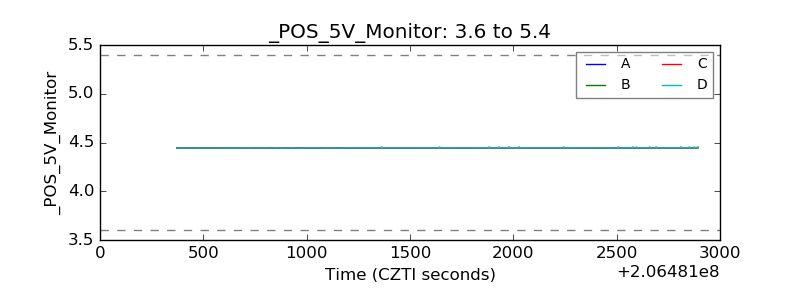 |
| _ROLL_ROT |  |
| _Roll_DEC | 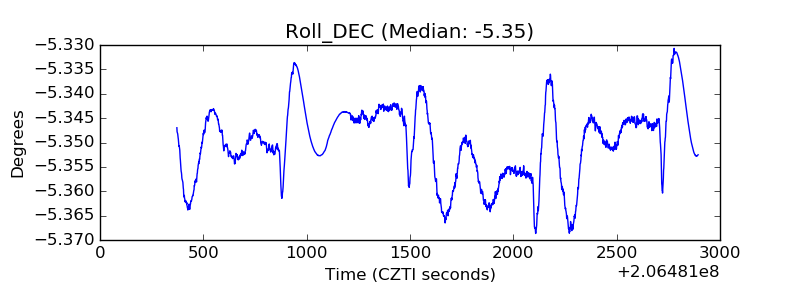 |
| _Roll_RA | 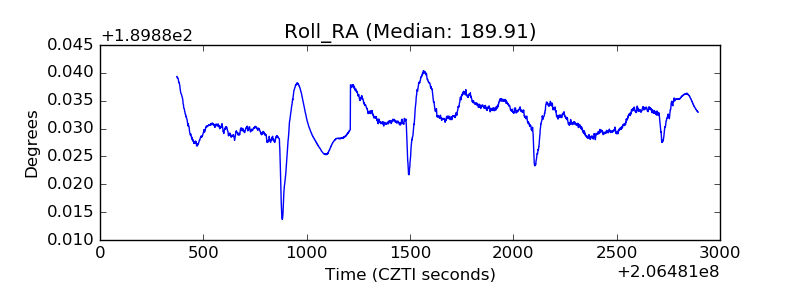 |
| Veto Counter | 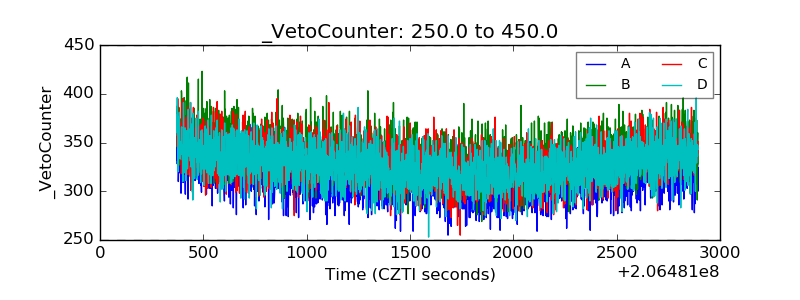 |