| Param | Original file | Final file |
|---|---|---|
| Filename | modeM0/AS1G05_219T01_9000000540_04350cztM0_level2.evt | modeM0/AS1G05_219T01_9000000540_04350cztM0_level2_quad_clean.evt |
| Size (bytes) | 1,822,697,280 | 150,603,840 |
| Size | 1.7 GB | 143.6 MB |
| Events in quadrant A | 7,712,555 | 952,916 |
| Events in quadrant B | 29,713,371 | 656,672 |
| Events in quadrant C | 8,204,200 | 924,863 |
| Events in quadrant D | 8,474,832 | 901,599 |
| Mode SS | |||
|---|---|---|---|
| Quadrant | BADHDUFLAG | Total packets | Discarded packets |
| A | 0 | 332 | 0 |
| B | 0 | 332 | 0 |
| C | 0 | 332 | 0 |
| D | 0 | 332 | 0 |
| Mode M9 | |||
|---|---|---|---|
| Quadrant | BADHDUFLAG | Total packets | Discarded packets |
| A | 0 | 17 | 0 |
| B | 0 | 17 | 0 |
| C | 0 | 17 | 0 |
| D | 0 | 17 | 0 |
| Mode M0 | |||
|---|---|---|---|
| Quadrant | BADHDUFLAG | Total packets | Discarded packets |
| A | 0 | 33936 | 18 |
| B | 0 | 100028 | 340 |
| C | 0 | 35934 | 32 |
| D | 0 | 36931 | 25 |
| Quadrant | Total seconds | Saturated seconds | Saturation percentage |
|---|---|---|---|
| A | 16279 | 131 | 0.804718% |
| B | 16237 | 8255 | 50.840673% |
| C | 16275 | 247 | 1.517665% |
| D | 16275 | 262 | 1.609831% |
Noise dominated data is calculated using 1-second bins in cleaned event files. If a bin has >2000 counts, and if more than 50% of those come from <1% of pixels, then it is considered to be noise-dominated and hence unusable.
| Quadrant | # 1 sec bins | Bins with >0 counts | Bins with >2000 counts | High rate bins dominated by noise | Noise dominated (total time) | Noise dominated (detector-on time) | Marked lightcurve |
|---|---|---|---|---|---|---|---|
| A | 17931 | 16286 | 30 | 30 | 0.17% | 0.18% | 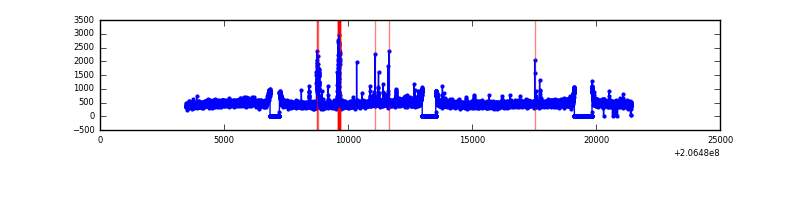 |
| B | 17930 | 16258 | 7441 | 7441 | 41.50% | 45.77% | 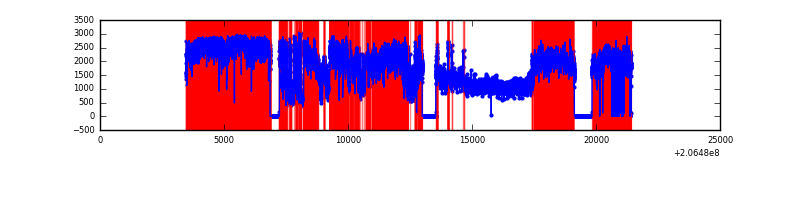 |
| C | 17931 | 16287 | 163 | 163 | 0.91% | 1.00% | 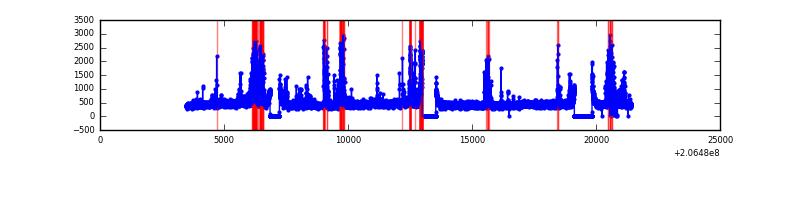 |
| D | 17930 | 16285 | 209 | 209 | 1.17% | 1.28% | 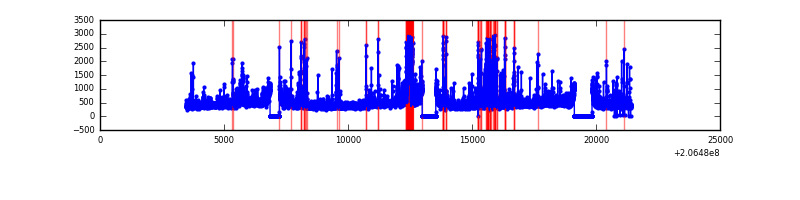 |
Top three noisy pixels from each quadrant. If the there are fewer than three noisy pixels in the level2.evt file, extra rows are filled as -1
| Pixel properties | Quadrant properties | ||||||
|---|---|---|---|---|---|---|---|
| Quadrant | DetID | PixID | Counts | Sigma | Mean | Median | Sigma |
| A | 0 | 13 | 115841 | 294.34 | 1890 | 1849 | 387.3 |
| A | 14 | 111 | 113440 | 288.14 | 1890 | 1849 | 387.3 |
| A | 13 | 251 | 88465 | 223.65 | 1890 | 1849 | 387.3 |
| B | 3 | 0 | 23455204 | 81359.35 | 1498 | 1462 | 288.3 |
| B | 14 | 167 | 231114 | 796.65 | 1498 | 1462 | 288.3 |
| B | 4 | 254 | 102228 | 349.55 | 1498 | 1462 | 288.3 |
| C | 9 | 247 | 774378 | 1827.48 | 1812 | 1824 | 422.7 |
| C | 9 | 16 | 204560 | 479.57 | 1812 | 1824 | 422.7 |
| C | 14 | 48 | 93834 | 217.65 | 1812 | 1824 | 422.7 |
| D | 2 | 37 | 533724 | 1209.13 | 1812 | 1758 | 440.0 |
| D | 2 | 136 | 450453 | 1019.86 | 1812 | 1758 | 440.0 |
| D | 13 | 53 | 173218 | 389.72 | 1812 | 1758 | 440.0 |
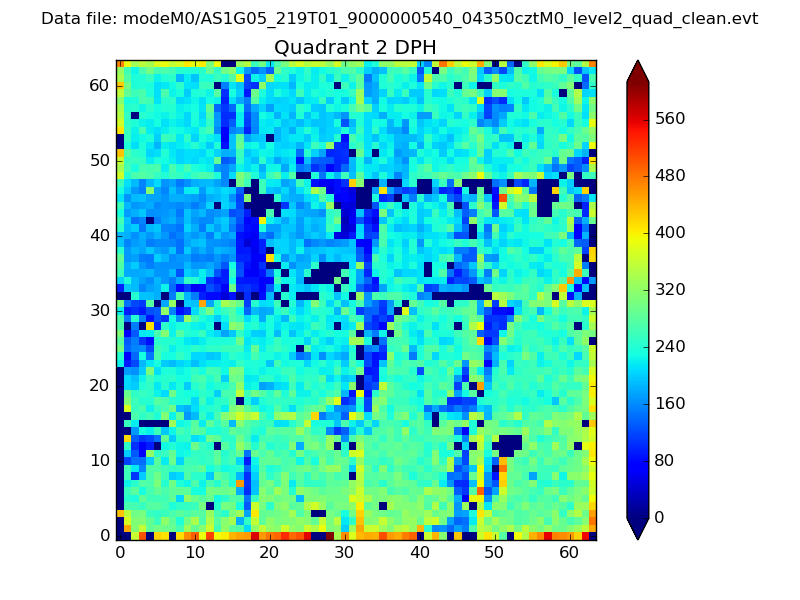
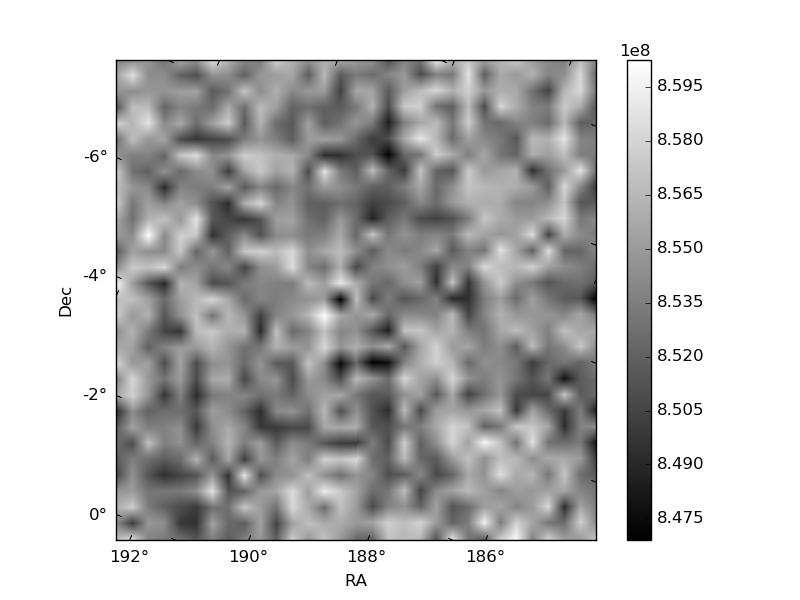
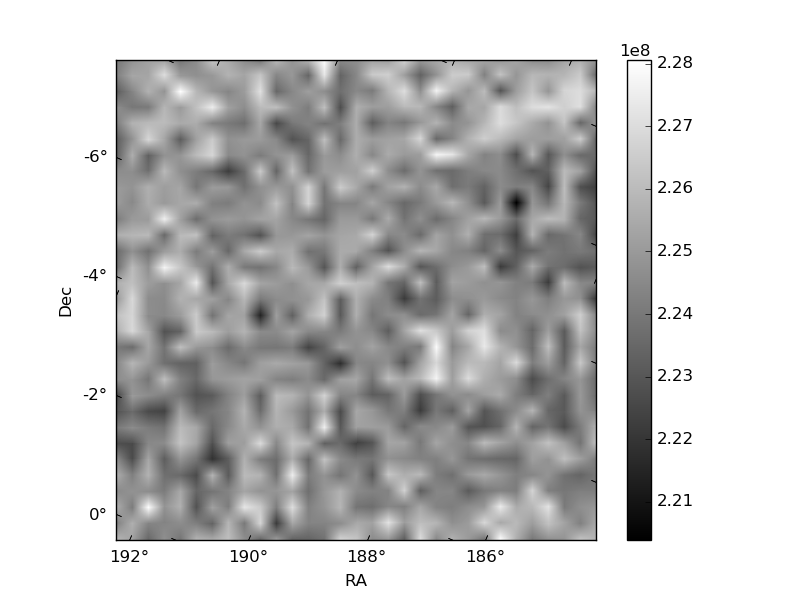
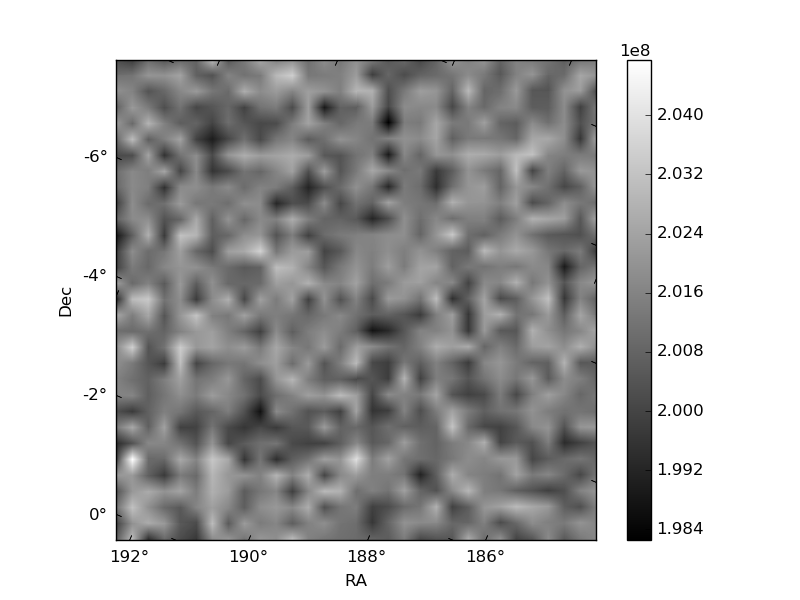
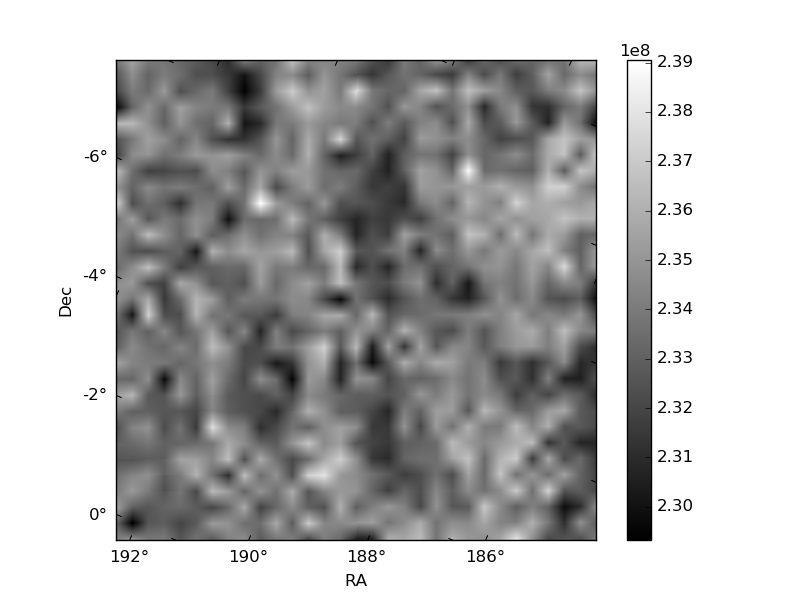
Histogram calculated using DETX and DETY for each event in the final _common_clean file
| Quadrant A | 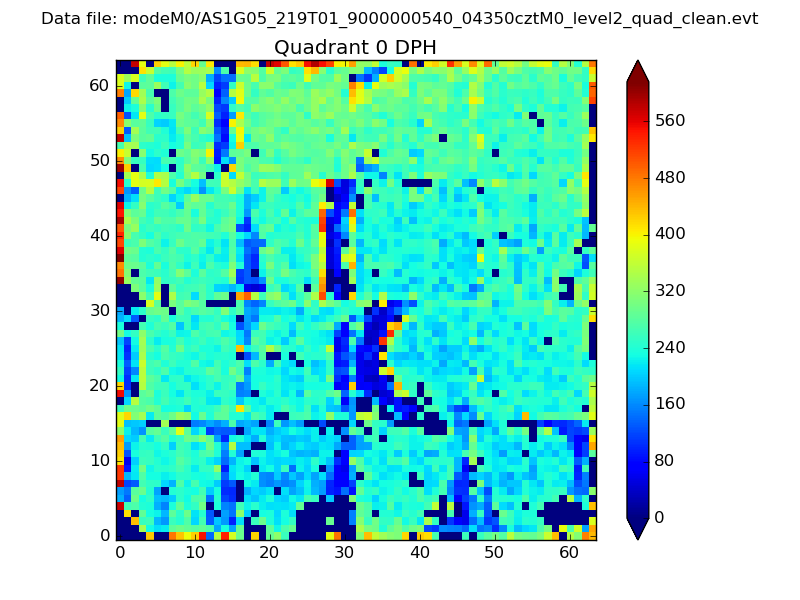 |
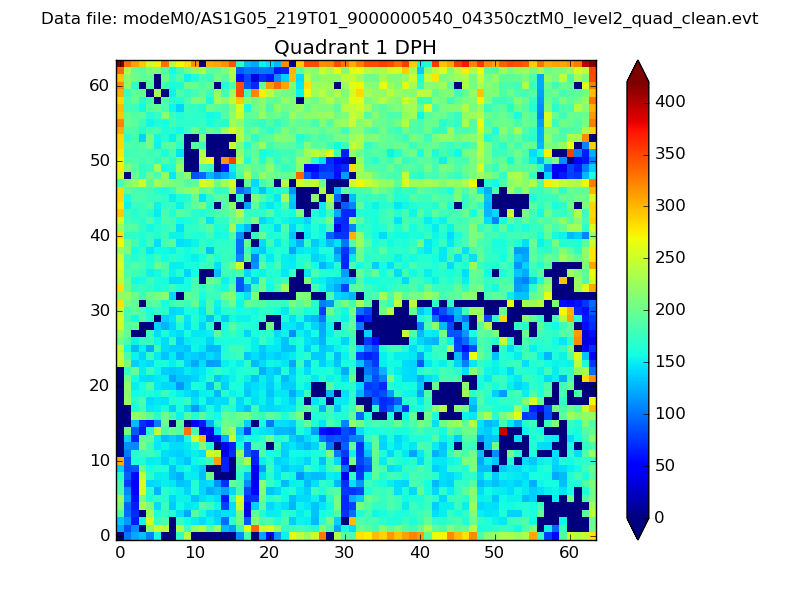 |
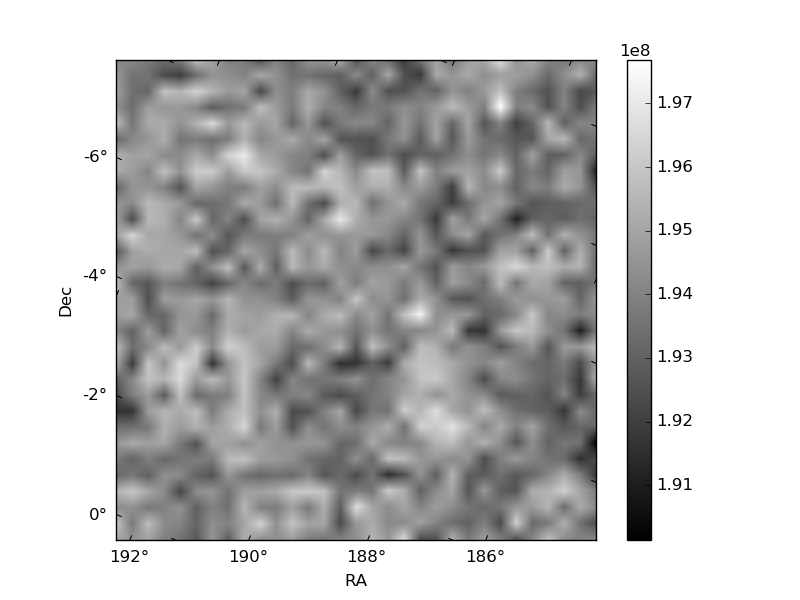
Quadrant B |
|---|---|---|---|
| Quadrant D | 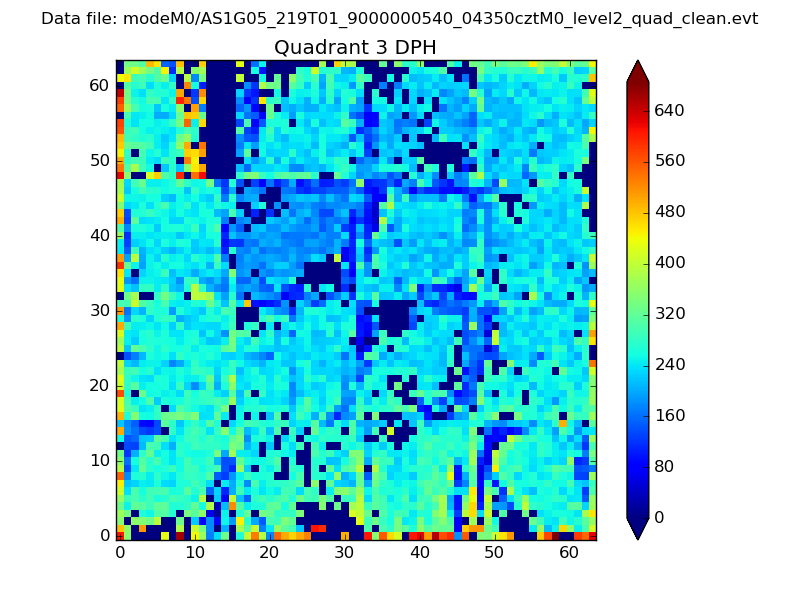 |
 |
Quadrant C |
| Plot type | Count rate plots | Images |
|---|---|---|
| Comparison with Poisson distribution Blue bars denote a histogram of data divided into 1 sec bins. Red curve is a Poisson curve with rate = median count rate of data. |
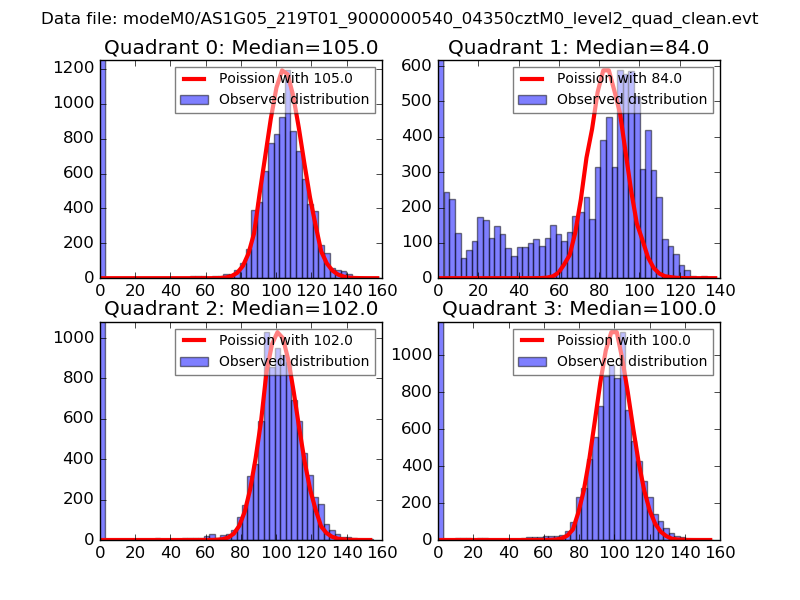 |
 |
| Quadrant-wise count rates Data is divided into 100 sec bins |
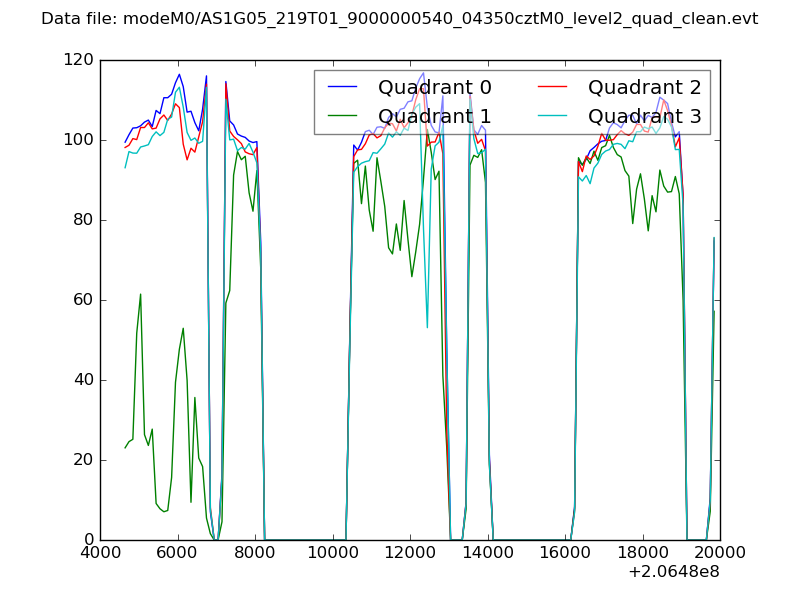 |
|
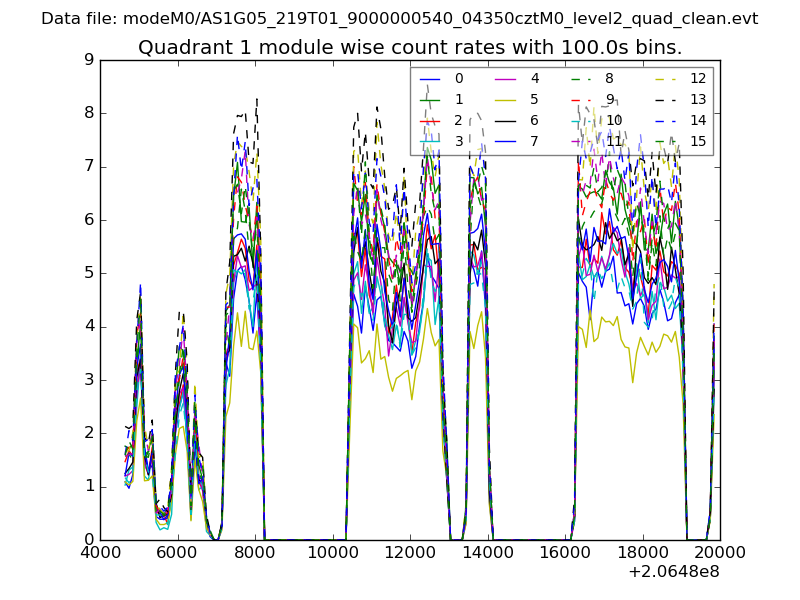
| Module-wise count rates for Quadrant A Data is divided into 100 sec bins |
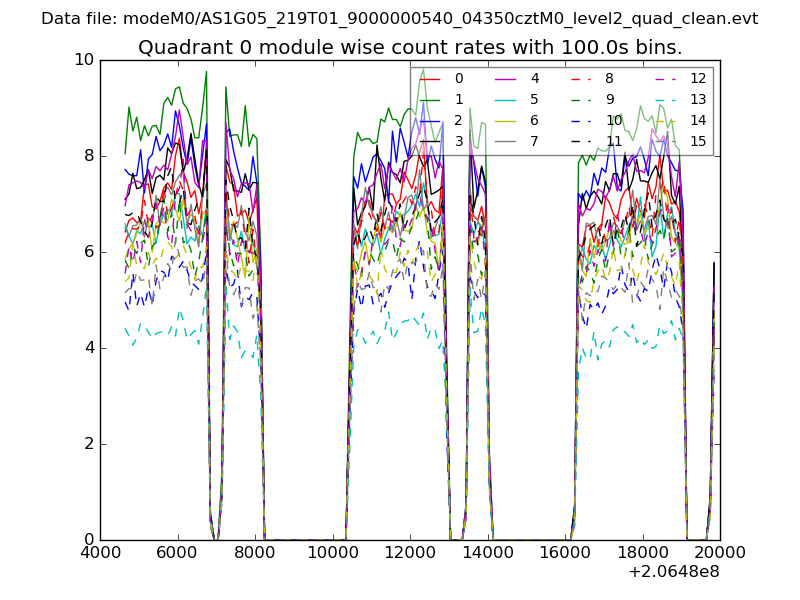 |
 |
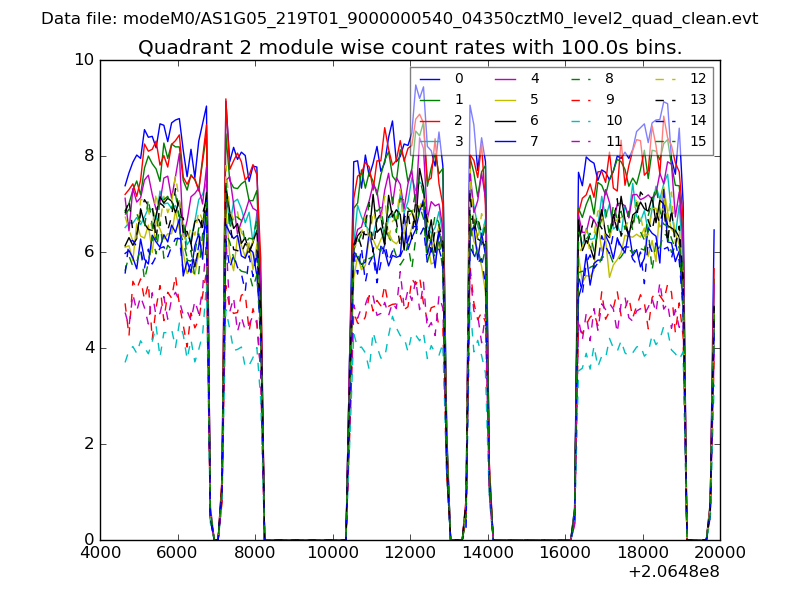
| Module-wise count rates for Quadrant B Data is divided into 100 sec bins |
 |
 |
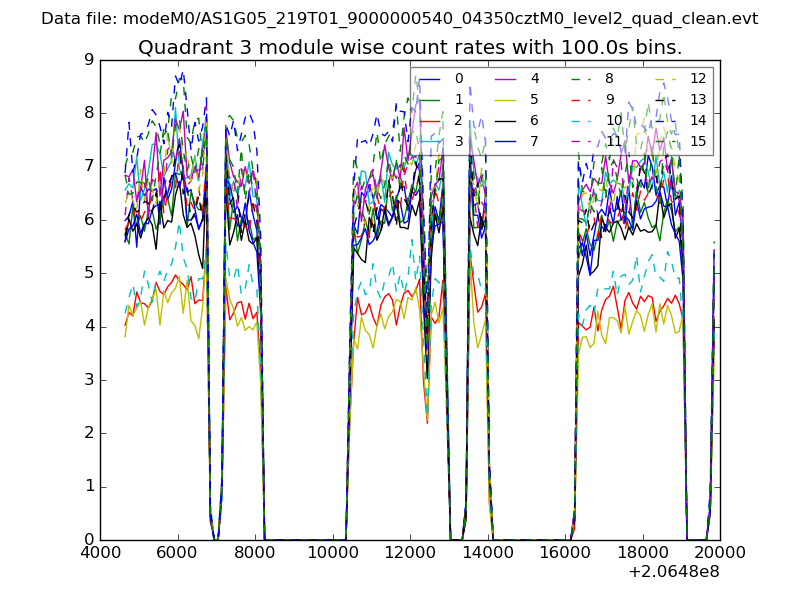
| Module-wise count rates for Quadrant C Data is divided into 100 sec bins |
 |
 |
| Module-wise count rates for Quadrant D Data is divided into 100 sec bins |
 |
 |
| Parameter | Plot |
|---|---|
| CZT HV Monitor | 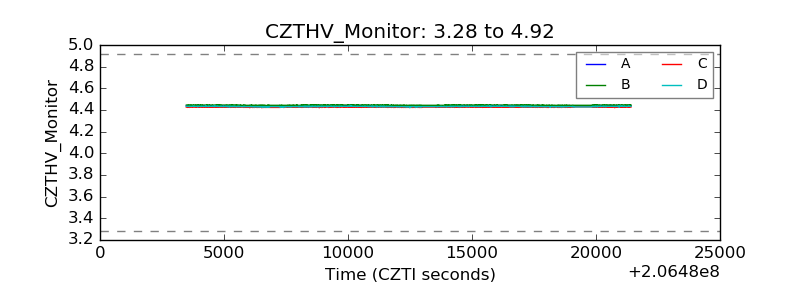 |
| D_VDD | 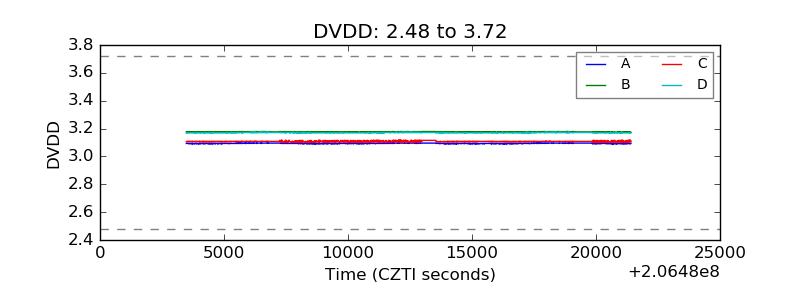 |
| Temperature 1 | 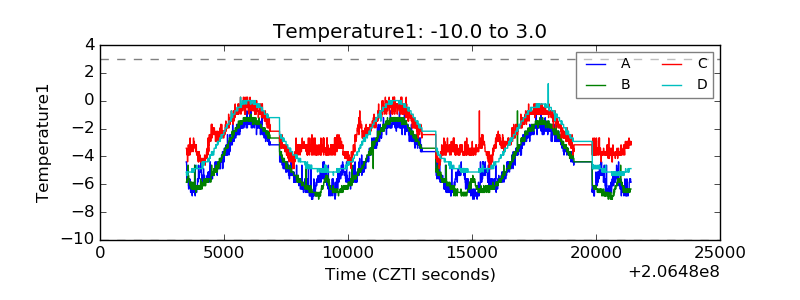 |
| Veto HV Monitor | 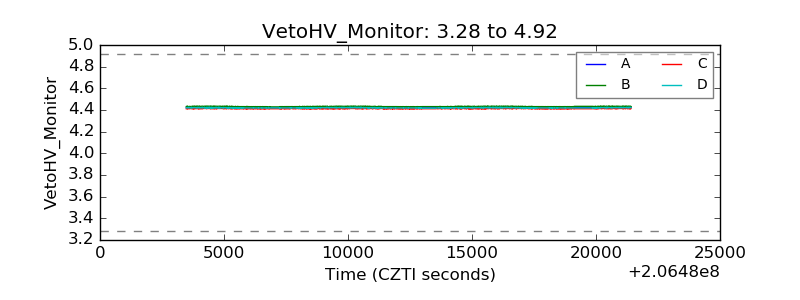 |
| Veto LLD | 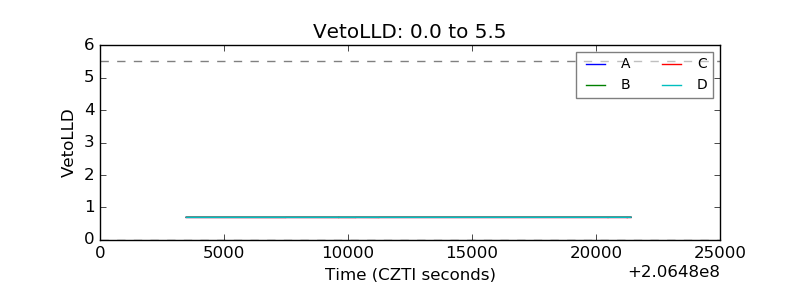 |
| Alpha Counter |  |
| _CPM_Rate | 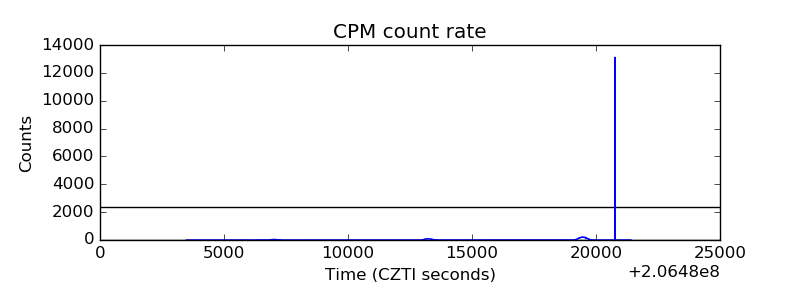 |
| CZT Counter | 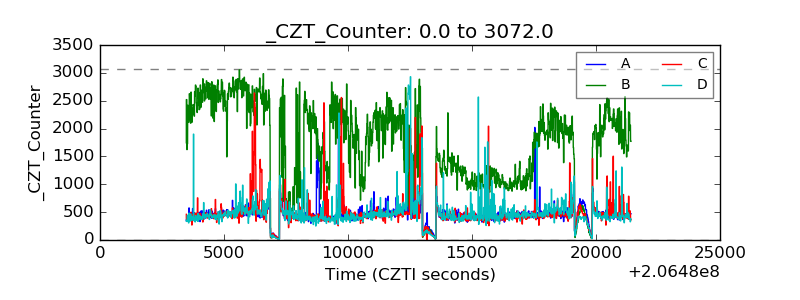 |
| +2.5 Volts monitor |  |
| +5 Volts monitor |  |
| _ROLL_ROT | 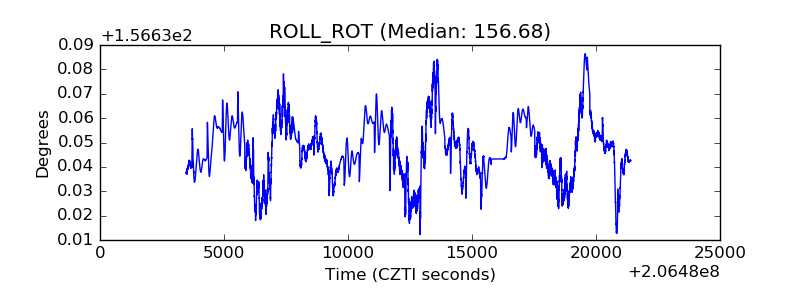 |
| _Roll_DEC | 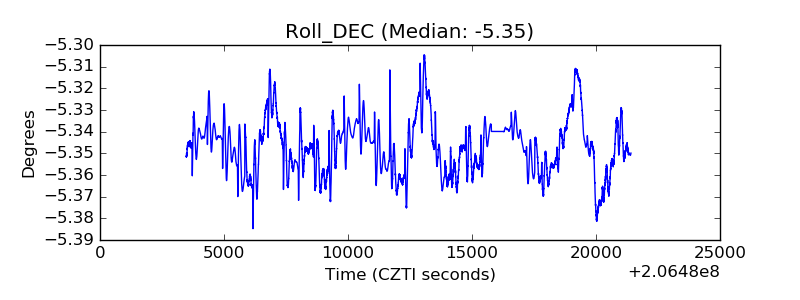 |
| _Roll_RA | 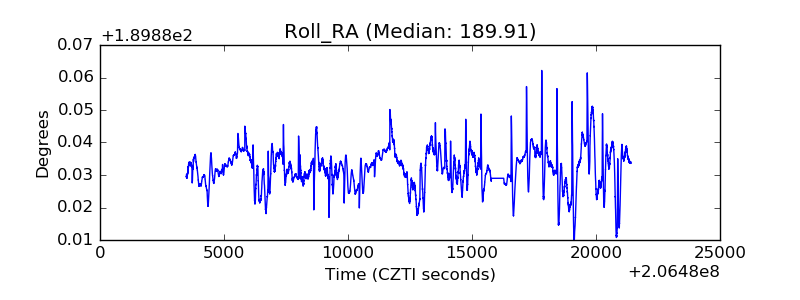 |
| Veto Counter | 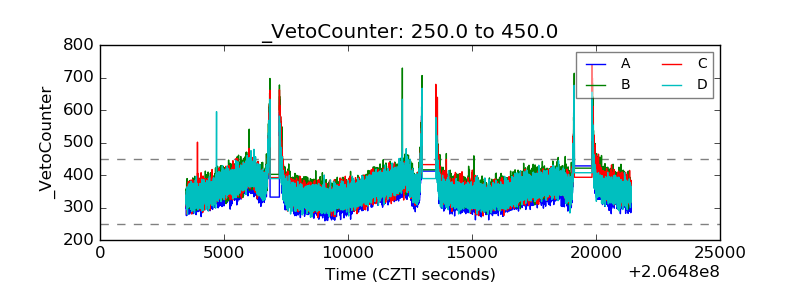 |