| Param | Original file | Final file |
|---|---|---|
| Filename | modeM0/AS1G05_219T01_9000000540_04351cztM0_level2.evt | modeM0/AS1G05_219T01_9000000540_04351cztM0_level2_quad_clean.evt |
| Size (bytes) | 766,393,920 | 54,671,040 |
| Size | 730.9 MB | 52.1 MB |
| Events in quadrant A | 3,178,155 | 326,682 |
| Events in quadrant B | 12,105,074 | 223,521 |
| Events in quadrant C | 4,266,428 | 317,515 |
| Events in quadrant D | 3,201,013 | 312,671 |
| Mode SS | |||
|---|---|---|---|
| Quadrant | BADHDUFLAG | Total packets | Discarded packets |
| A | 0 | 138 | 0 |
| B | 0 | 138 | 0 |
| C | 0 | 138 | 0 |
| D | 0 | 138 | 0 |
| Mode M9 | |||
|---|---|---|---|
| Quadrant | BADHDUFLAG | Total packets | Discarded packets |
| A | 0 | 12 | 0 |
| B | 0 | 12 | 0 |
| C | 0 | 12 | 0 |
| D | 0 | 13 | 0 |
| Mode M0 | |||
|---|---|---|---|
| Quadrant | BADHDUFLAG | Total packets | Discarded packets |
| A | 0 | 13999 | 3 |
| B | 0 | 40678 | 9 |
| C | 0 | 17456 | 2 |
| D | 0 | 14421 | 2 |
| Quadrant | Total seconds | Saturated seconds | Saturation percentage |
|---|---|---|---|
| A | 6795 | 56 | 0.824135% |
| B | 6794 | 3327 | 48.969679% |
| C | 6795 | 344 | 5.062546% |
| D | 6795 | 46 | 0.676968% |
Noise dominated data is calculated using 1-second bins in cleaned event files. If a bin has >2000 counts, and if more than 50% of those come from <1% of pixels, then it is considered to be noise-dominated and hence unusable.
| Quadrant | # 1 sec bins | Bins with >0 counts | Bins with >2000 counts | High rate bins dominated by noise | Noise dominated (total time) | Noise dominated (detector-on time) | Marked lightcurve |
|---|---|---|---|---|---|---|---|
| A | 7680 | 6795 | 7 | 7 | 0.09% | 0.10% | 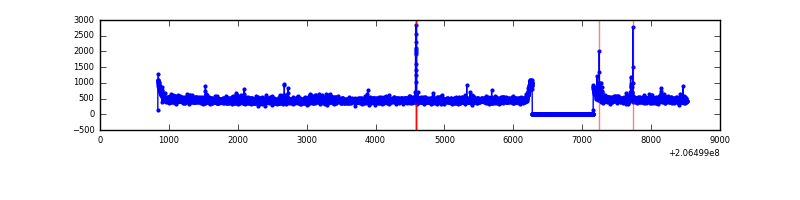 |
| B | 7680 | 6794 | 2792 | 2792 | 36.35% | 41.10% | 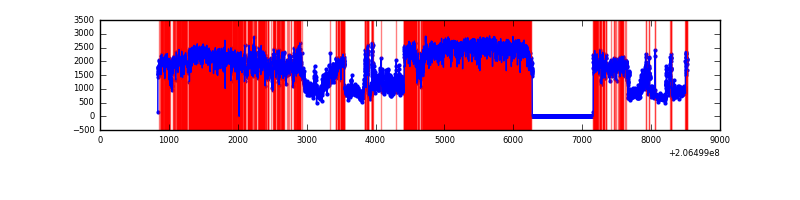 |
| C | 7679 | 6794 | 244 | 244 | 3.18% | 3.59% | 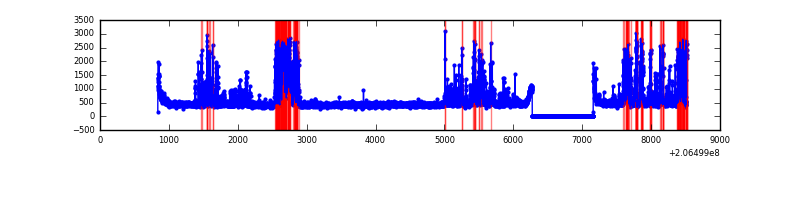 |
| D | 7680 | 6795 | 9 | 9 | 0.12% | 0.13% | 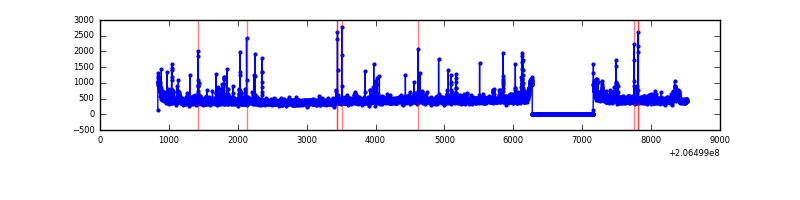 |
Top three noisy pixels from each quadrant. If the there are fewer than three noisy pixels in the level2.evt file, extra rows are filled as -1
| Pixel properties | Quadrant properties | ||||||
|---|---|---|---|---|---|---|---|
| Quadrant | DetID | PixID | Counts | Sigma | Mean | Median | Sigma |
| A | 15 | 234 | 45141 | 272.94 | 790 | 773 | 162.6 |
| A | 13 | 251 | 42586 | 257.22 | 790 | 773 | 162.6 |
| A | 13 | 14 | 32438 | 194.8 | 790 | 773 | 162.6 |
| B | 3 | 0 | 9287111 | 70299.32 | 678 | 661 | 132.1 |
| B | 14 | 167 | 76244 | 572.17 | 678 | 661 | 132.1 |
| B | 4 | 170 | 42683 | 318.11 | 678 | 661 | 132.1 |
| C | 9 | 247 | 1126814 | 6369.81 | 749 | 754 | 176.8 |
| C | 9 | 16 | 164208 | 924.61 | 749 | 754 | 176.8 |
| C | 9 | 54 | 16590 | 89.58 | 749 | 754 | 176.8 |
| D | 2 | 136 | 139217 | 739.2 | 759 | 737 | 187.3 |
| D | 2 | 63 | 37825 | 197.97 | 759 | 737 | 187.3 |
| D | 13 | 53 | 30085 | 156.66 | 759 | 737 | 187.3 |
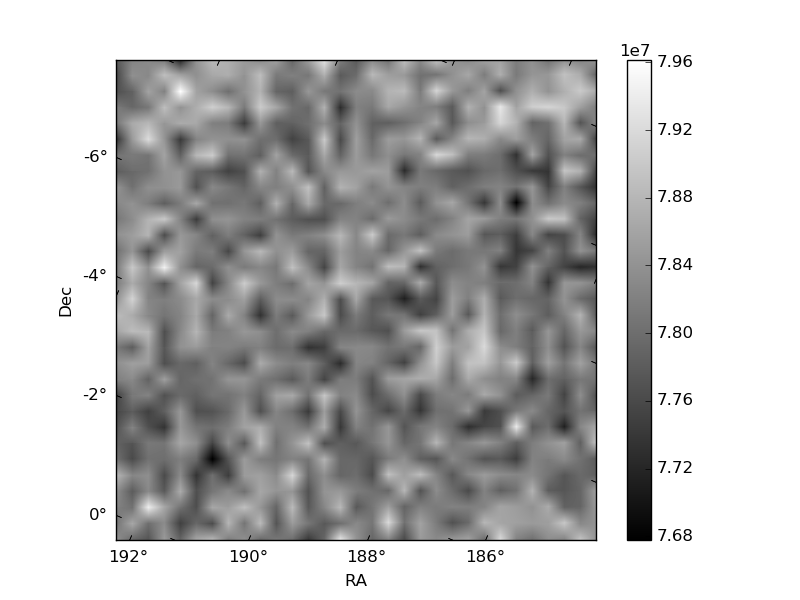
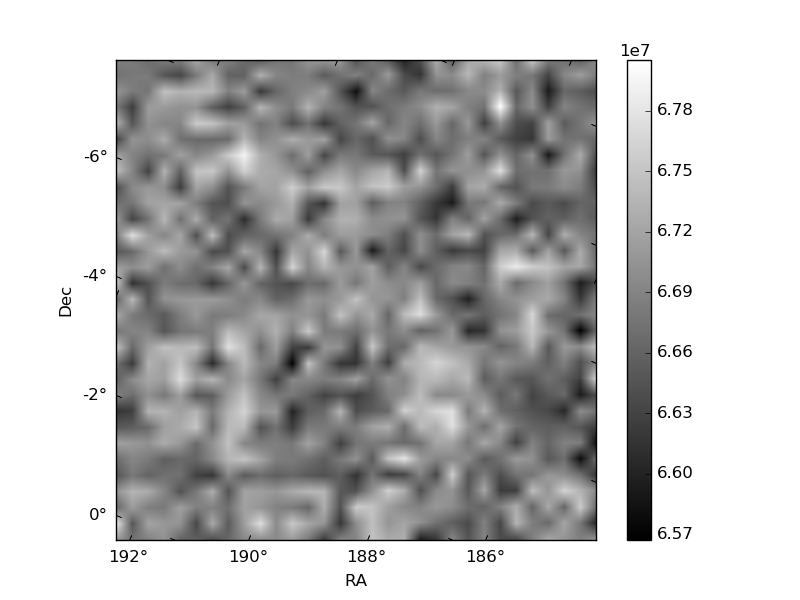
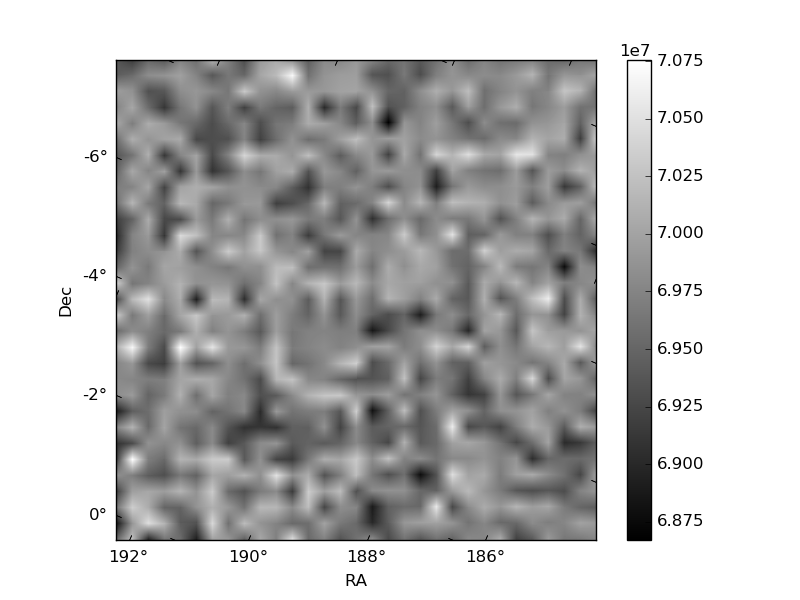
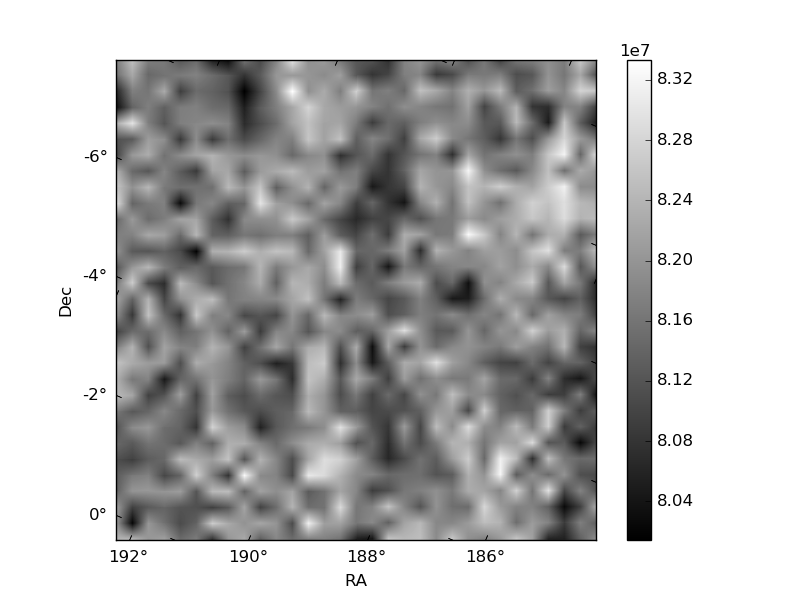
Histogram calculated using DETX and DETY for each event in the final _common_clean file
| Quadrant A | 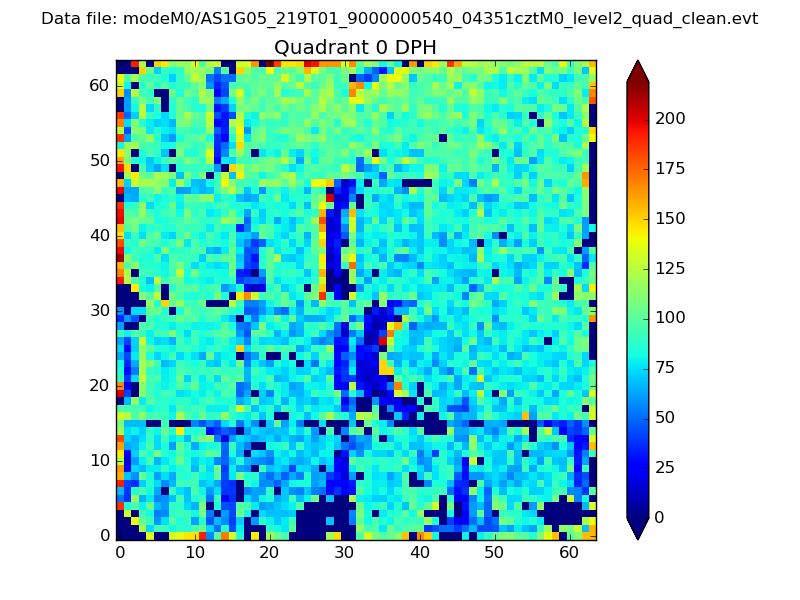 |
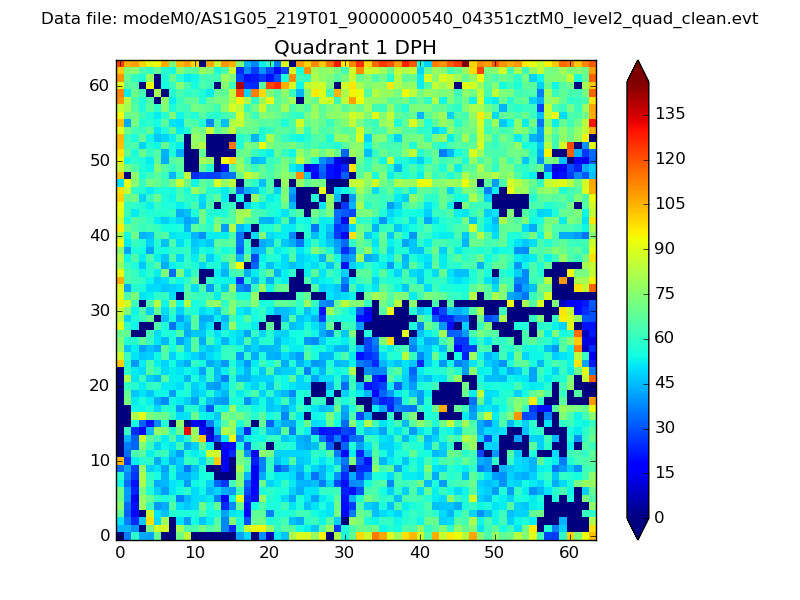 |
Quadrant B |
|---|---|---|---|
| Quadrant D | 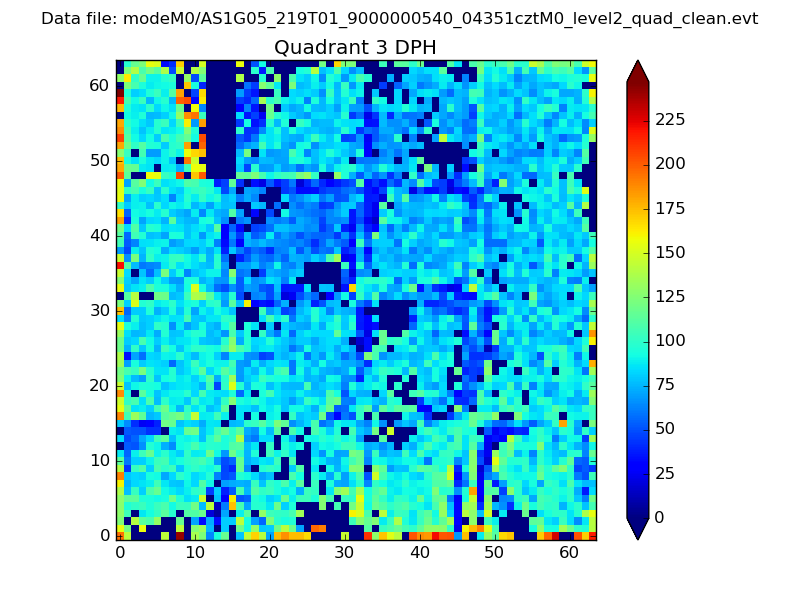 |
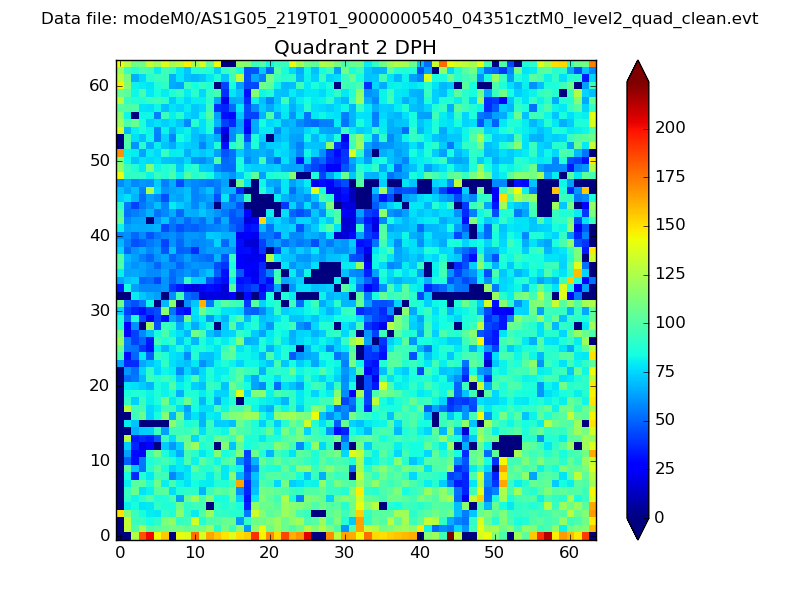 |
Quadrant C |
| Plot type | Count rate plots | Images |
|---|---|---|
| Comparison with Poisson distribution Blue bars denote a histogram of data divided into 1 sec bins. Red curve is a Poisson curve with rate = median count rate of data. |
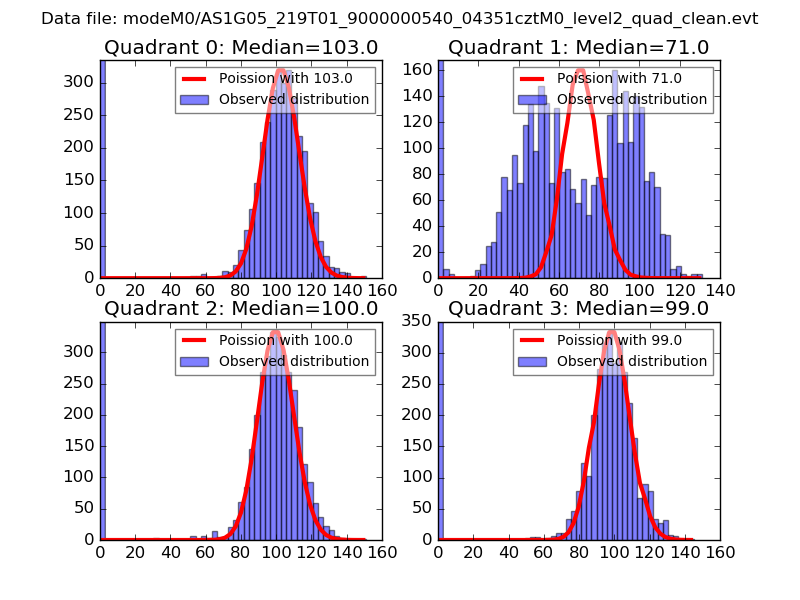 |
 |
| Quadrant-wise count rates Data is divided into 100 sec bins |
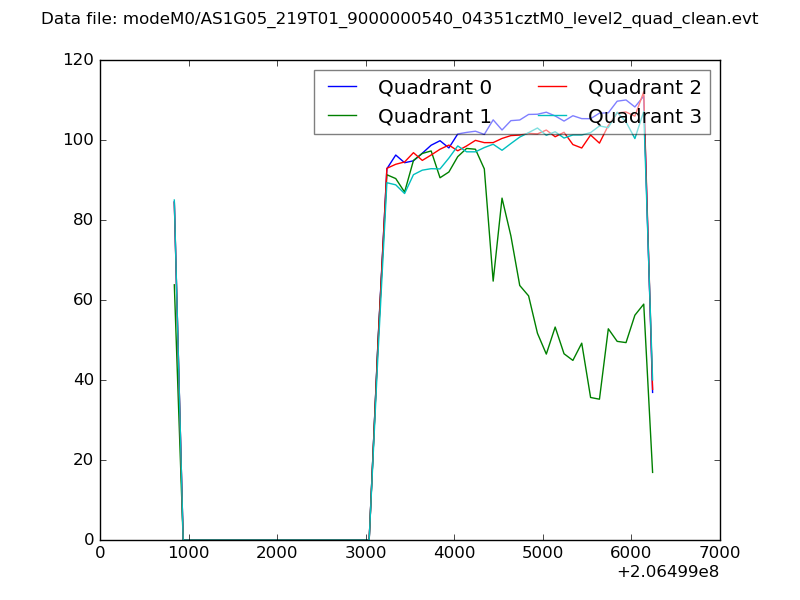 |
|
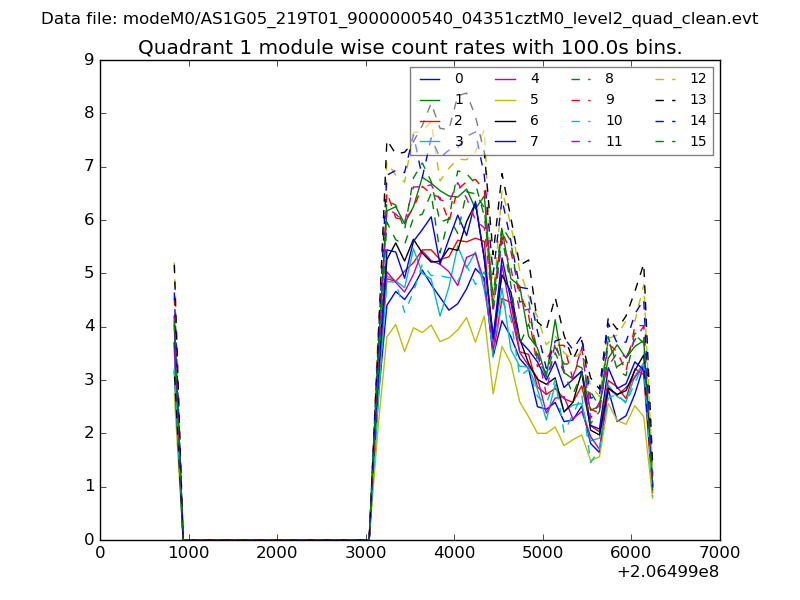
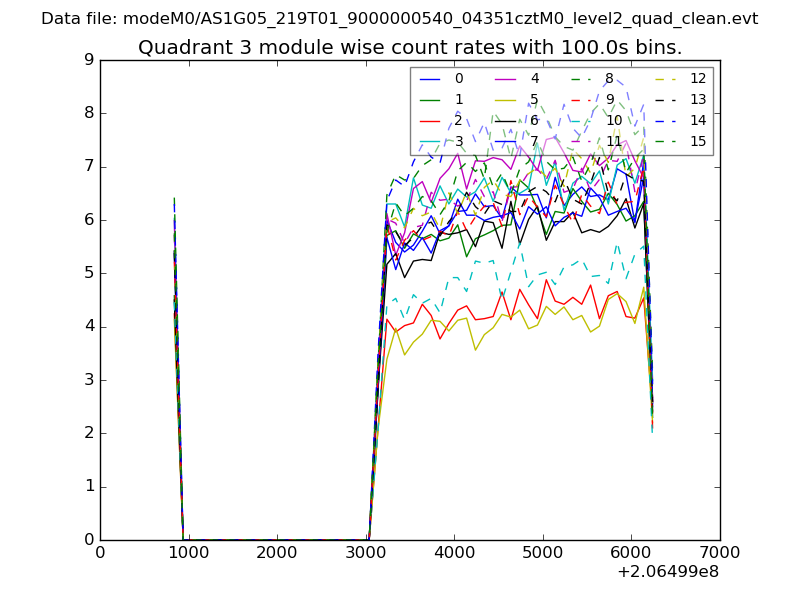
| Module-wise count rates for Quadrant A Data is divided into 100 sec bins |
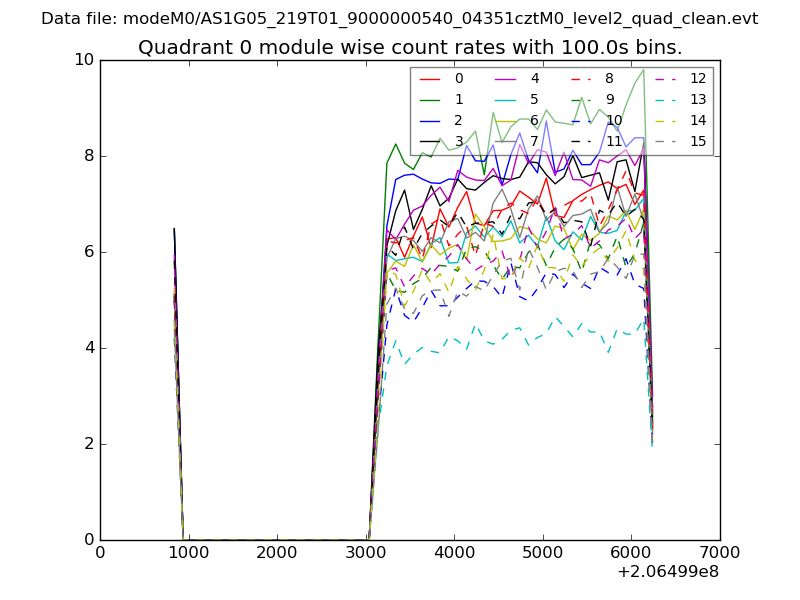 |
 |
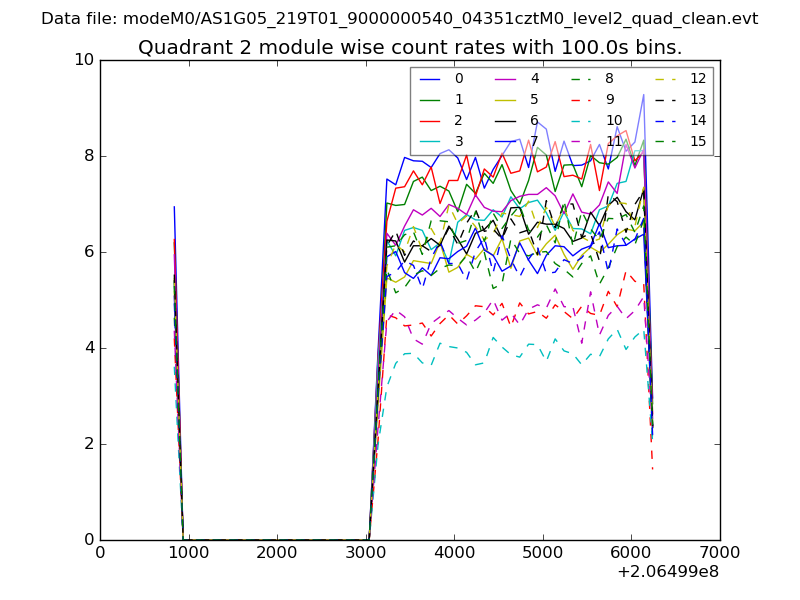
| Module-wise count rates for Quadrant B Data is divided into 100 sec bins |
 |
 |
| Module-wise count rates for Quadrant C Data is divided into 100 sec bins |
 |
 |
| Module-wise count rates for Quadrant D Data is divided into 100 sec bins |
 |
 |
| Parameter | Plot |
|---|---|
| CZT HV Monitor | 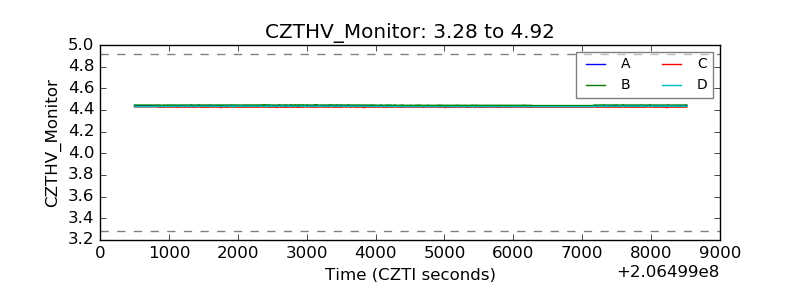 |
| D_VDD | 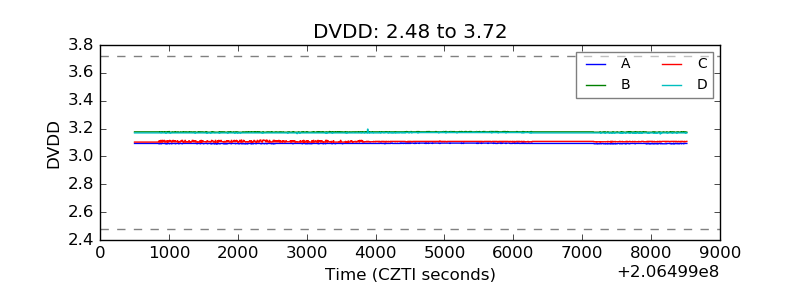 |
| Temperature 1 | 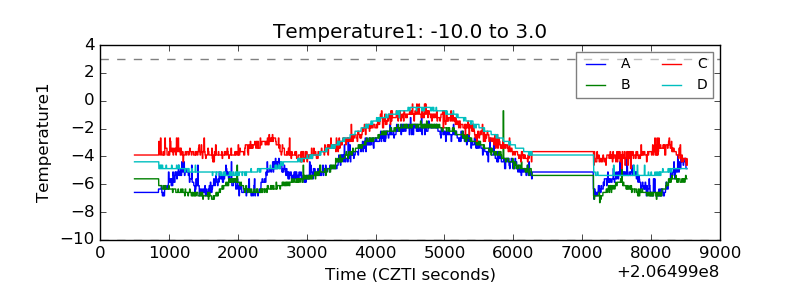 |
| Veto HV Monitor | 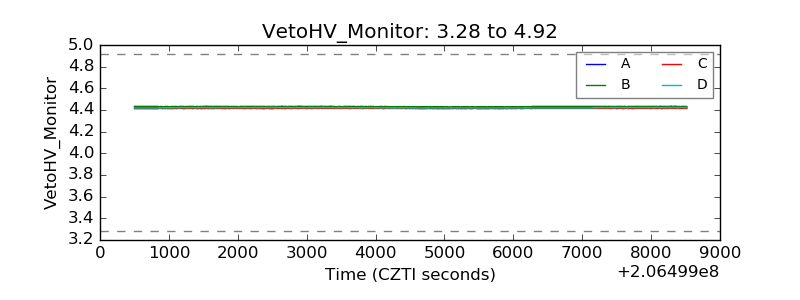 |
| Veto LLD | 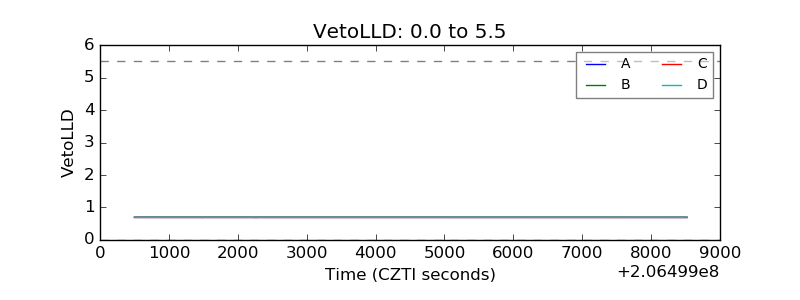 |
| Alpha Counter | 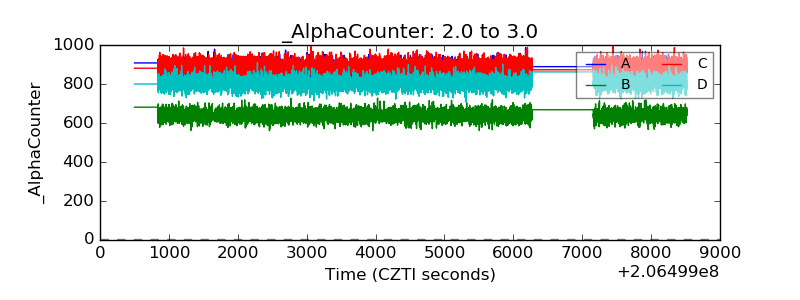 |
| _CPM_Rate | 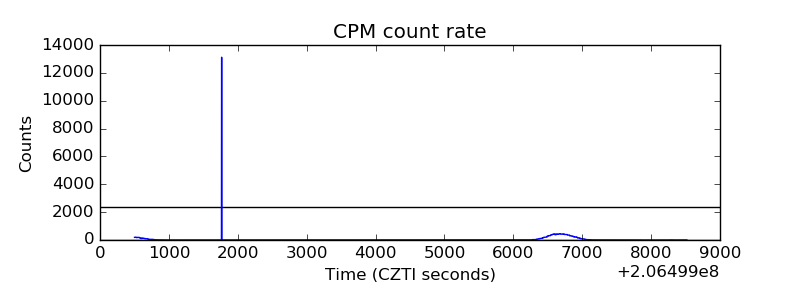 |
| CZT Counter | 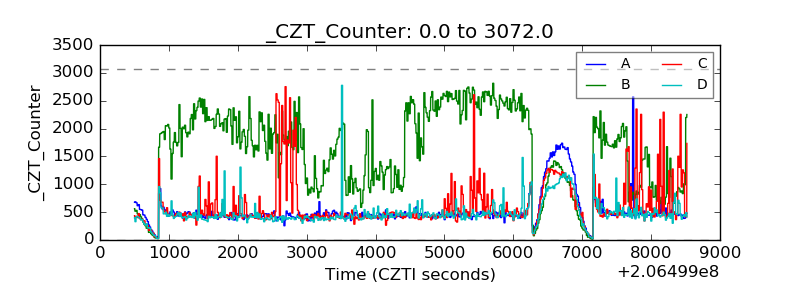 |
| +2.5 Volts monitor |  |
| +5 Volts monitor |  |
| _ROLL_ROT | 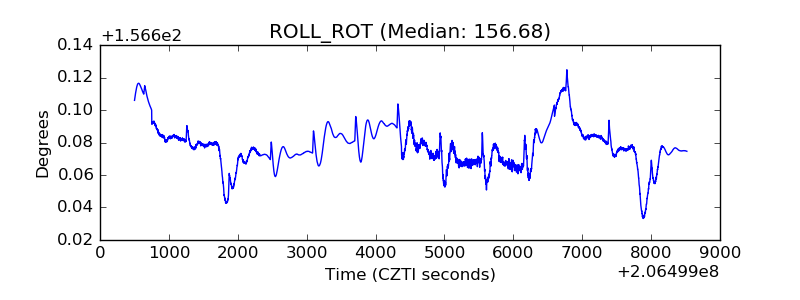 |
| _Roll_DEC | 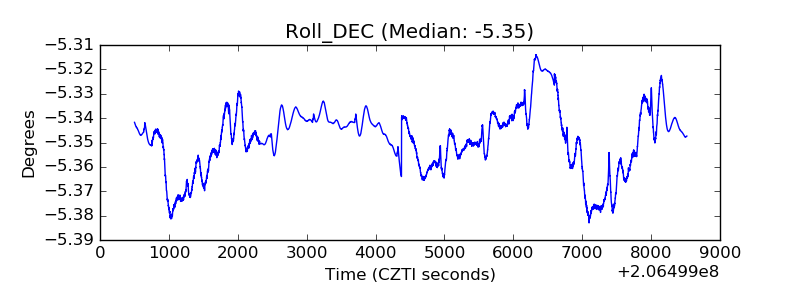 |
| _Roll_RA |  |
| Veto Counter | 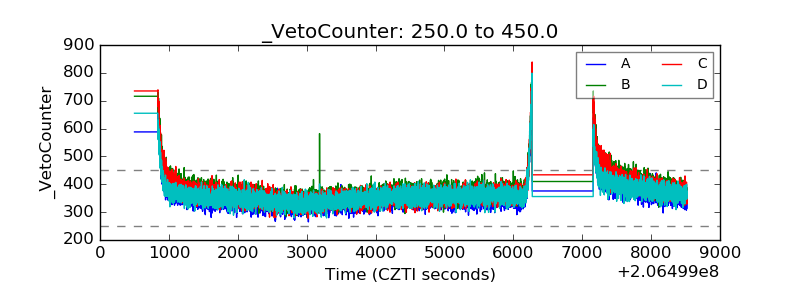 |