| Param | Original file | Final file |
|---|---|---|
| Filename | modeM0/AS1G05_219T01_9000000540_04352cztM0_level2.evt | modeM0/AS1G05_219T01_9000000540_04352cztM0_level2_quad_clean.evt |
| Size (bytes) | 713,865,600 | 60,575,040 |
| Size | 680.8 MB | 57.8 MB |
| Events in quadrant A | 3,262,607 | 358,446 |
| Events in quadrant B | 7,928,352 | 324,823 |
| Events in quadrant C | 6,332,395 | 336,424 |
| Events in quadrant D | 3,638,002 | 340,993 |
| Mode SS | |||
|---|---|---|---|
| Quadrant | BADHDUFLAG | Total packets | Discarded packets |
| A | 0 | 138 | 0 |
| B | 0 | 138 | 0 |
| C | 0 | 138 | 0 |
| D | 0 | 138 | 0 |
| Mode M9 | |||
|---|---|---|---|
| Quadrant | BADHDUFLAG | Total packets | Discarded packets |
| A | 0 | 13 | 0 |
| B | 0 | 13 | 0 |
| C | 0 | 13 | 0 |
| D | 0 | 14 | 0 |
| Mode M0 | |||
|---|---|---|---|
| Quadrant | BADHDUFLAG | Total packets | Discarded packets |
| A | 0 | 14079 | 3 |
| B | 0 | 28329 | 2 |
| C | 0 | 23466 | 2 |
| D | 0 | 15290 | 2 |
| Quadrant | Total seconds | Saturated seconds | Saturation percentage |
|---|---|---|---|
| A | 6789 | 59 | 0.869053% |
| B | 6765 | 1072 | 15.846268% |
| C | 6789 | 825 | 12.152011% |
| D | 6789 | 72 | 1.060539% |
Noise dominated data is calculated using 1-second bins in cleaned event files. If a bin has >2000 counts, and if more than 50% of those come from <1% of pixels, then it is considered to be noise-dominated and hence unusable.
| Quadrant | # 1 sec bins | Bins with >0 counts | Bins with >2000 counts | High rate bins dominated by noise | Noise dominated (total time) | Noise dominated (detector-on time) | Marked lightcurve |
|---|---|---|---|---|---|---|---|
| A | 7805 | 6789 | 2 | 2 | 0.03% | 0.03% | 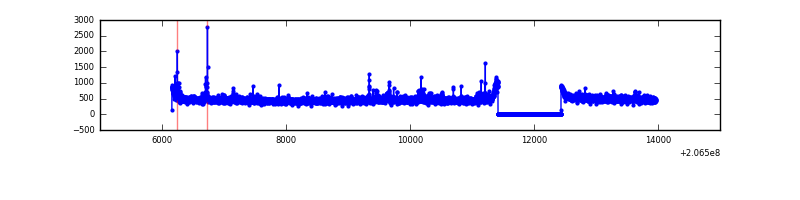 |
| B | 7805 | 6766 | 778 | 778 | 9.97% | 11.50% | 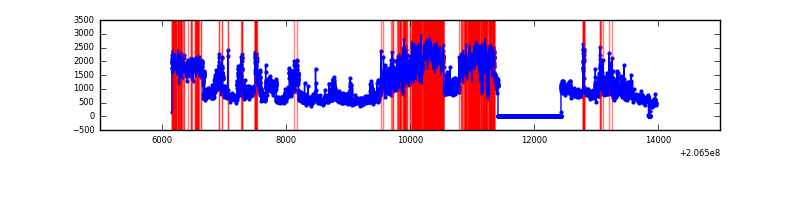 |
| C | 7805 | 6789 | 655 | 655 | 8.39% | 9.65% | 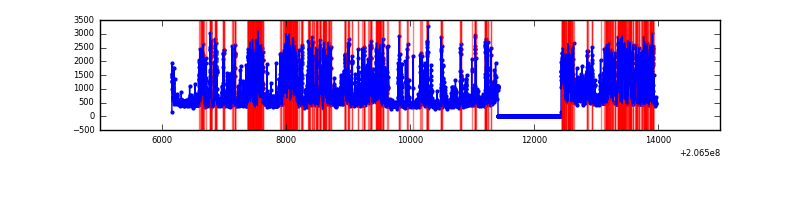 |
| D | 7805 | 6789 | 23 | 23 | 0.29% | 0.34% |  |
Top three noisy pixels from each quadrant. If the there are fewer than three noisy pixels in the level2.evt file, extra rows are filled as -1
| Pixel properties | Quadrant properties | ||||||
|---|---|---|---|---|---|---|---|
| Quadrant | DetID | PixID | Counts | Sigma | Mean | Median | Sigma |
| A | 13 | 251 | 72455 | 430.17 | 810 | 792 | 166.6 |
| A | 15 | 234 | 38521 | 226.47 | 810 | 792 | 166.6 |
| A | 13 | 14 | 21244 | 122.77 | 810 | 792 | 166.6 |
| B | 3 | 0 | 4770963 | 32079.24 | 780 | 762 | 148.7 |
| B | 14 | 167 | 62263 | 413.59 | 780 | 762 | 148.7 |
| B | 15 | 204 | 38784 | 255.7 | 780 | 762 | 148.7 |
| C | 9 | 247 | 3375446 | 19331.69 | 745 | 748 | 174.6 |
| C | 9 | 16 | 31007 | 173.33 | 745 | 748 | 174.6 |
| C | 9 | 54 | 10589 | 56.37 | 745 | 748 | 174.6 |
| D | 2 | 63 | 330617 | 1731.55 | 776 | 752 | 190.5 |
| D | 2 | 136 | 144781 | 756.05 | 776 | 752 | 190.5 |
| D | 10 | 172 | 81997 | 426.48 | 776 | 752 | 190.5 |
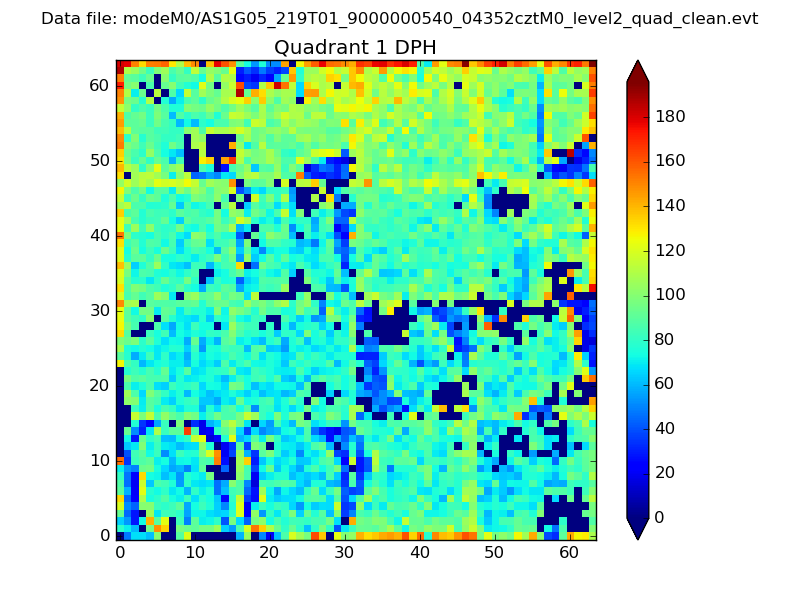
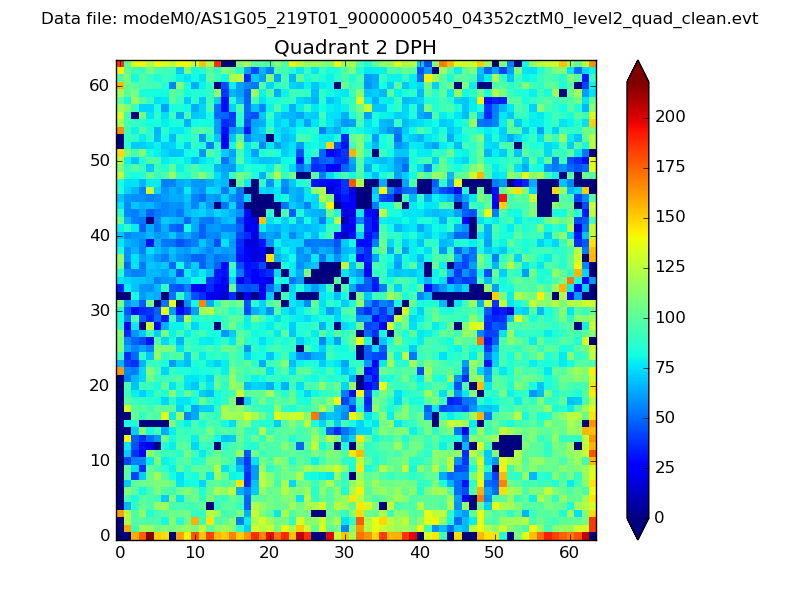
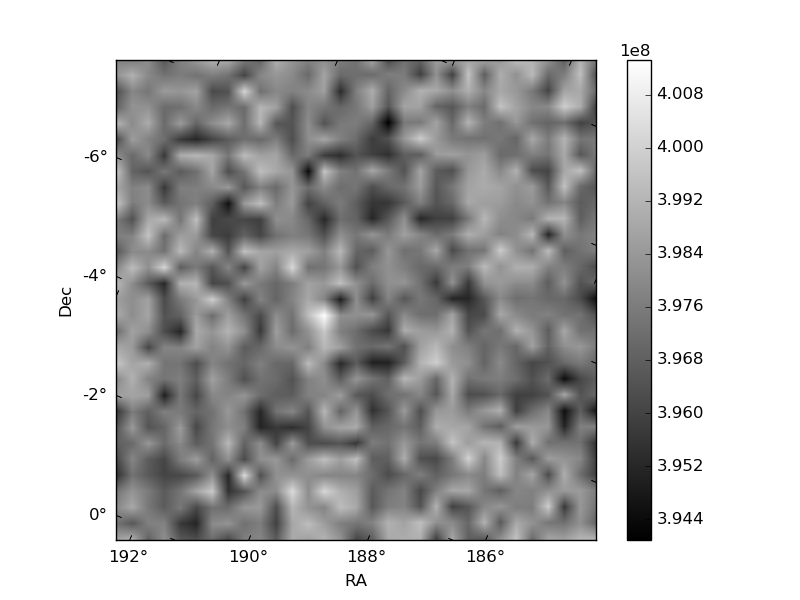
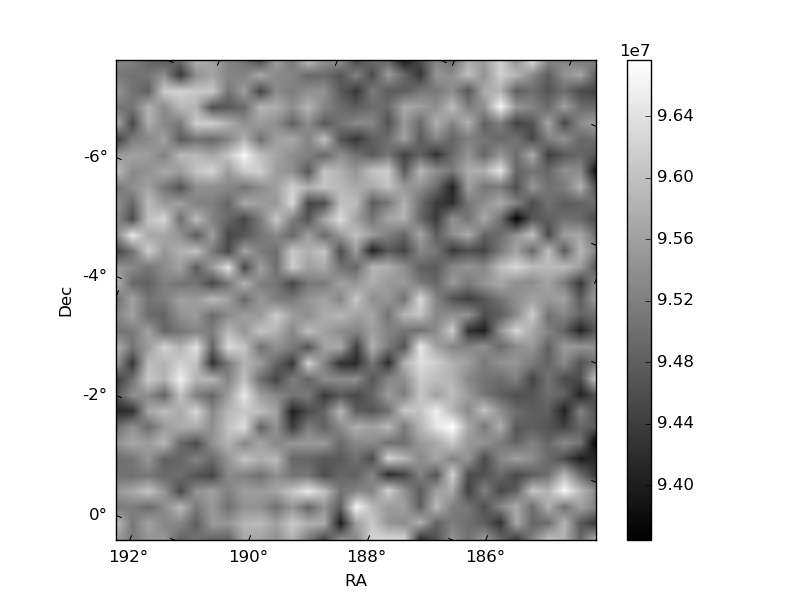
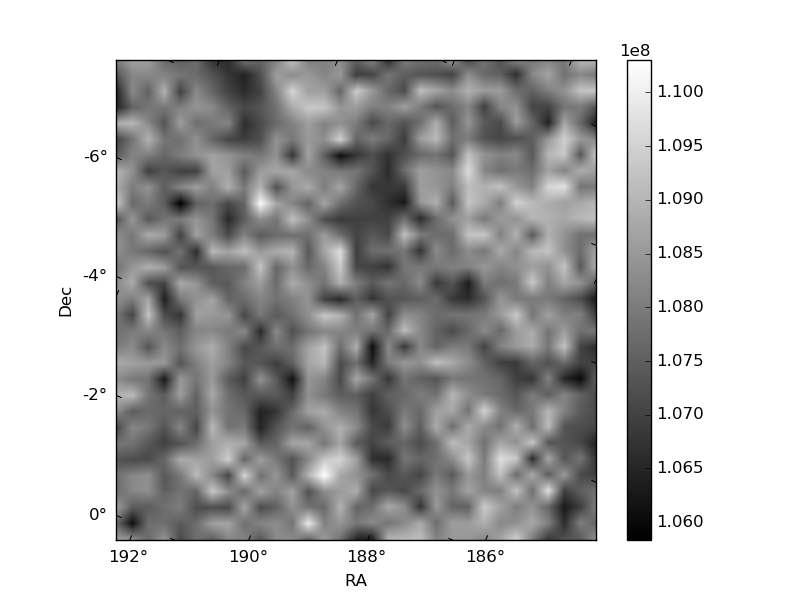
Histogram calculated using DETX and DETY for each event in the final _common_clean file
| Quadrant A | 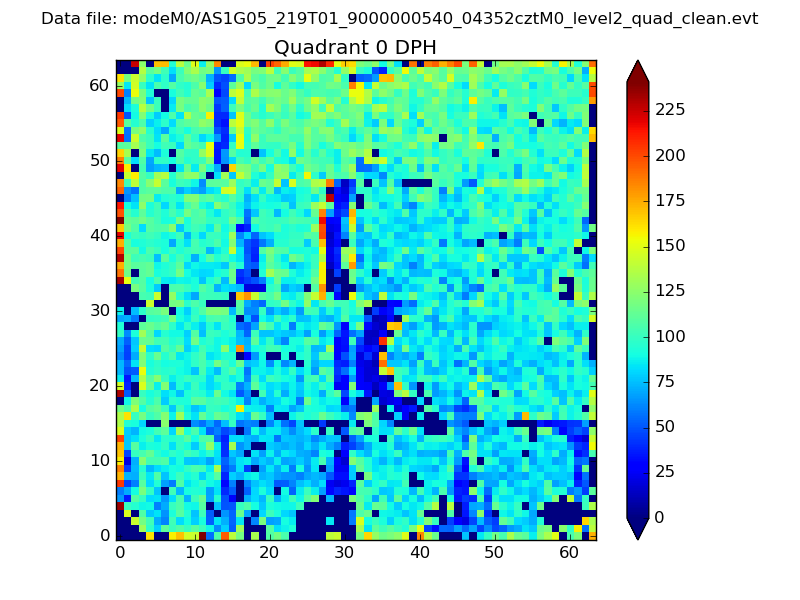 |
 |
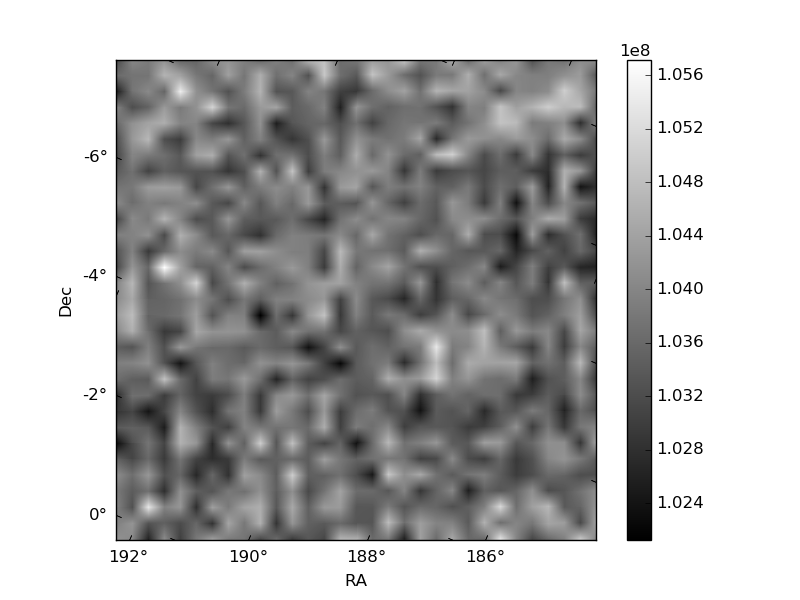
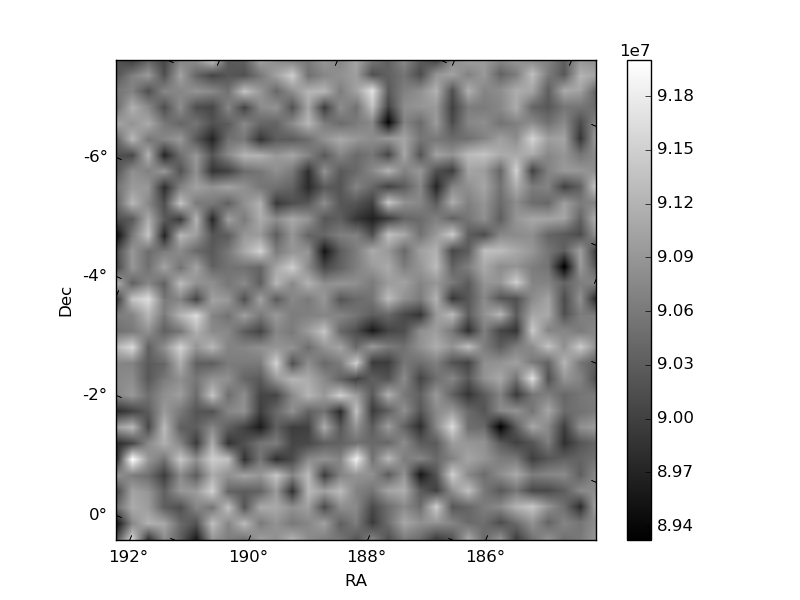
Quadrant B |
|---|---|---|---|
| Quadrant D | 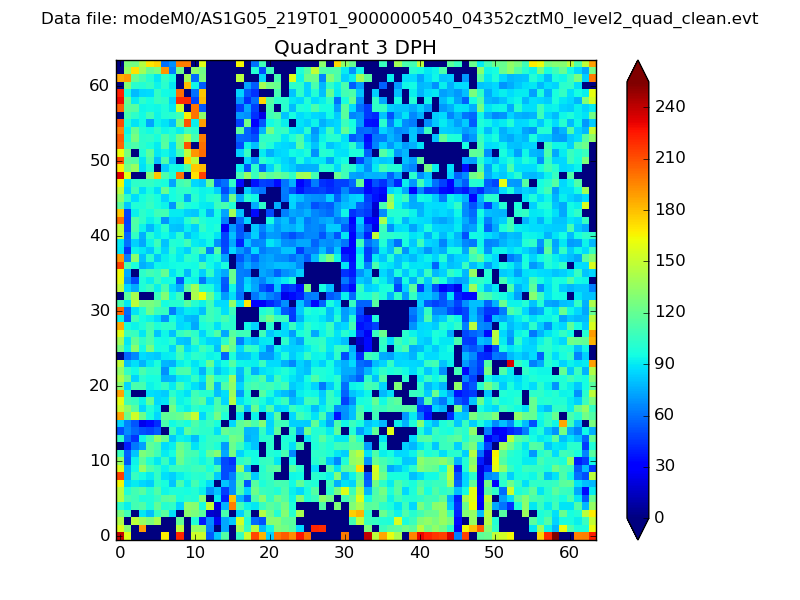 |
 |
Quadrant C |
| Plot type | Count rate plots | Images |
|---|---|---|
| Comparison with Poisson distribution Blue bars denote a histogram of data divided into 1 sec bins. Red curve is a Poisson curve with rate = median count rate of data. |
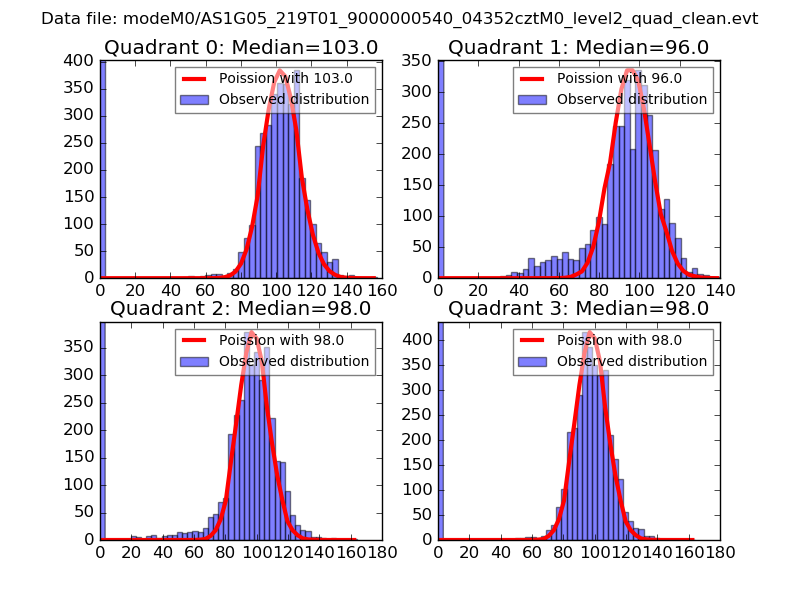 |
 |
| Quadrant-wise count rates Data is divided into 100 sec bins |
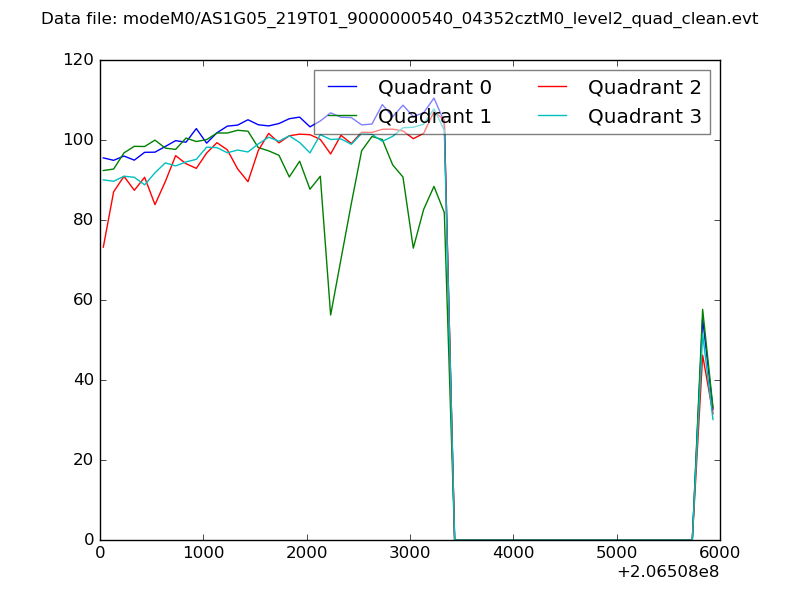 |
|
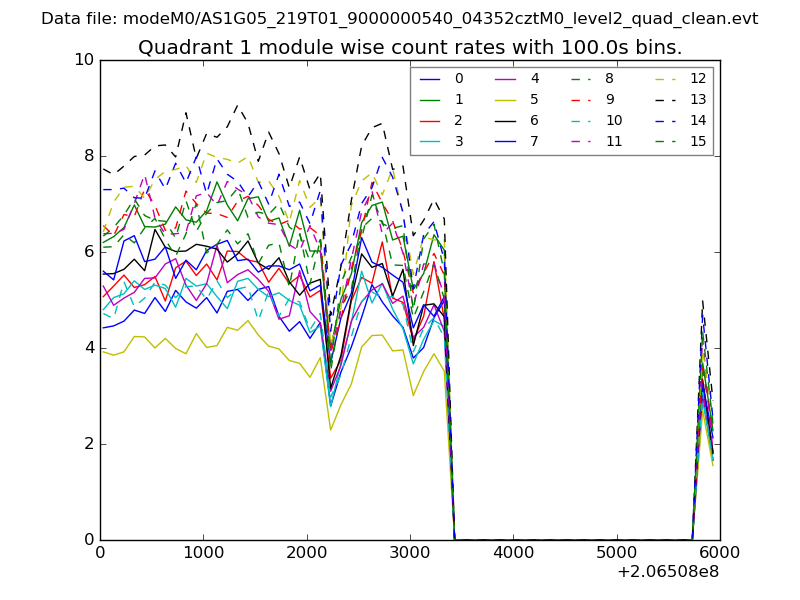
| Module-wise count rates for Quadrant A Data is divided into 100 sec bins |
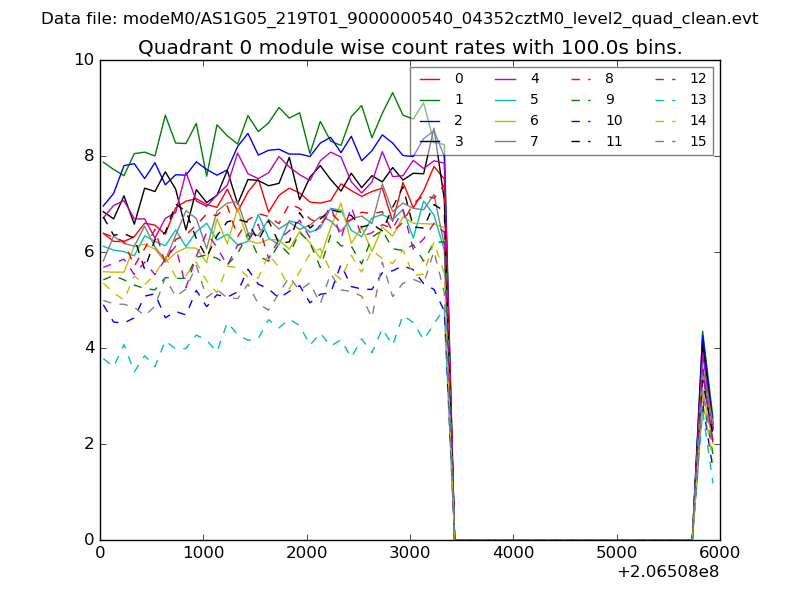 |
 |
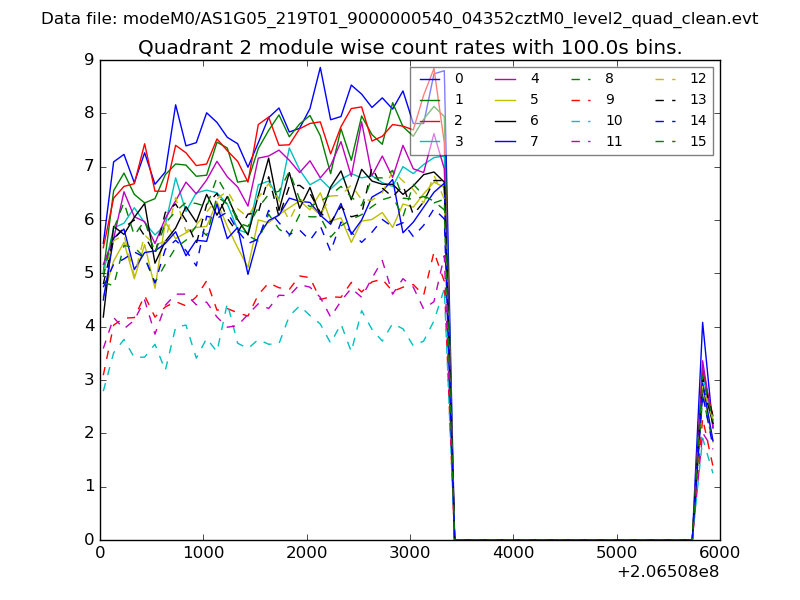
| Module-wise count rates for Quadrant B Data is divided into 100 sec bins |
 |
 |
| Module-wise count rates for Quadrant C Data is divided into 100 sec bins |
 |
 |
| Module-wise count rates for Quadrant D Data is divided into 100 sec bins |
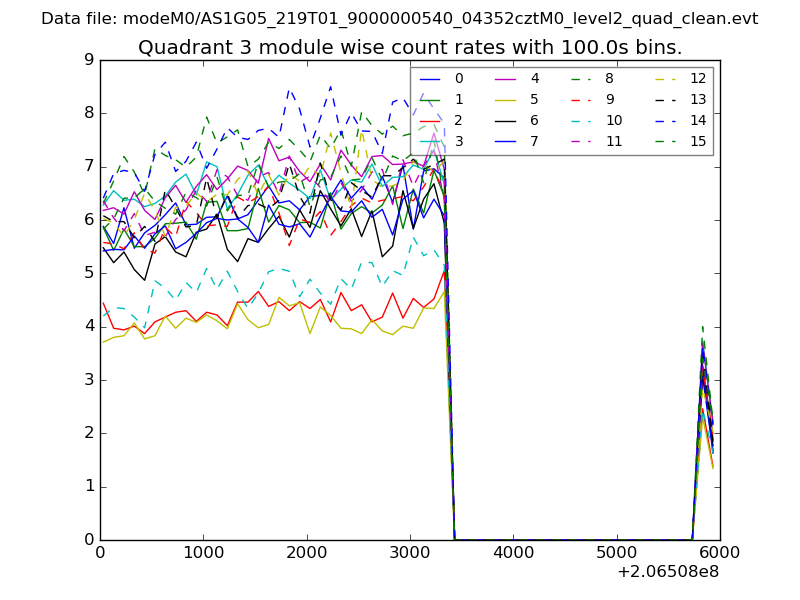 |
 |
| Parameter | Plot |
|---|---|
| CZT HV Monitor | 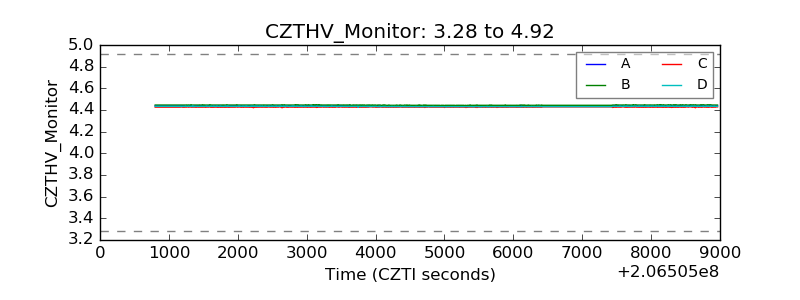 |
| D_VDD | 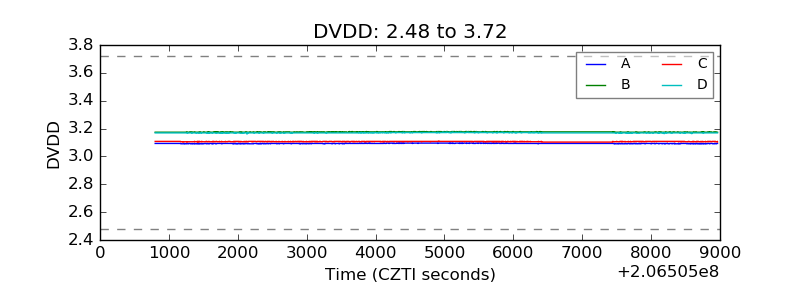 |
| Temperature 1 | 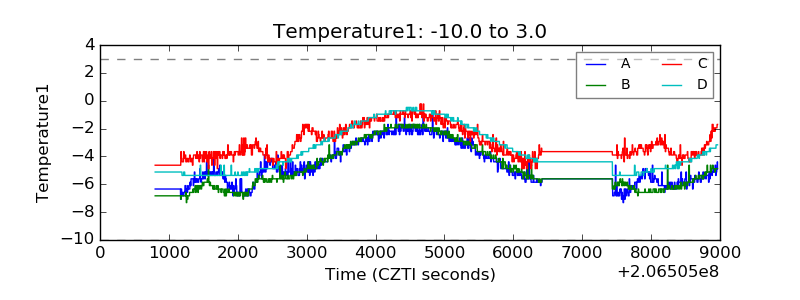 |
| Veto HV Monitor | 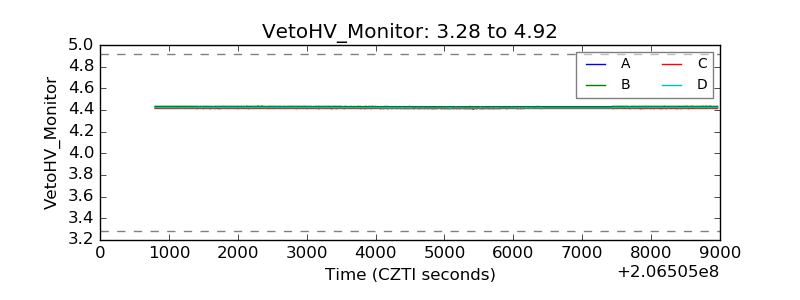 |
| Veto LLD | 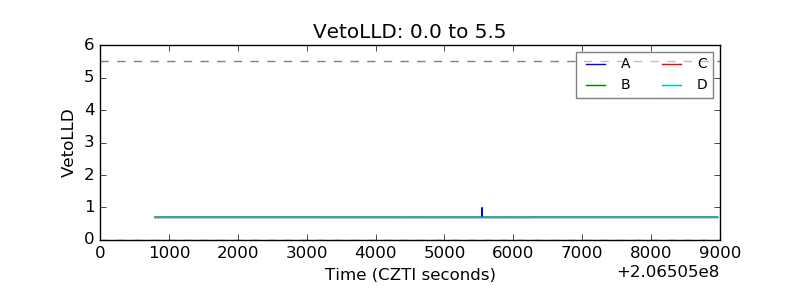 |
| Alpha Counter | 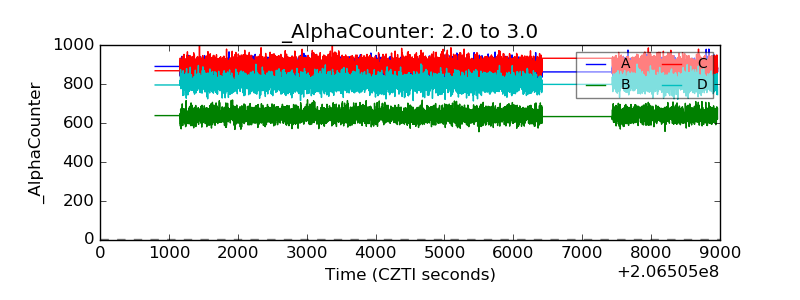 |
| _CPM_Rate | 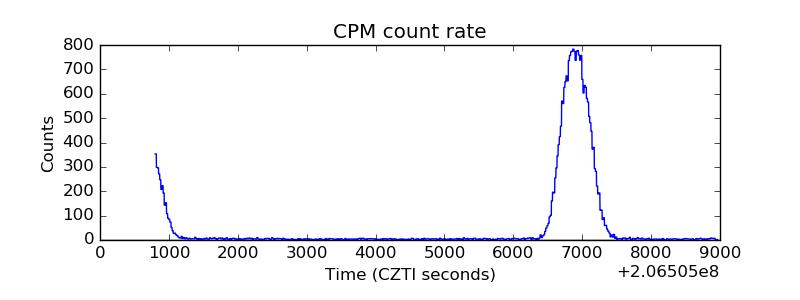 |
| CZT Counter | 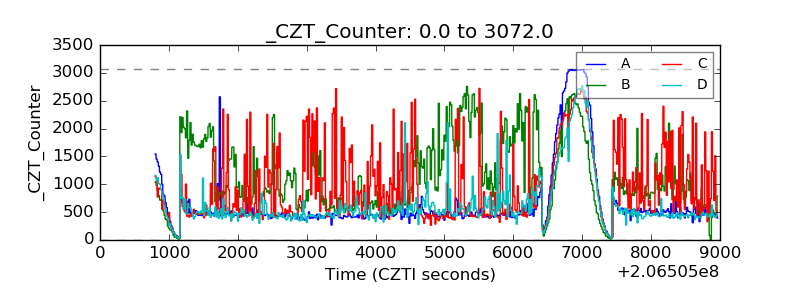 |
| +2.5 Volts monitor |  |
| +5 Volts monitor |  |
| _ROLL_ROT | 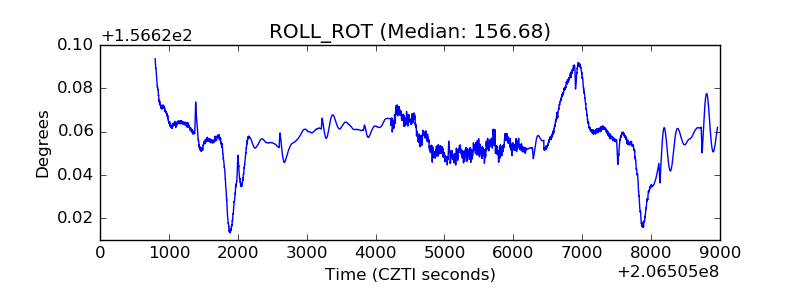 |
| _Roll_DEC | 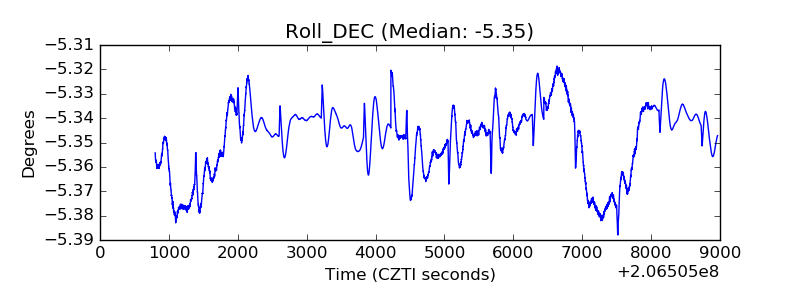 |
| _Roll_RA | 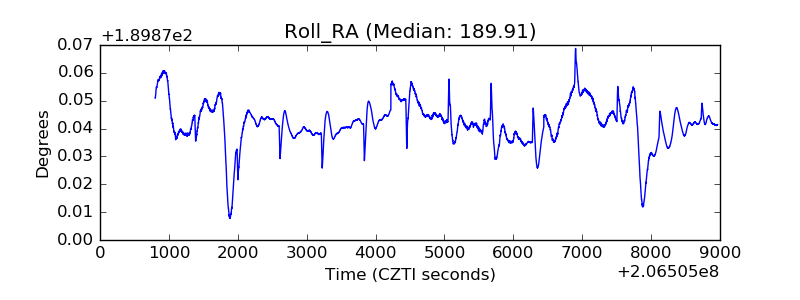 |
| Veto Counter | 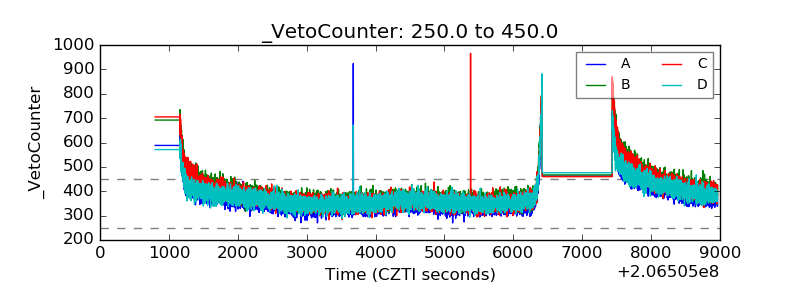 |