| Param | Original file | Final file |
|---|---|---|
| Filename | modeM0/AS1G05_219T01_9000000540_04355cztM0_level2.evt | modeM0/AS1G05_219T01_9000000540_04355cztM0_level2_quad_clean.evt |
| Size (bytes) | 538,888,320 | 75,922,560 |
| Size | 513.9 MB | 72.4 MB |
| Events in quadrant A | 3,488,888 | 482,071 |
| Events in quadrant B | 3,373,964 | 480,424 |
| Events in quadrant C | 5,681,540 | 438,844 |
| Events in quadrant D | 3,344,829 | 453,892 |
| Mode SS | |||
|---|---|---|---|
| Quadrant | BADHDUFLAG | Total packets | Discarded packets |
| A | 0 | 130 | 0 |
| B | 0 | 130 | 0 |
| C | 0 | 130 | 0 |
| D | 0 | 130 | 0 |
| Mode M9 | |||
|---|---|---|---|
| Quadrant | BADHDUFLAG | Total packets | Discarded packets |
| A | 0 | 16 | 0 |
| B | 0 | 16 | 0 |
| C | 0 | 16 | 0 |
| D | 0 | 17 | 0 |
| Mode M0 | |||
|---|---|---|---|
| Quadrant | BADHDUFLAG | Total packets | Discarded packets |
| A | 0 | 14342 | 3 |
| B | 0 | 13845 | 2 |
| C | 0 | 21090 | 2 |
| D | 0 | 14086 | 2 |
| Quadrant | Total seconds | Saturated seconds | Saturation percentage |
|---|---|---|---|
| A | 6353 | 92 | 1.448135% |
| B | 6353 | 84 | 1.322210% |
| C | 6353 | 900 | 14.166535% |
| D | 6353 | 109 | 1.715725% |
Noise dominated data is calculated using 1-second bins in cleaned event files. If a bin has >2000 counts, and if more than 50% of those come from <1% of pixels, then it is considered to be noise-dominated and hence unusable.
| Quadrant | # 1 sec bins | Bins with >0 counts | Bins with >2000 counts | High rate bins dominated by noise | Noise dominated (total time) | Noise dominated (detector-on time) | Marked lightcurve |
|---|---|---|---|---|---|---|---|
| A | 7588 | 6353 | 5 | 5 | 0.07% | 0.08% | 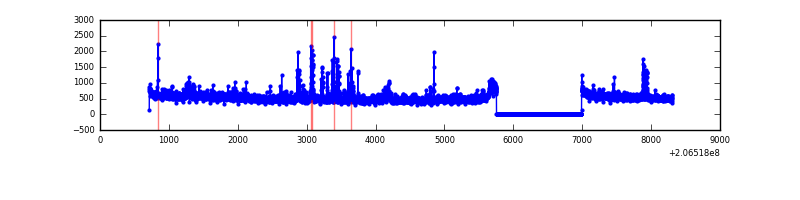 |
| B | 7588 | 6353 | 2 | 2 | 0.03% | 0.03% | 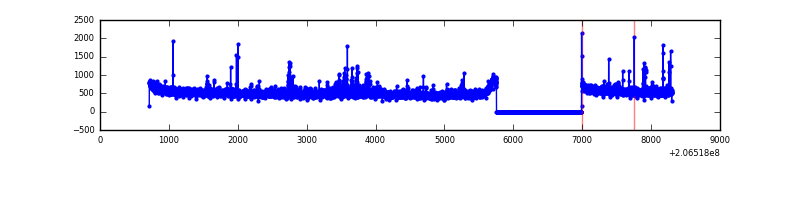 |
| C | 7588 | 6353 | 710 | 710 | 9.36% | 11.18% | 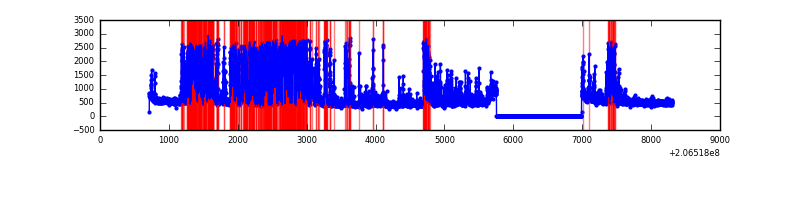 |
| D | 7588 | 6353 | 40 | 40 | 0.53% | 0.63% | 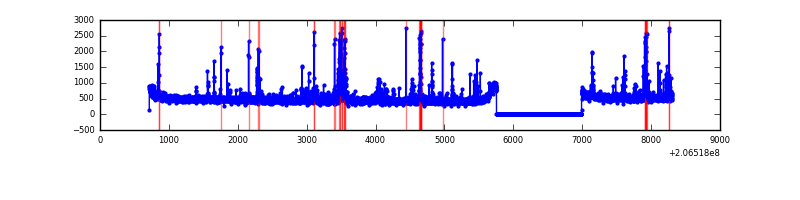 |
Top three noisy pixels from each quadrant. If the there are fewer than three noisy pixels in the level2.evt file, extra rows are filled as -1
| Pixel properties | Quadrant properties | ||||||
|---|---|---|---|---|---|---|---|
| Quadrant | DetID | PixID | Counts | Sigma | Mean | Median | Sigma |
| A | 8 | 15 | 164383 | 1001.56 | 807 | 793 | 163.3 |
| A | 13 | 251 | 126181 | 767.68 | 807 | 793 | 163.3 |
| A | 14 | 111 | 34439 | 205.99 | 807 | 793 | 163.3 |
| B | 15 | 204 | 77494 | 494.92 | 807 | 789 | 155.0 |
| B | 14 | 167 | 68132 | 434.51 | 807 | 789 | 155.0 |
| B | 4 | 48 | 52604 | 334.32 | 807 | 789 | 155.0 |
| C | 9 | 247 | 2779783 | 16243.58 | 733 | 738 | 171.1 |
| C | 9 | 16 | 25469 | 144.55 | 733 | 738 | 171.1 |
| C | 12 | 4 | 7127 | 37.34 | 733 | 738 | 171.1 |
| D | 2 | 136 | 170771 | 915.98 | 776 | 756 | 185.6 |
| D | 4 | 95 | 57986 | 308.34 | 776 | 756 | 185.6 |
| D | 13 | 137 | 47620 | 252.49 | 776 | 756 | 185.6 |
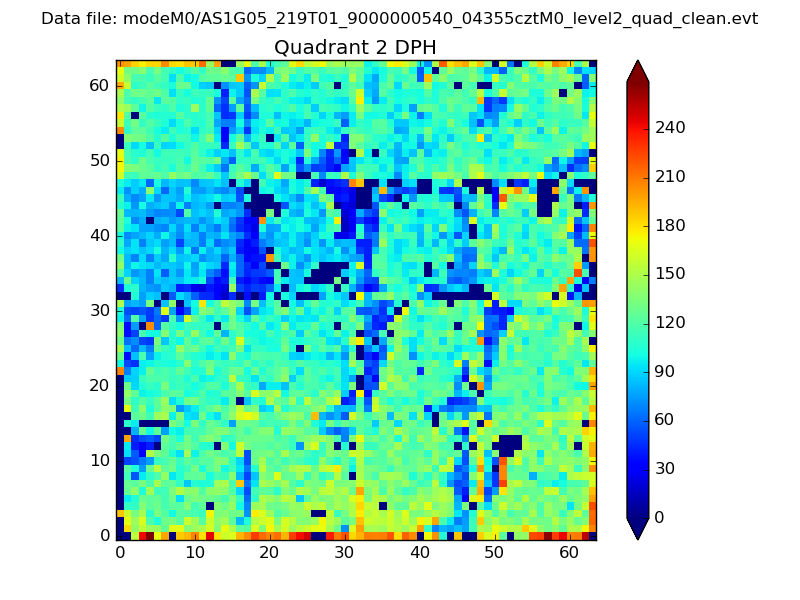
Histogram calculated using DETX and DETY for each event in the final _common_clean file
| Quadrant A | 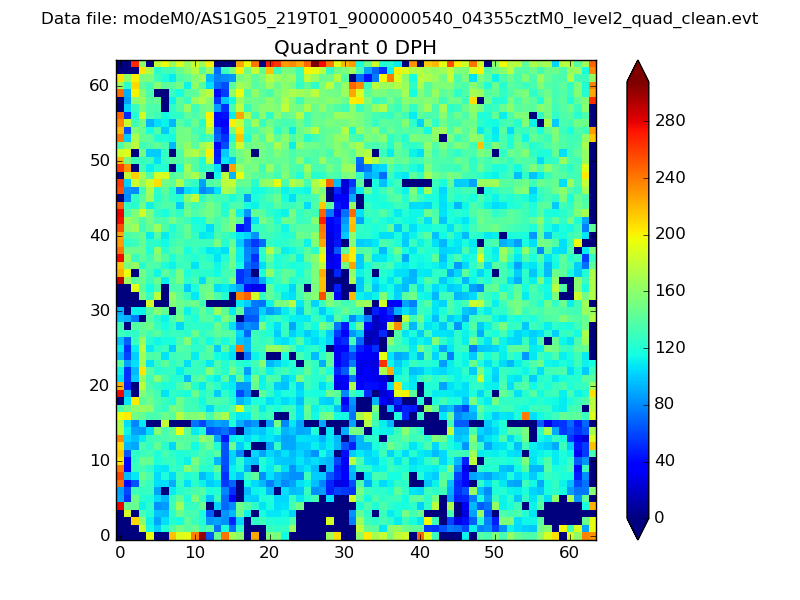 |
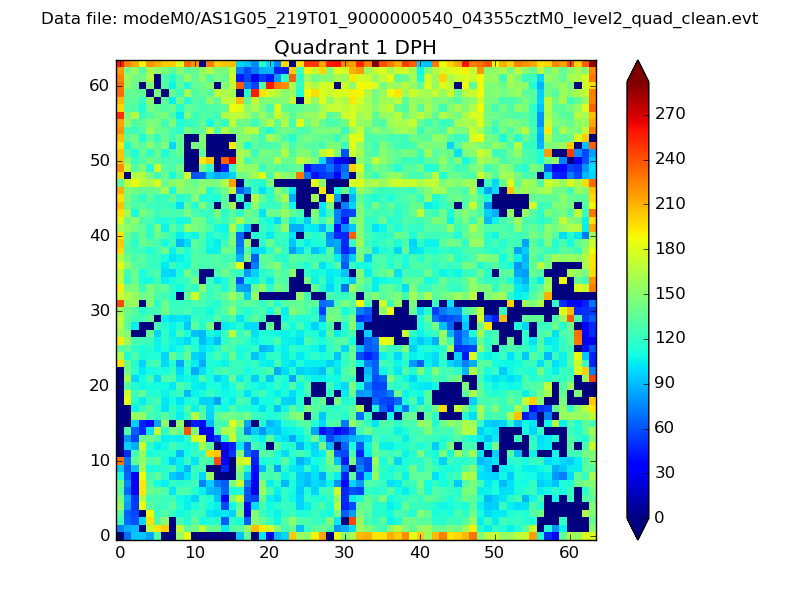 |
Quadrant B |
|---|---|---|---|
| Quadrant D | 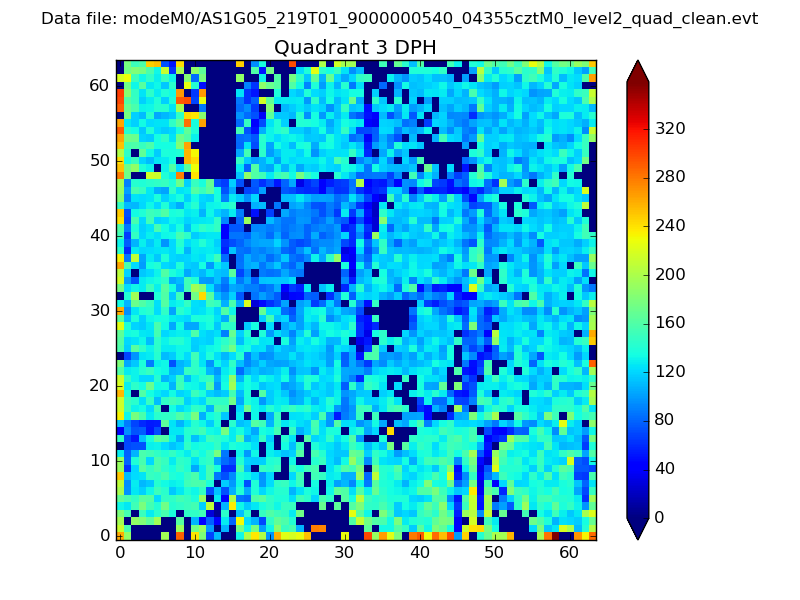 |
 |
Quadrant C |
| Plot type | Count rate plots | Images |
|---|---|---|
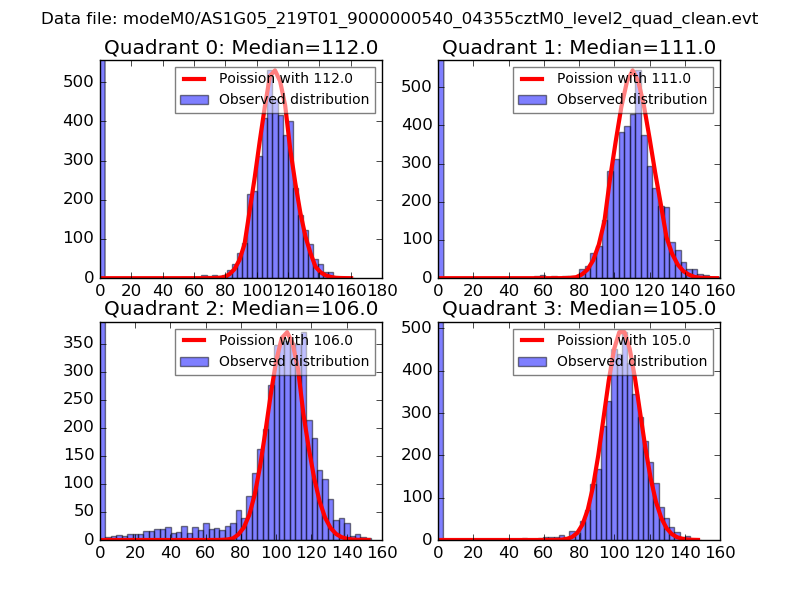
| Comparison with Poisson distribution Blue bars denote a histogram of data divided into 1 sec bins. Red curve is a Poisson curve with rate = median count rate of data. |
 |
 |
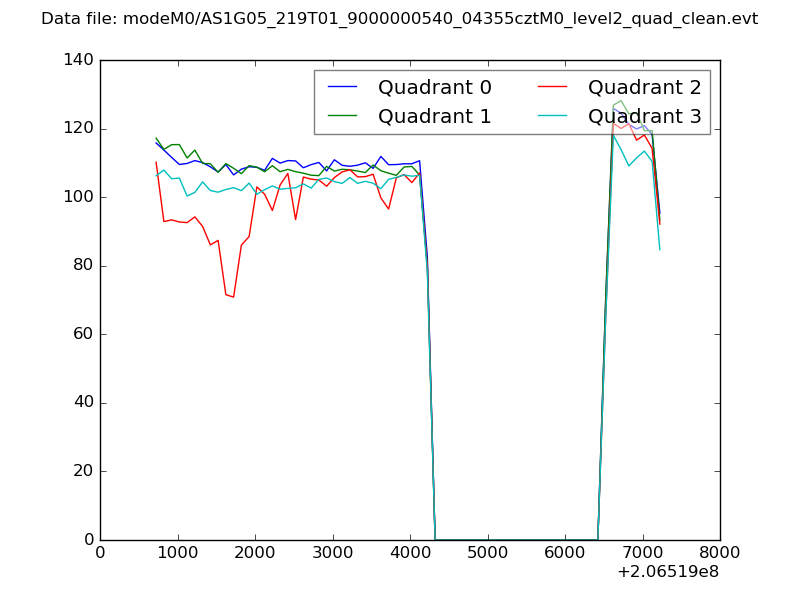
| Quadrant-wise count rates Data is divided into 100 sec bins |
 |
|
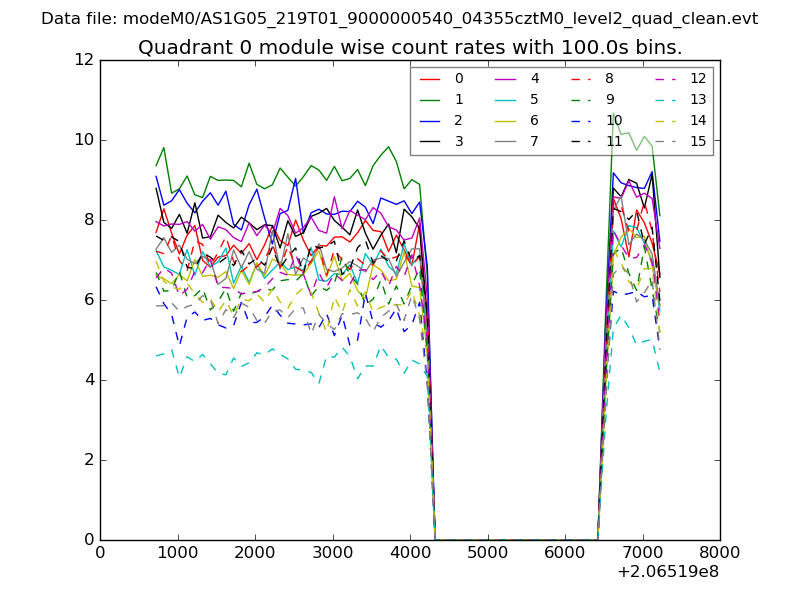
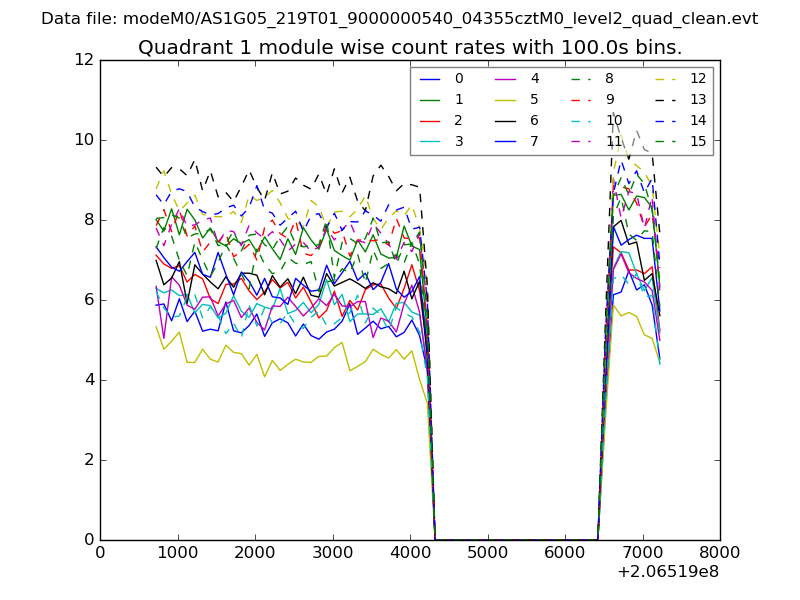
| Module-wise count rates for Quadrant A Data is divided into 100 sec bins |
 |
 |
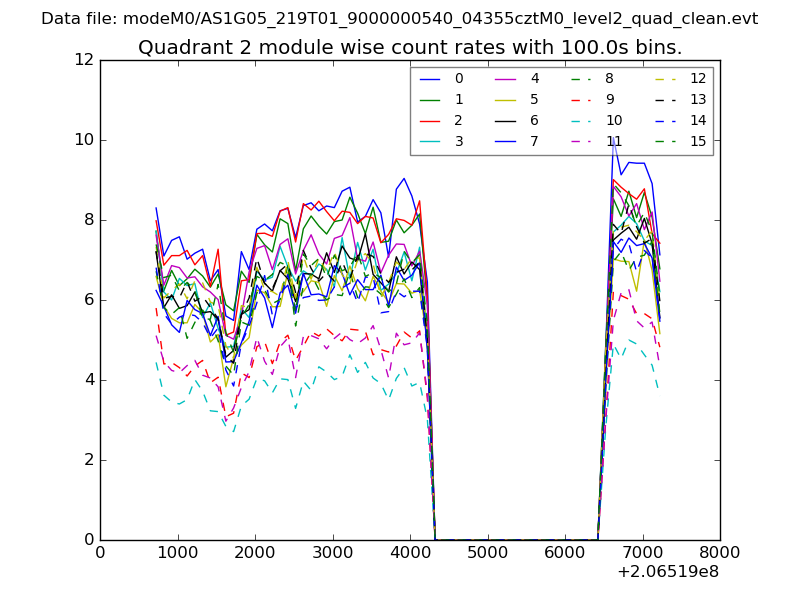
| Module-wise count rates for Quadrant B Data is divided into 100 sec bins |
 |
 |
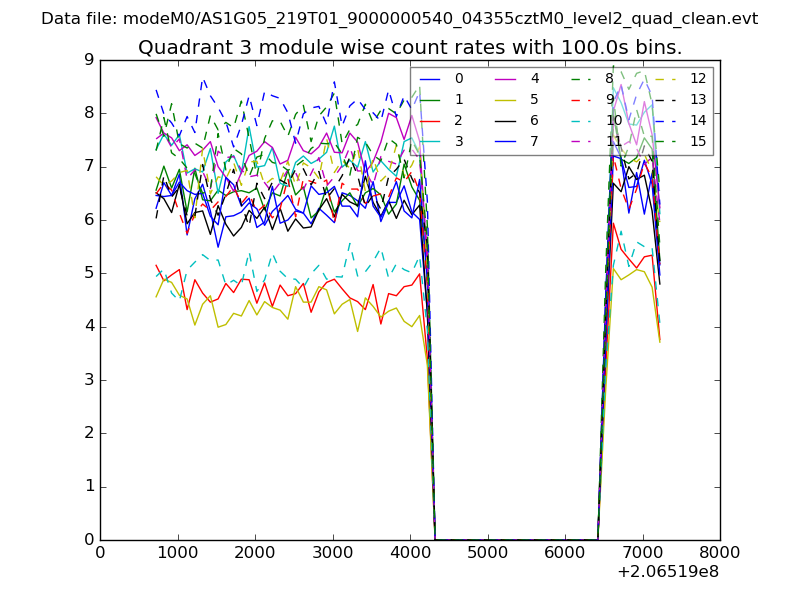
| Module-wise count rates for Quadrant C Data is divided into 100 sec bins |
 |
 |
| Module-wise count rates for Quadrant D Data is divided into 100 sec bins |
 |
 |
| Parameter | Plot |
|---|---|
| CZT HV Monitor | 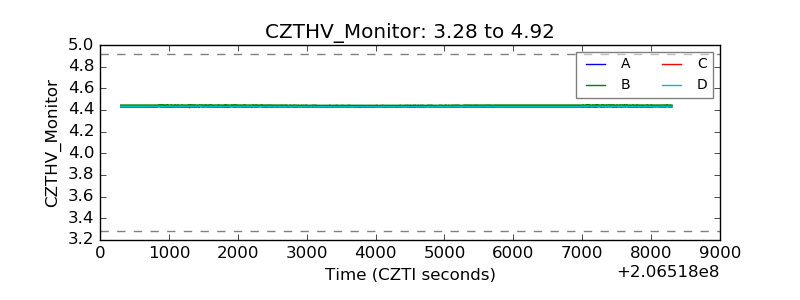 |
| D_VDD | 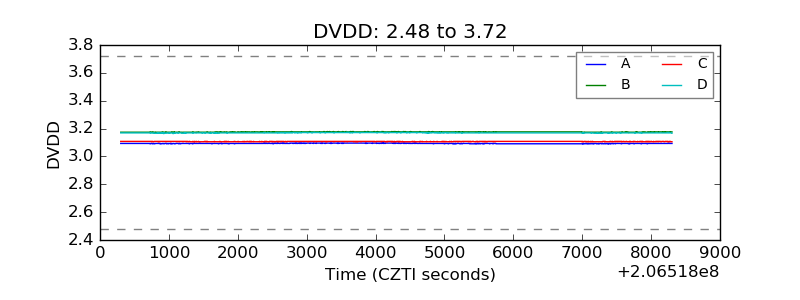 |
| Temperature 1 | 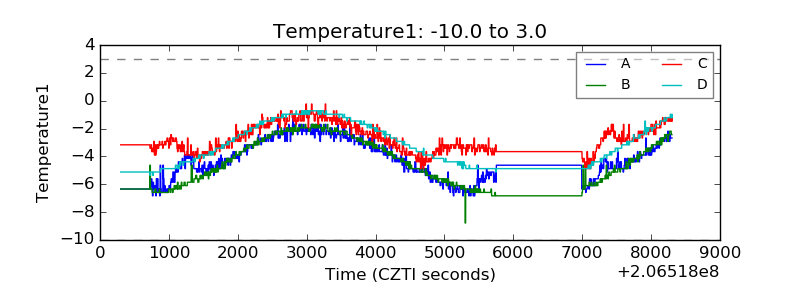 |
| Veto HV Monitor | 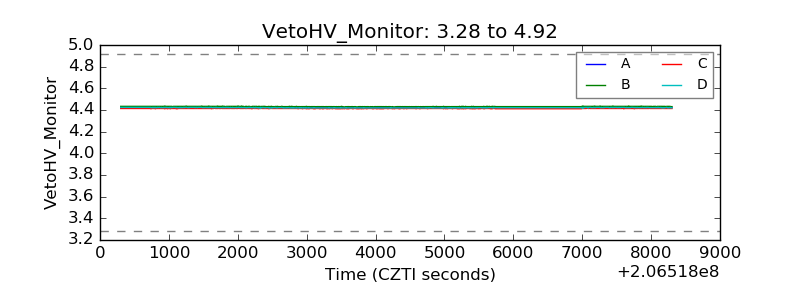 |
| Veto LLD | 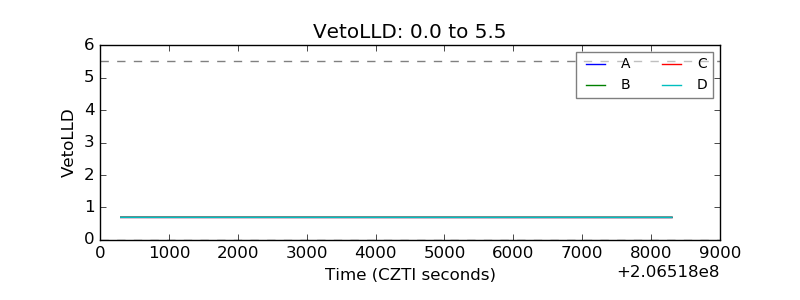 |
| Alpha Counter | 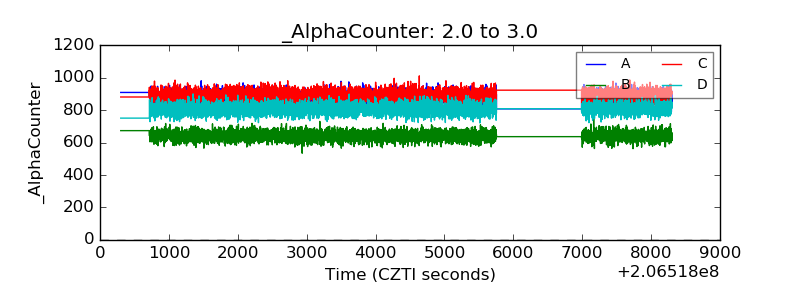 |
| _CPM_Rate | 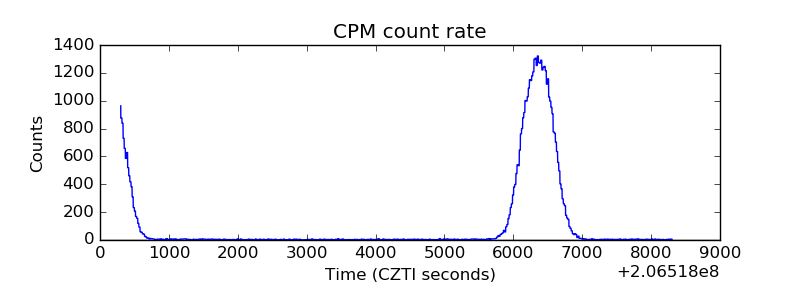 |
| CZT Counter | 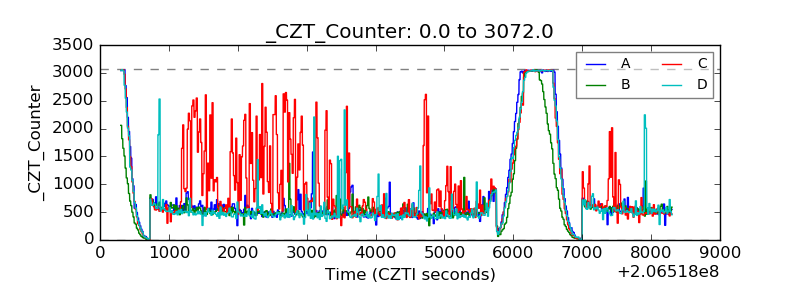 |
| +2.5 Volts monitor | 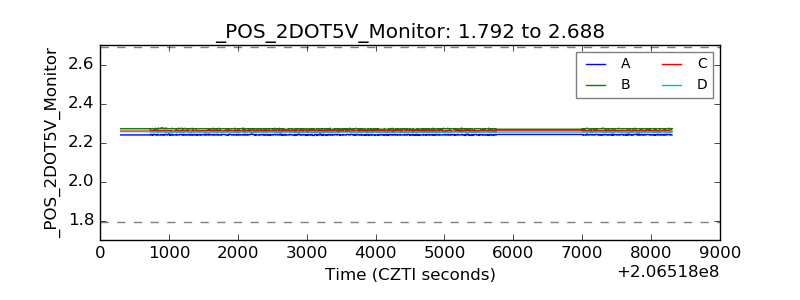 |
| +5 Volts monitor |  |
| _ROLL_ROT | 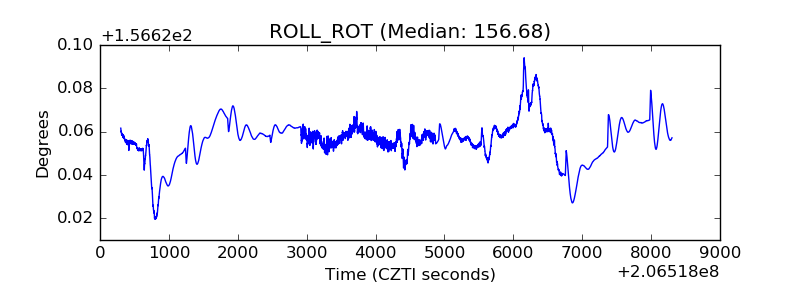 |
| _Roll_DEC | 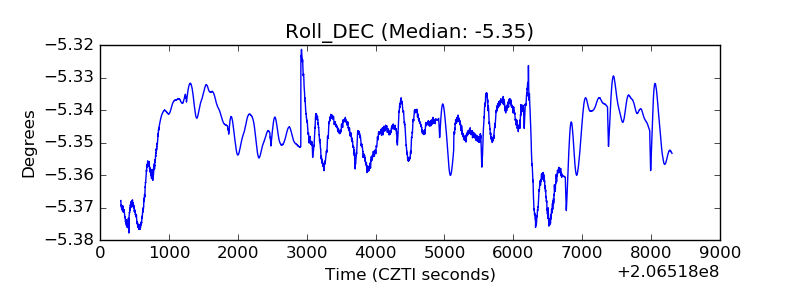 |
| _Roll_RA | 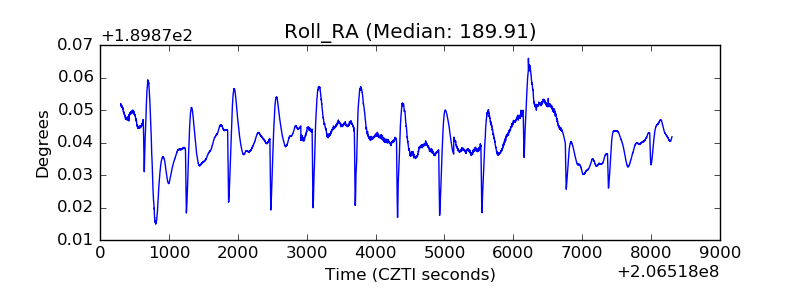 |
| Veto Counter | 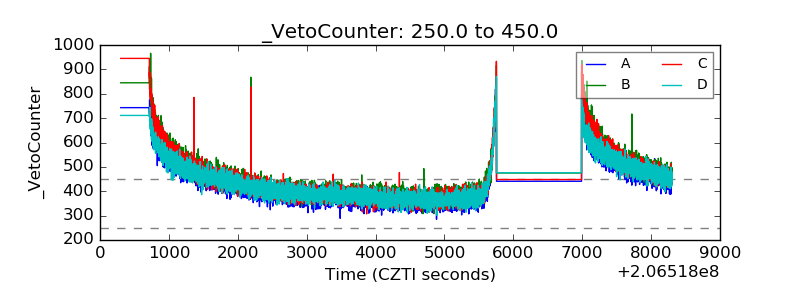 |