| Param | Original file | Final file |
|---|---|---|
| Filename | modeM0/AS1G05_219T01_9000000540_04356cztM0_level2.evt | modeM0/AS1G05_219T01_9000000540_04356cztM0_level2_quad_clean.evt |
| Size (bytes) | 624,119,040 | 88,272,000 |
| Size | 595.2 MB | 84.2 MB |
| Events in quadrant A | 3,645,891 | 588,271 |
| Events in quadrant B | 3,572,675 | 585,481 |
| Events in quadrant C | 7,569,791 | 486,416 |
| Events in quadrant D | 3,665,952 | 551,874 |
| Mode SS | |||
|---|---|---|---|
| Quadrant | BADHDUFLAG | Total packets | Discarded packets |
| A | 0 | 134 | 0 |
| B | 0 | 134 | 0 |
| C | 0 | 134 | 0 |
| D | 0 | 134 | 0 |
| Mode M9 | |||
|---|---|---|---|
| Quadrant | BADHDUFLAG | Total packets | Discarded packets |
| A | 0 | 17 | 0 |
| B | 0 | 17 | 0 |
| C | 0 | 17 | 0 |
| D | 0 | 18 | 0 |
| Mode M0 | |||
|---|---|---|---|
| Quadrant | BADHDUFLAG | Total packets | Discarded packets |
| A | 0 | 15032 | 3 |
| B | 0 | 14584 | 2 |
| C | 0 | 26888 | 2 |
| D | 0 | 15003 | 2 |
| Quadrant | Total seconds | Saturated seconds | Saturation percentage |
|---|---|---|---|
| A | 6604 | 112 | 1.695942% |
| B | 6604 | 87 | 1.317383% |
| C | 6604 | 1627 | 24.636584% |
| D | 6604 | 111 | 1.680800% |
Noise dominated data is calculated using 1-second bins in cleaned event files. If a bin has >2000 counts, and if more than 50% of those come from <1% of pixels, then it is considered to be noise-dominated and hence unusable.
| Quadrant | # 1 sec bins | Bins with >0 counts | Bins with >2000 counts | High rate bins dominated by noise | Noise dominated (total time) | Noise dominated (detector-on time) | Marked lightcurve |
|---|---|---|---|---|---|---|---|
| A | 7879 | 6604 | 17 | 17 | 0.22% | 0.26% | 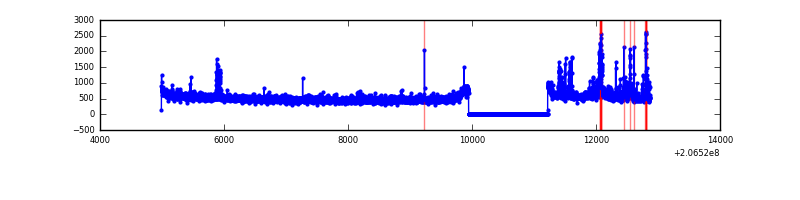 |
| B | 7879 | 6604 | 8 | 8 | 0.10% | 0.12% | 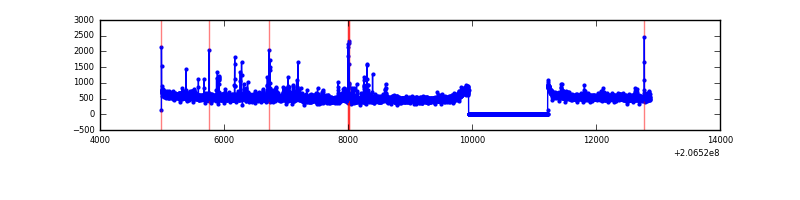 |
| C | 7878 | 6603 | 1400 | 1400 | 17.77% | 21.20% | 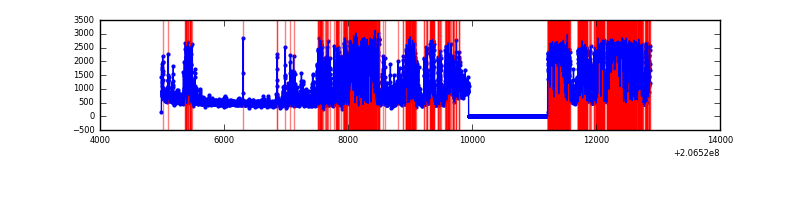 |
| D | 7879 | 6604 | 46 | 46 | 0.58% | 0.70% | 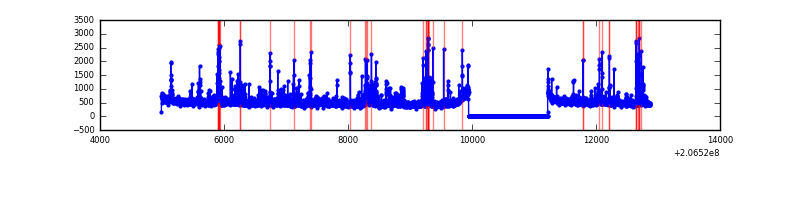 |
Top three noisy pixels from each quadrant. If the there are fewer than three noisy pixels in the level2.evt file, extra rows are filled as -1
| Pixel properties | Quadrant properties | ||||||
|---|---|---|---|---|---|---|---|
| Quadrant | DetID | PixID | Counts | Sigma | Mean | Median | Sigma |
| A | 0 | 13 | 224343 | 1303.84 | 850 | 832 | 171.4 |
| A | 13 | 251 | 59516 | 342.33 | 850 | 832 | 171.4 |
| A | 8 | 15 | 39805 | 227.35 | 850 | 832 | 171.4 |
| B | 15 | 204 | 114650 | 709.18 | 845 | 825 | 160.5 |
| B | 14 | 167 | 96887 | 598.51 | 845 | 825 | 160.5 |
| B | 4 | 48 | 49271 | 301.84 | 845 | 825 | 160.5 |
| C | 9 | 247 | 4743873 | 28657.02 | 715 | 718 | 165.5 |
| C | 9 | 16 | 15416 | 88.8 | 715 | 718 | 165.5 |
| C | 10 | 65 | 9266 | 51.64 | 715 | 718 | 165.5 |
| D | 2 | 136 | 178962 | 899.78 | 818 | 797 | 198.0 |
| D | 4 | 95 | 83286 | 416.59 | 818 | 797 | 198.0 |
| D | 12 | 79 | 66151 | 330.05 | 818 | 797 | 198.0 |
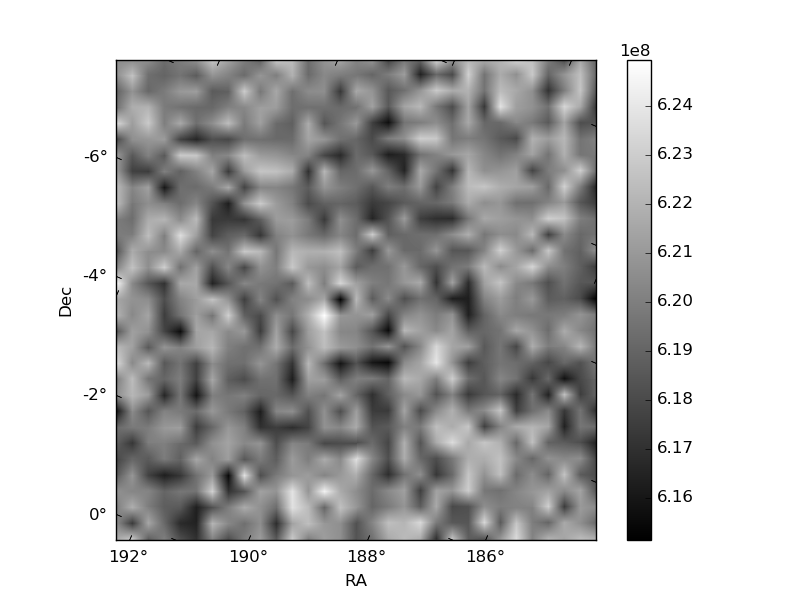
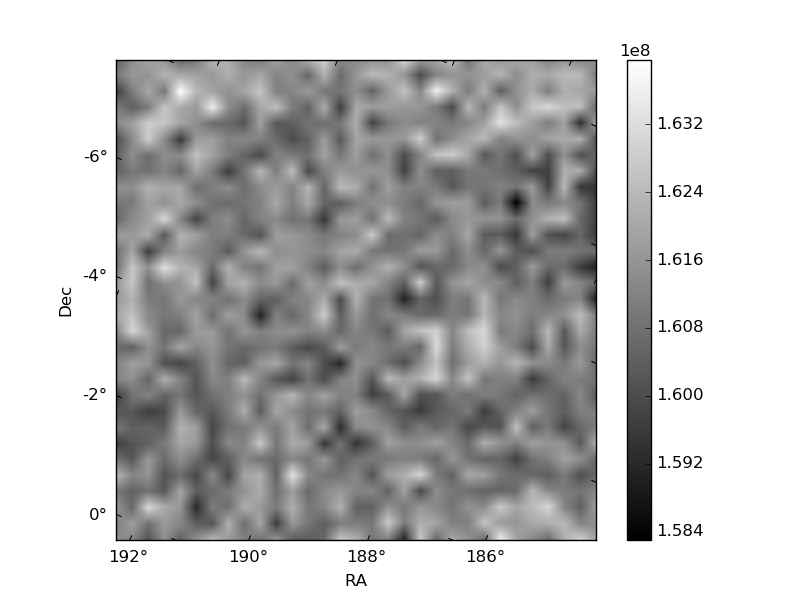
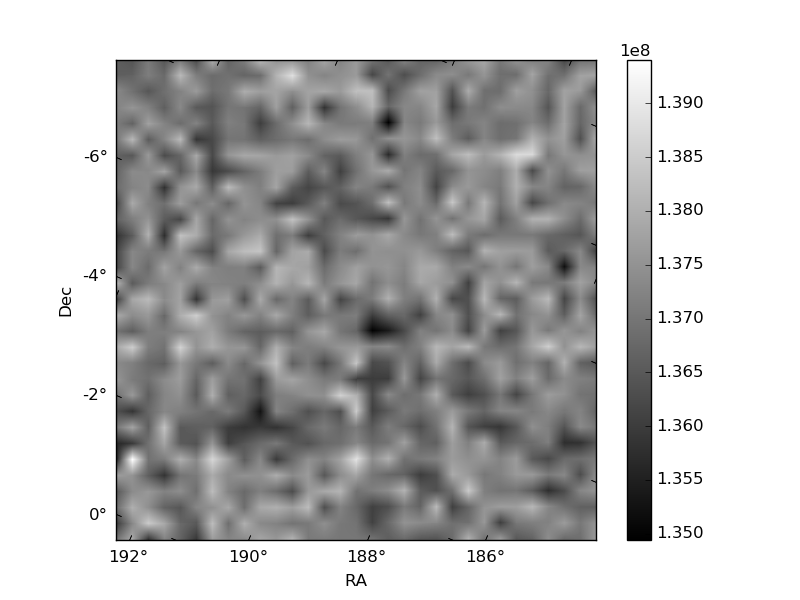
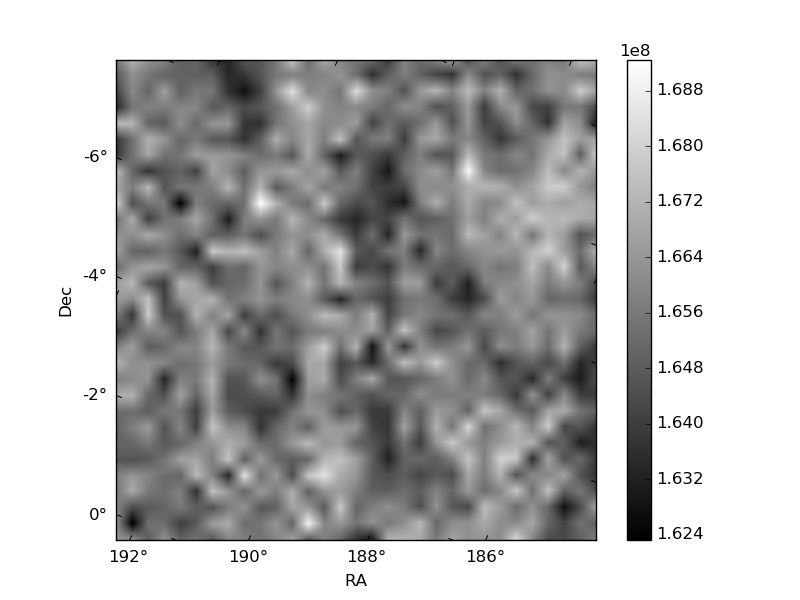
Histogram calculated using DETX and DETY for each event in the final _common_clean file
| Quadrant A | 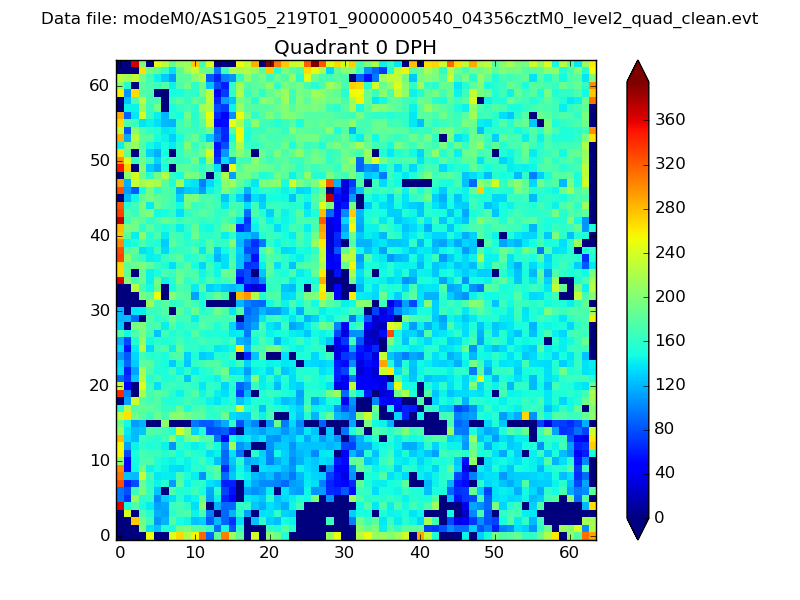 |
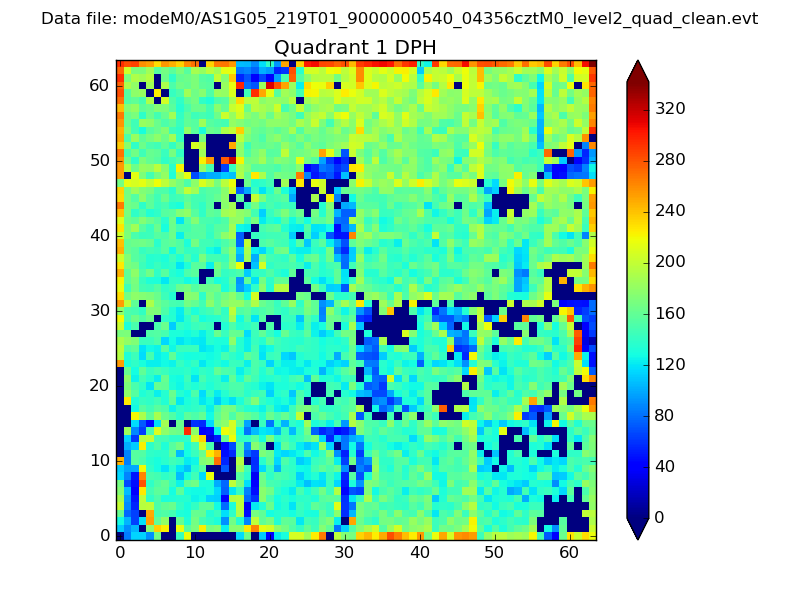 |
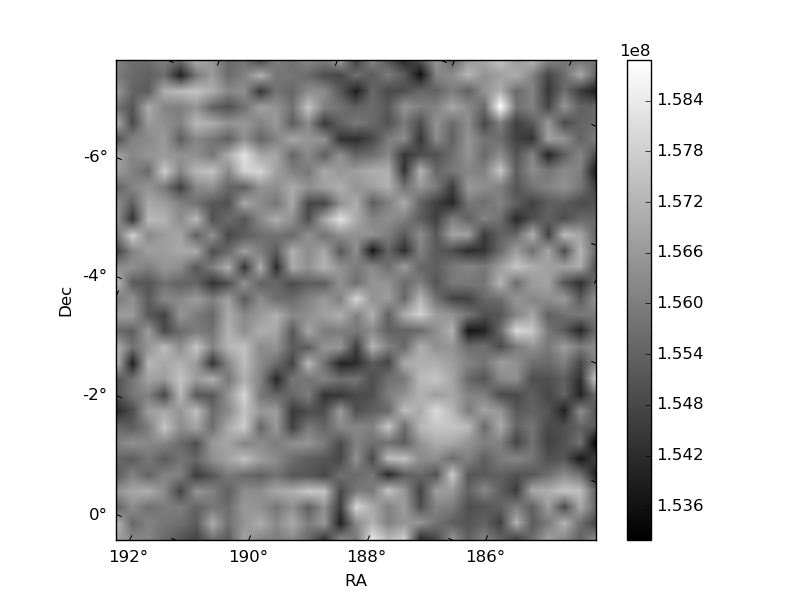
Quadrant B |
|---|---|---|---|
| Quadrant D | 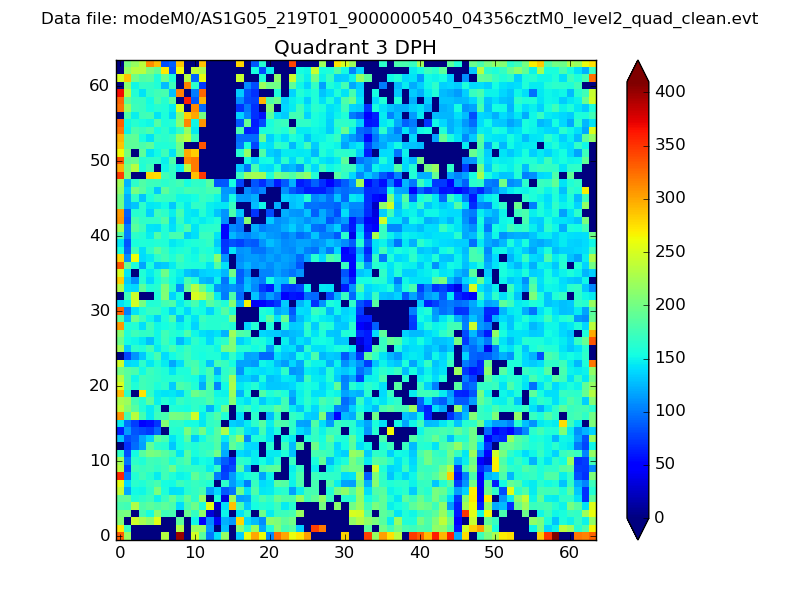 |
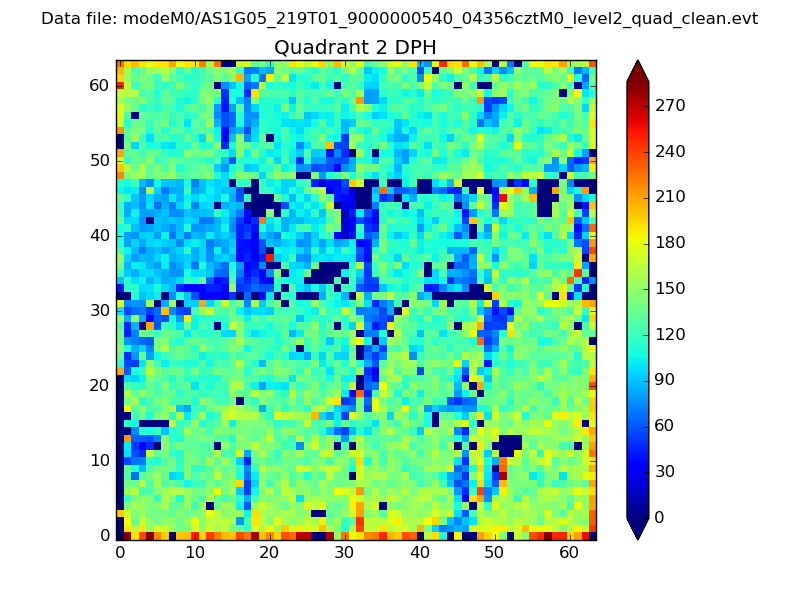 |
Quadrant C |
| Plot type | Count rate plots | Images |
|---|---|---|
| Comparison with Poisson distribution Blue bars denote a histogram of data divided into 1 sec bins. Red curve is a Poisson curve with rate = median count rate of data. |
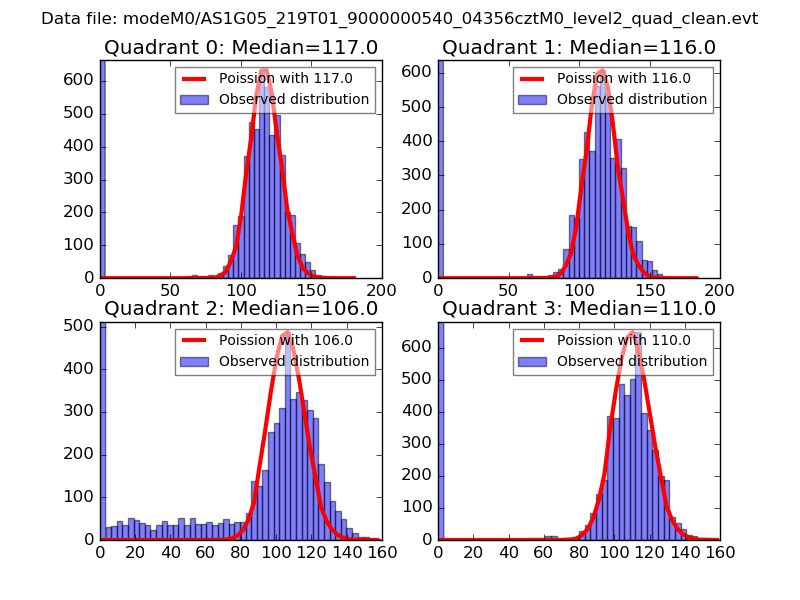 |
 |
| Quadrant-wise count rates Data is divided into 100 sec bins |
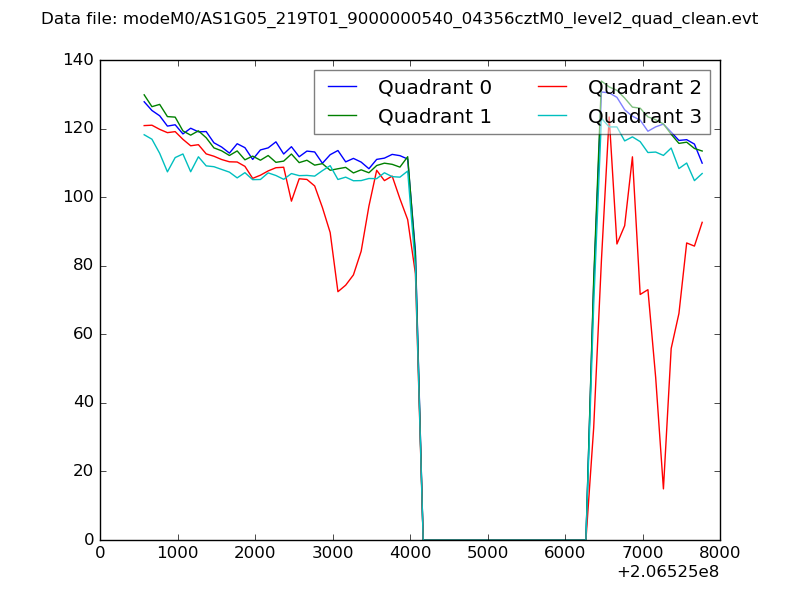 |
|
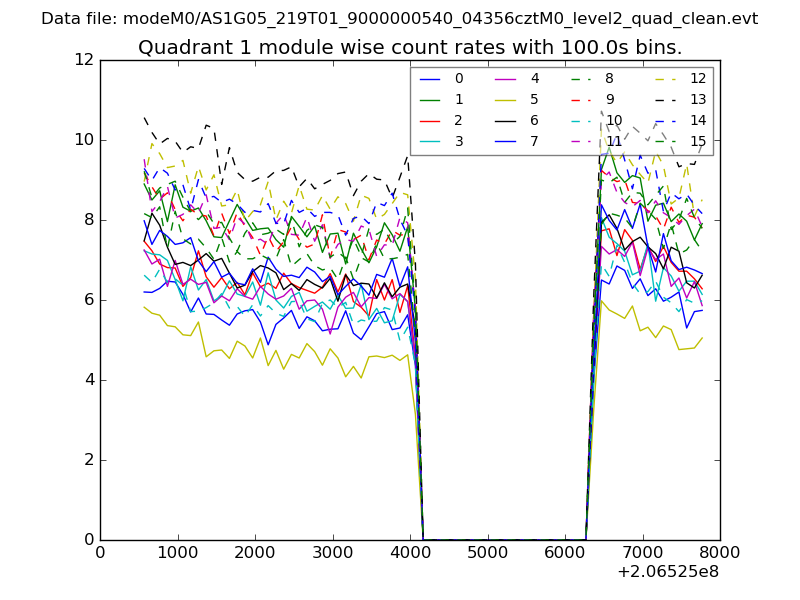
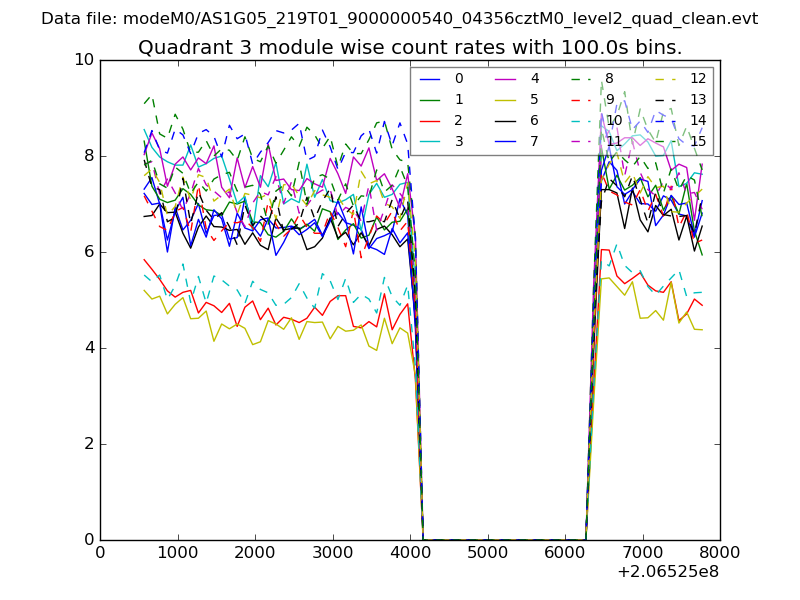
| Module-wise count rates for Quadrant A Data is divided into 100 sec bins |
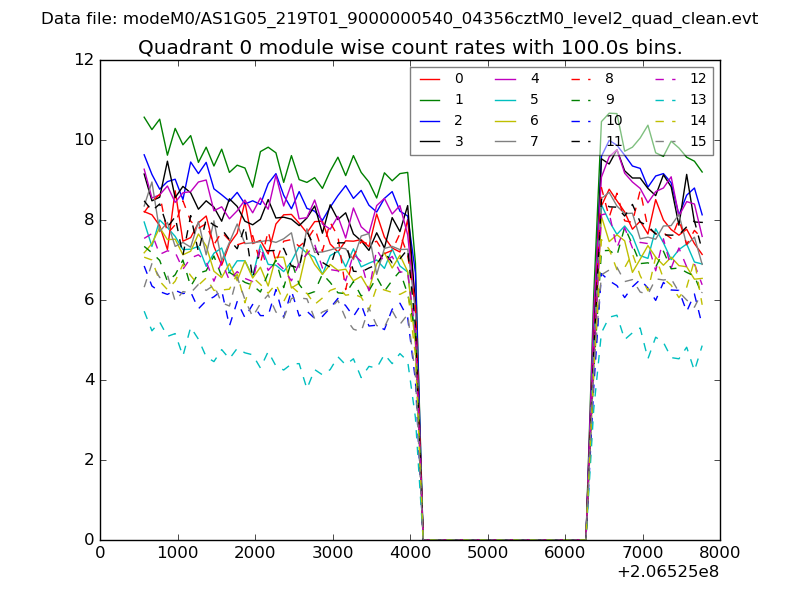 |
 |
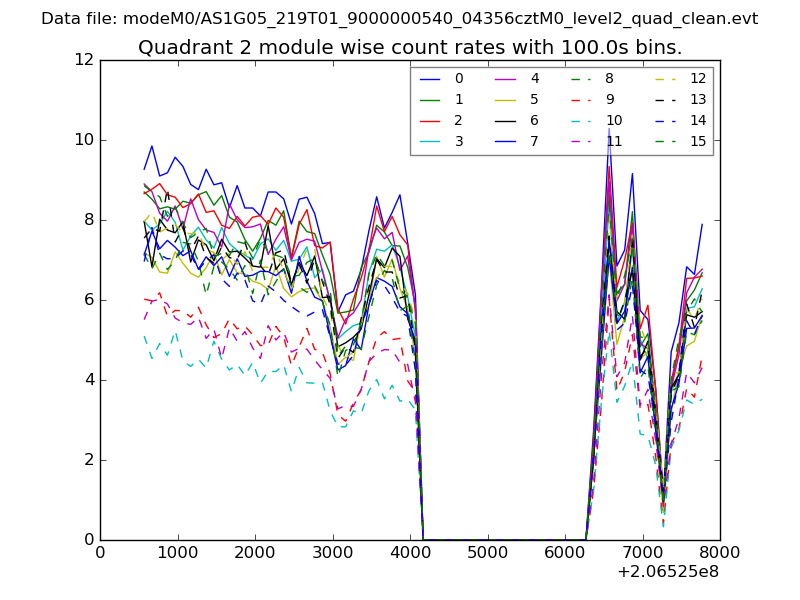
| Module-wise count rates for Quadrant B Data is divided into 100 sec bins |
 |
 |
| Module-wise count rates for Quadrant C Data is divided into 100 sec bins |
 |
 |
| Module-wise count rates for Quadrant D Data is divided into 100 sec bins |
 |
 |
| Parameter | Plot |
|---|---|
| CZT HV Monitor | 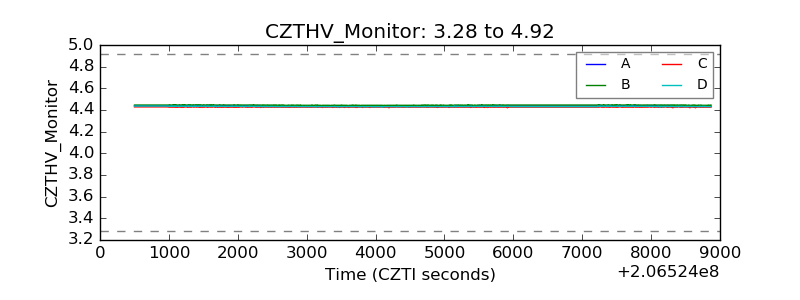 |
| D_VDD | 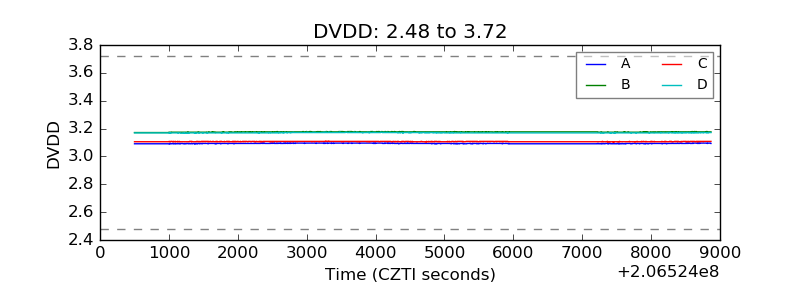 |
| Temperature 1 | 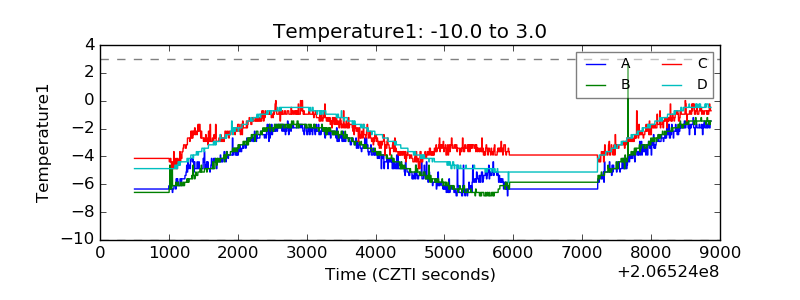 |
| Veto HV Monitor | 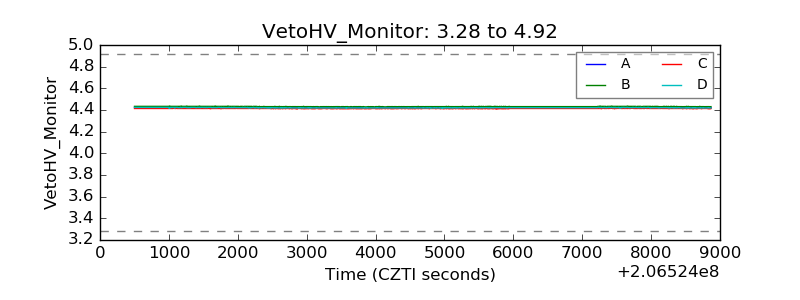 |
| Veto LLD | 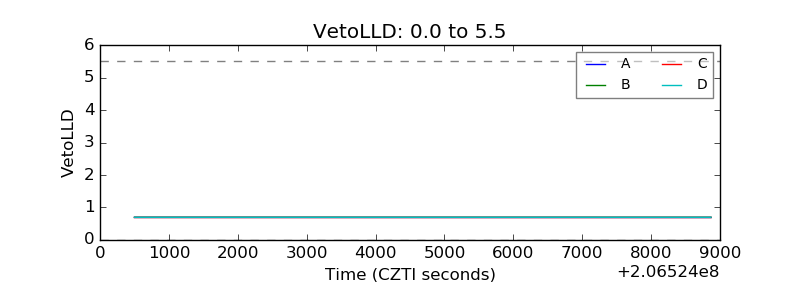 |
| Alpha Counter | 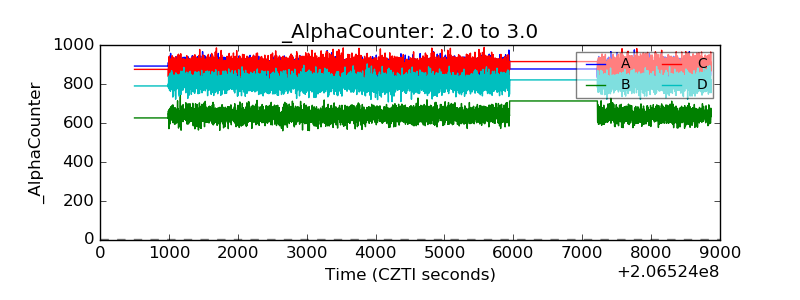 |
| _CPM_Rate | 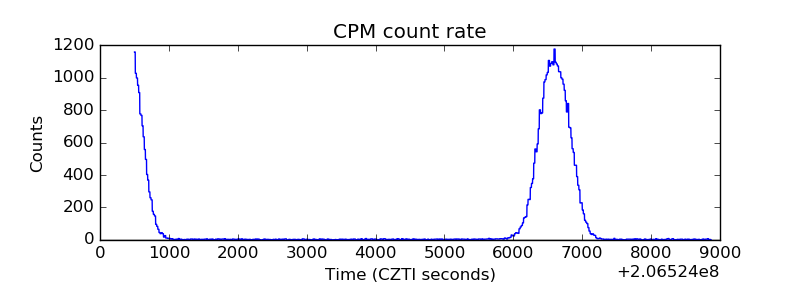 |
| CZT Counter | 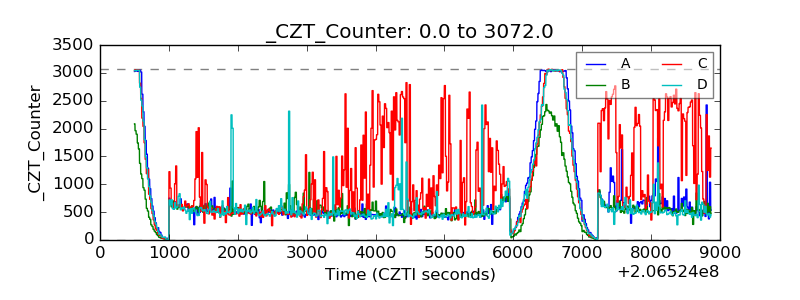 |
| +2.5 Volts monitor | 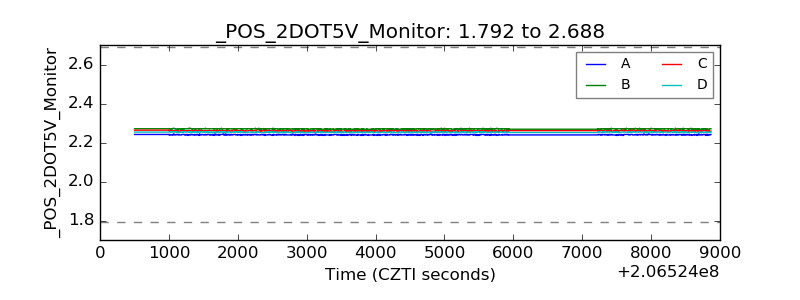 |
| +5 Volts monitor | 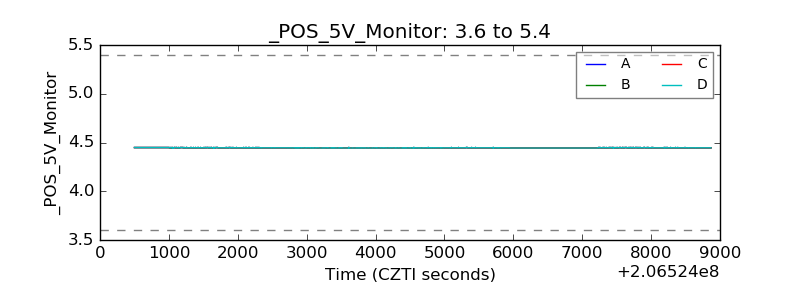 |
| _ROLL_ROT | 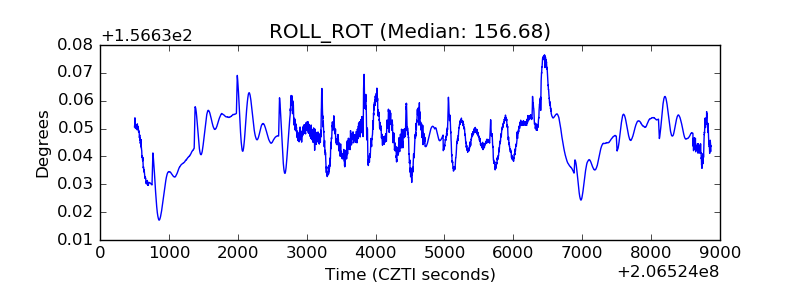 |
| _Roll_DEC | 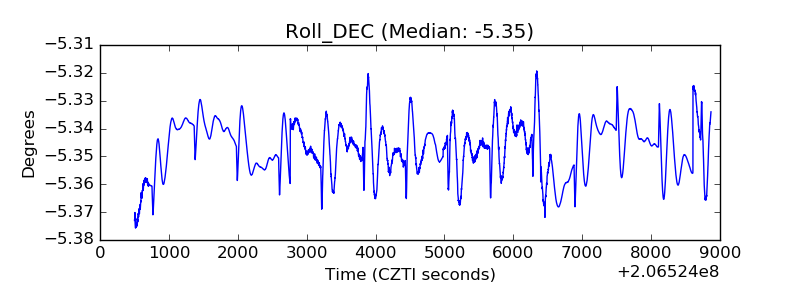 |
| _Roll_RA | 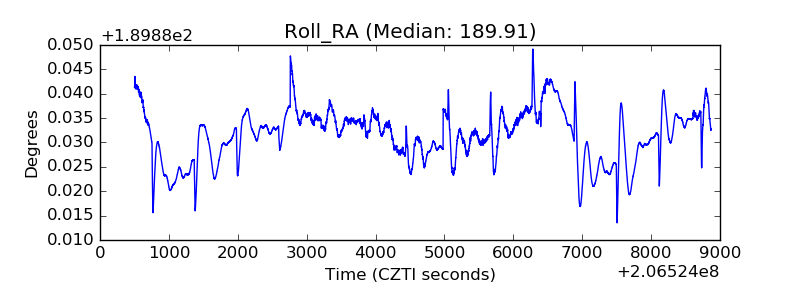 |
| Veto Counter | 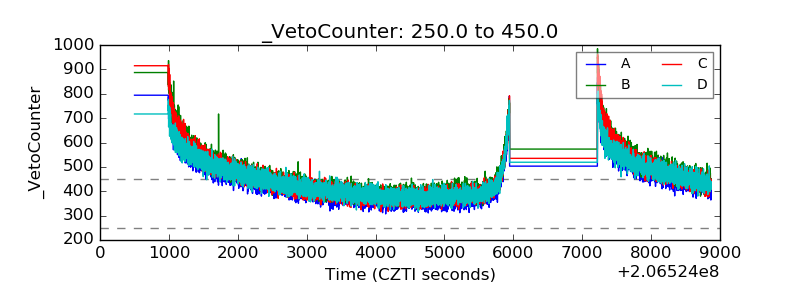 |