| Param | Original file | Final file |
|---|---|---|
| Filename | modeM0/AS1G05_219T01_9000000540_04357cztM0_level2.evt | modeM0/AS1G05_219T01_9000000540_04357cztM0_level2_quad_clean.evt |
| Size (bytes) | 643,835,520 | 73,644,480 |
| Size | 614.0 MB | 70.2 MB |
| Events in quadrant A | 3,311,796 | 505,731 |
| Events in quadrant B | 2,937,787 | 507,551 |
| Events in quadrant C | 9,961,754 | 334,524 |
| Events in quadrant D | 2,903,635 | 485,417 |
| Mode SS | |||
|---|---|---|---|
| Quadrant | BADHDUFLAG | Total packets | Discarded packets |
| A | 0 | 116 | 0 |
| B | 0 | 116 | 0 |
| C | 0 | 116 | 0 |
| D | 0 | 116 | 0 |
| Mode M9 | |||
|---|---|---|---|
| Quadrant | BADHDUFLAG | Total packets | Discarded packets |
| A | 0 | 12 | 0 |
| B | 0 | 12 | 0 |
| C | 0 | 12 | 0 |
| D | 0 | 12 | 0 |
| Mode M0 | |||
|---|---|---|---|
| Quadrant | BADHDUFLAG | Total packets | Discarded packets |
| A | 0 | 13612 | 2 |
| B | 0 | 12189 | 1 |
| C | 0 | 33382 | 1 |
| D | 0 | 12319 | 1 |
| Quadrant | Total seconds | Saturated seconds | Saturation percentage |
|---|---|---|---|
| A | 5654 | 192 | 3.395826% |
| B | 5654 | 84 | 1.485674% |
| C | 5654 | 3217 | 56.897771% |
| D | 5654 | 87 | 1.538734% |
Noise dominated data is calculated using 1-second bins in cleaned event files. If a bin has >2000 counts, and if more than 50% of those come from <1% of pixels, then it is considered to be noise-dominated and hence unusable.
| Quadrant | # 1 sec bins | Bins with >0 counts | Bins with >2000 counts | High rate bins dominated by noise | Noise dominated (total time) | Noise dominated (detector-on time) | Marked lightcurve |
|---|---|---|---|---|---|---|---|
| A | 6919 | 5654 | 74 | 74 | 1.07% | 1.31% | 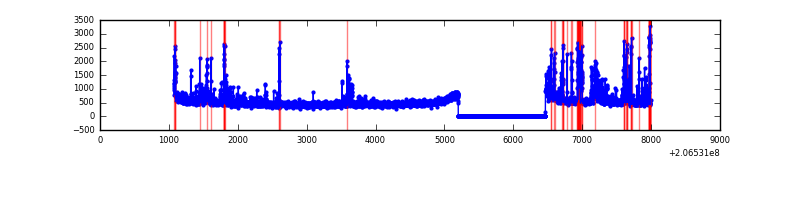 |
| B | 6919 | 5654 | 1 | 1 | 0.01% | 0.02% | 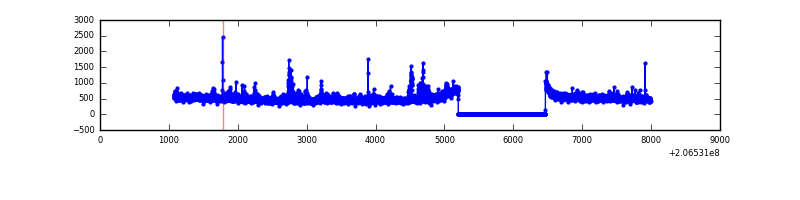 |
| C | 6919 | 5654 | 3047 | 3047 | 44.04% | 53.89% | 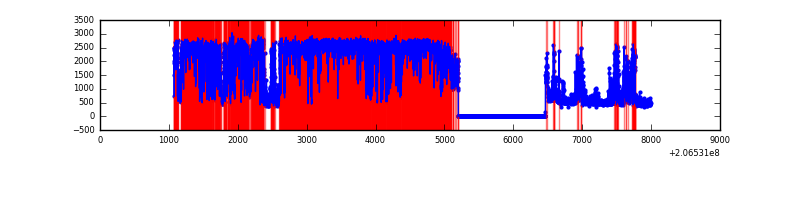 |
| D | 6919 | 5654 | 16 | 16 | 0.23% | 0.28% | 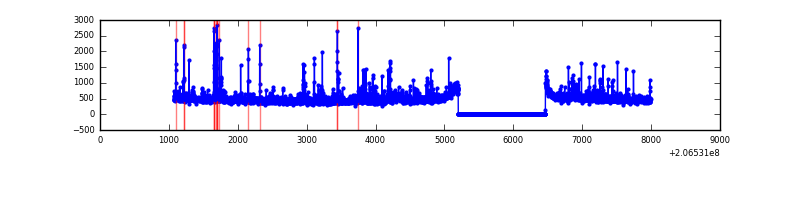 |
Top three noisy pixels from each quadrant. If the there are fewer than three noisy pixels in the level2.evt file, extra rows are filled as -1
| Pixel properties | Quadrant properties | ||||||
|---|---|---|---|---|---|---|---|
| Quadrant | DetID | PixID | Counts | Sigma | Mean | Median | Sigma |
| A | 13 | 251 | 337656 | 2353.47 | 697 | 682 | 143.2 |
| A | 0 | 13 | 177722 | 1236.47 | 697 | 682 | 143.2 |
| A | 15 | 234 | 46748 | 321.73 | 697 | 682 | 143.2 |
| B | 14 | 167 | 105728 | 784.36 | 697 | 682 | 133.9 |
| B | 15 | 204 | 88164 | 653.21 | 697 | 682 | 133.9 |
| B | 15 | 54 | 23871 | 173.15 | 697 | 682 | 133.9 |
| C | 9 | 247 | 8094571 | 76148.91 | 456 | 457 | 106.3 |
| C | 12 | 4 | 68622 | 641.29 | 456 | 457 | 106.3 |
| C | 8 | 128 | 5985 | 52.01 | 456 | 457 | 106.3 |
| D | 2 | 136 | 84052 | 518.03 | 675 | 659 | 161.0 |
| D | 10 | 187 | 41147 | 251.51 | 675 | 659 | 161.0 |
| D | 13 | 239 | 39505 | 241.31 | 675 | 659 | 161.0 |
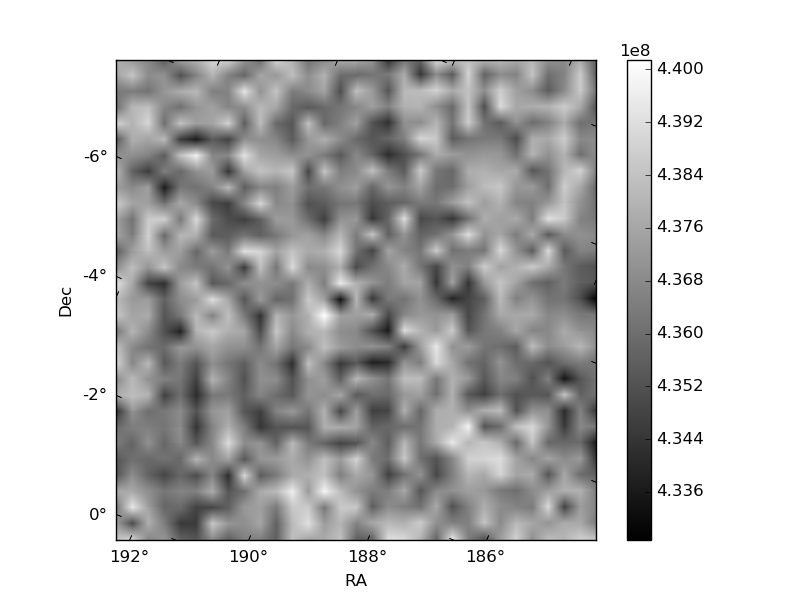
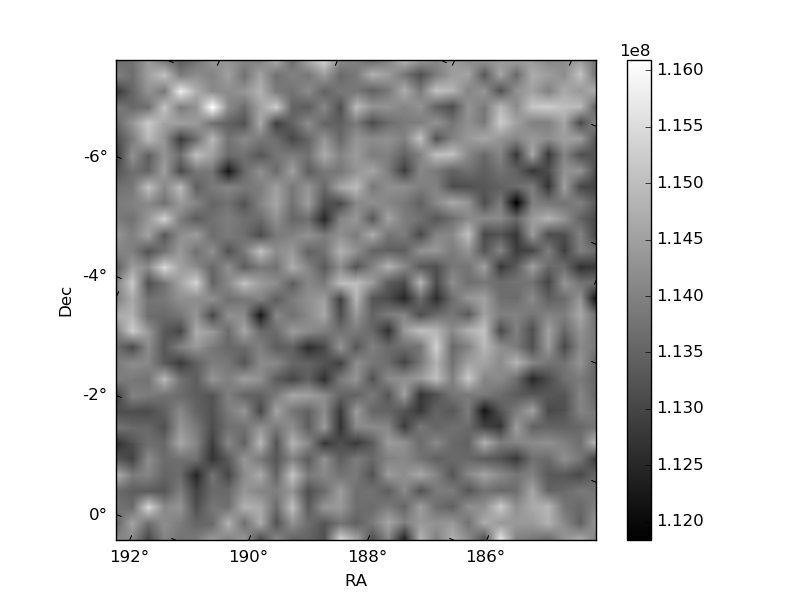
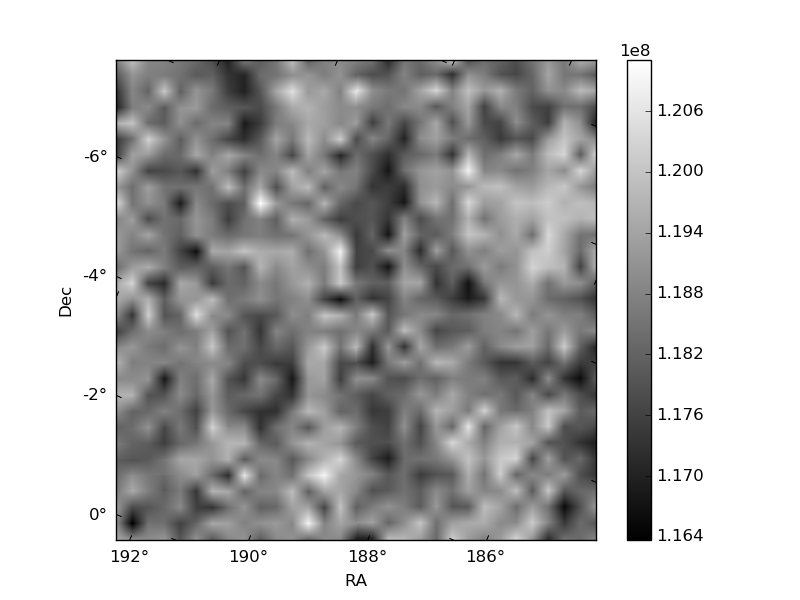
Histogram calculated using DETX and DETY for each event in the final _common_clean file
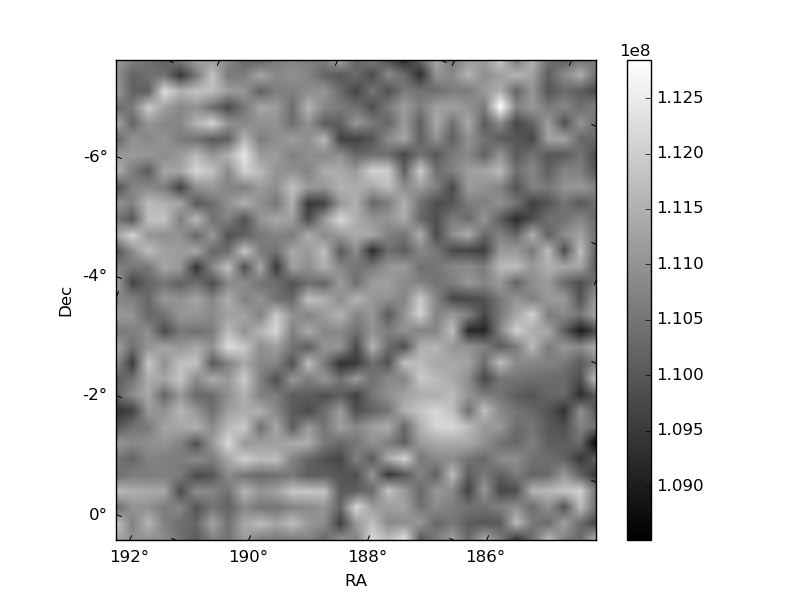
| Quadrant A | 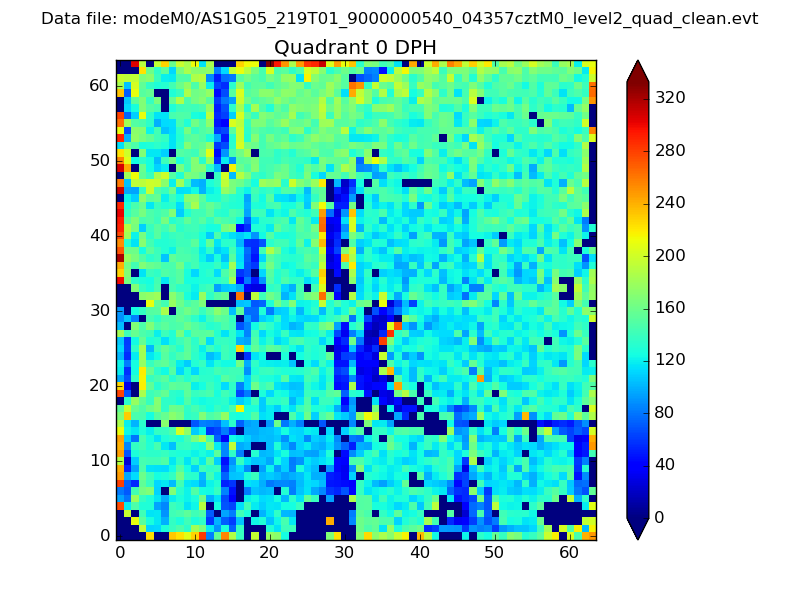 |
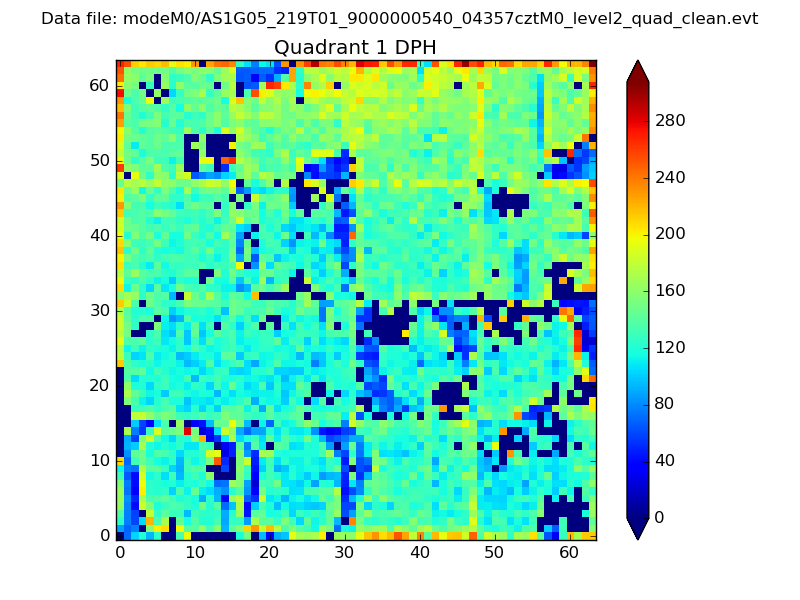 |
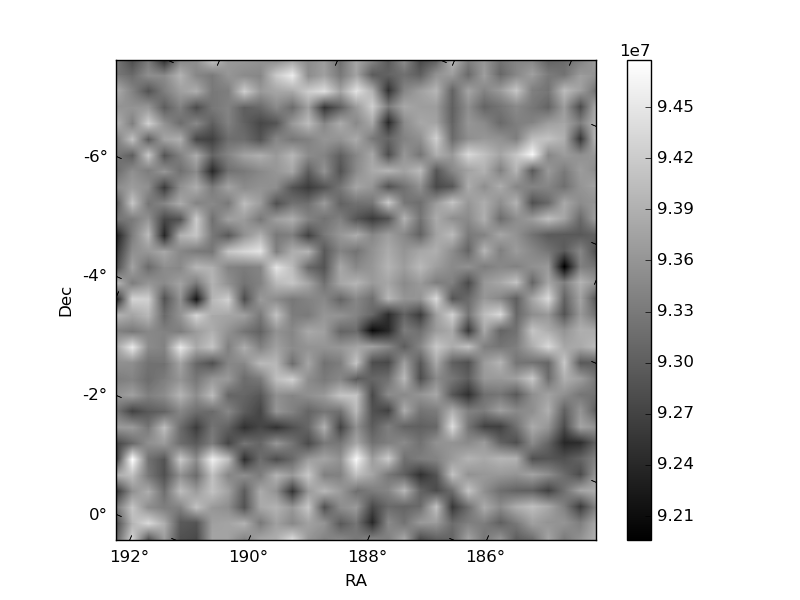
Quadrant B |
|---|---|---|---|
| Quadrant D | 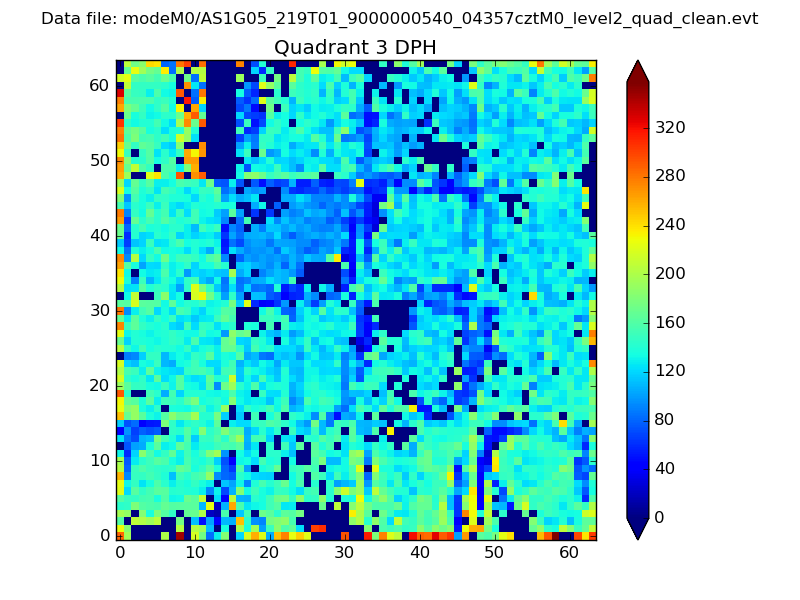 |
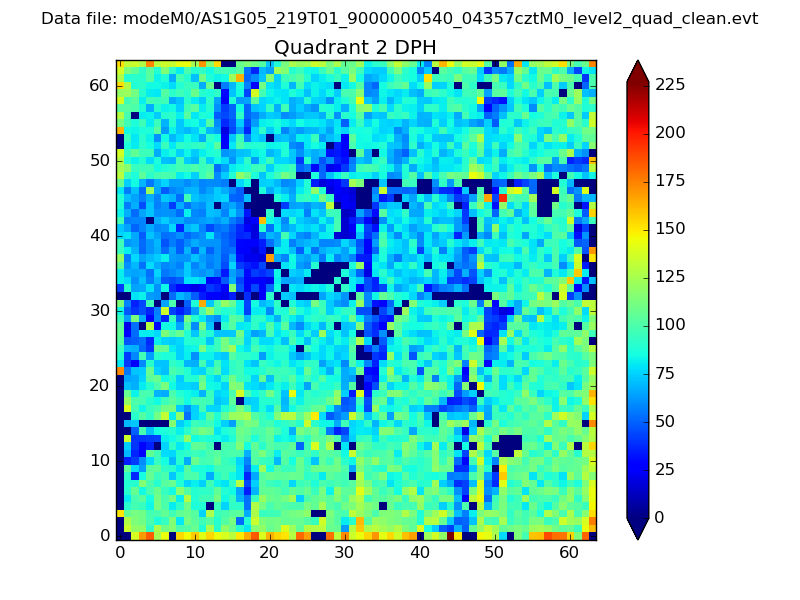 |
Quadrant C |
| Plot type | Count rate plots | Images |
|---|---|---|
| Comparison with Poisson distribution Blue bars denote a histogram of data divided into 1 sec bins. Red curve is a Poisson curve with rate = median count rate of data. |
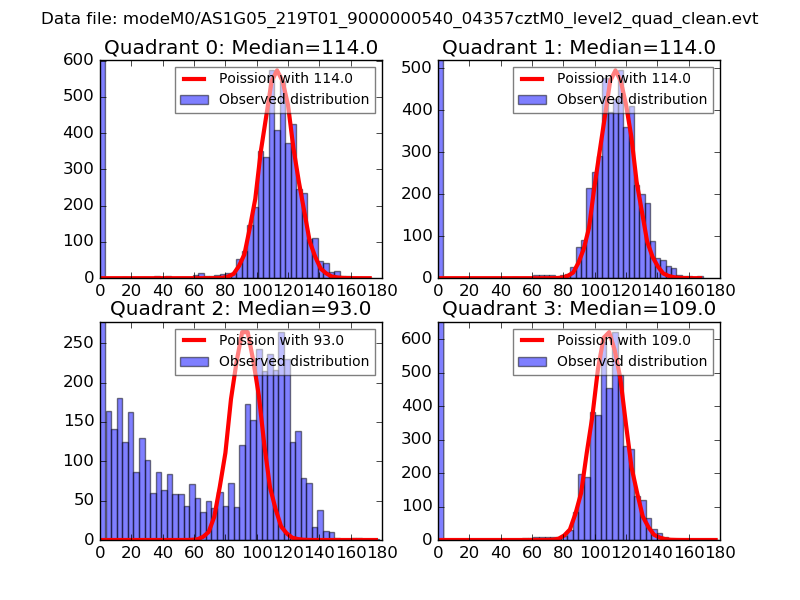 |
 |
| Quadrant-wise count rates Data is divided into 100 sec bins |
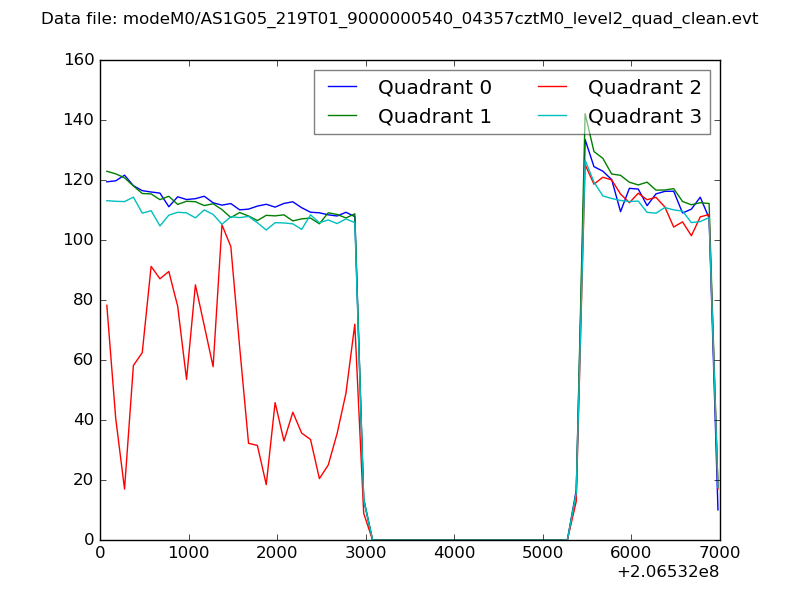 |
|
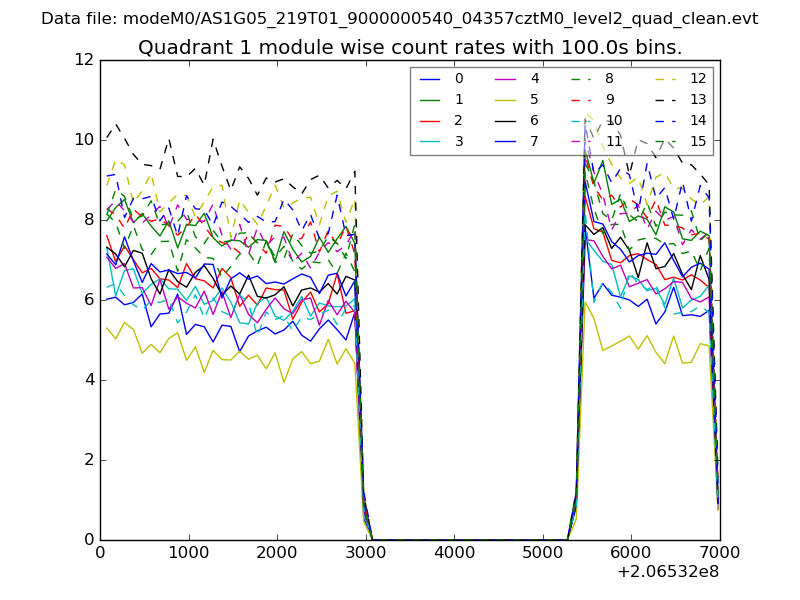
| Module-wise count rates for Quadrant A Data is divided into 100 sec bins |
 |
 |
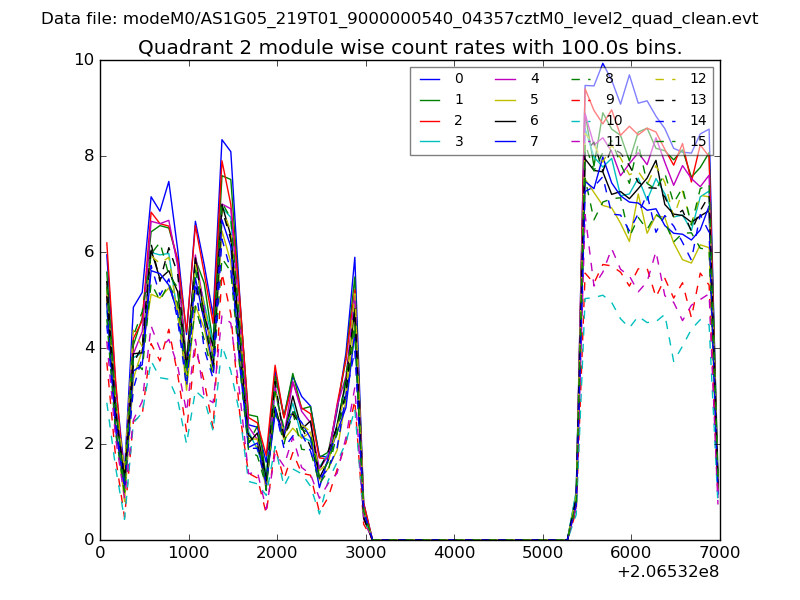
| Module-wise count rates for Quadrant B Data is divided into 100 sec bins |
 |
 |
| Module-wise count rates for Quadrant C Data is divided into 100 sec bins |
 |
 |
| Module-wise count rates for Quadrant D Data is divided into 100 sec bins |
 |
 |
| Parameter | Plot |
|---|---|
| CZT HV Monitor | 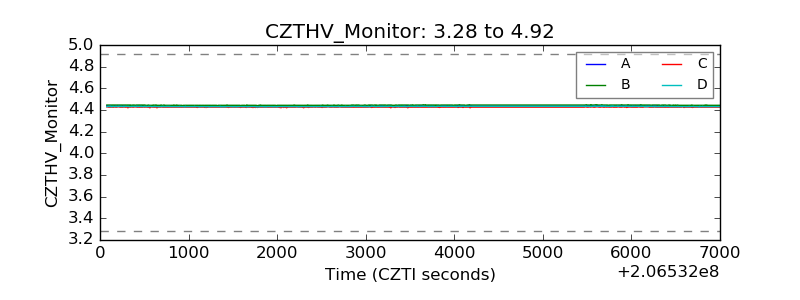 |
| D_VDD | 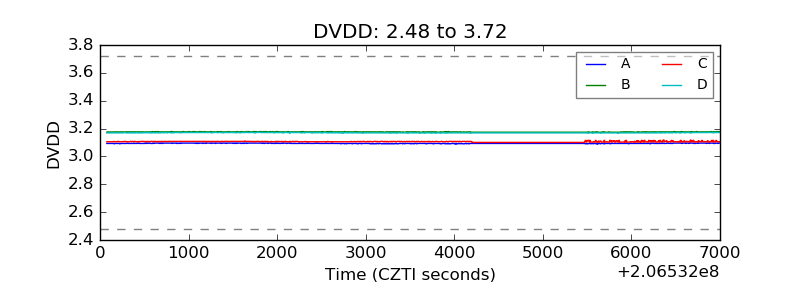 |
| Temperature 1 | 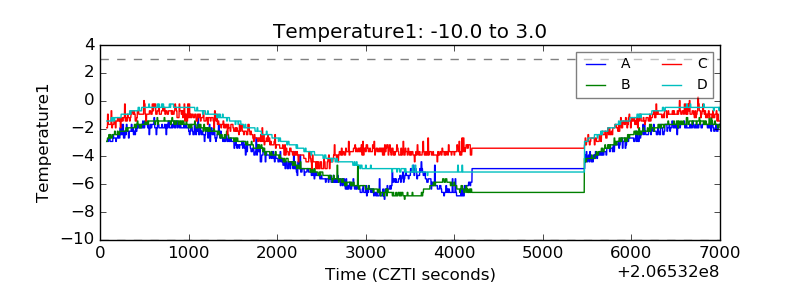 |
| Veto HV Monitor | 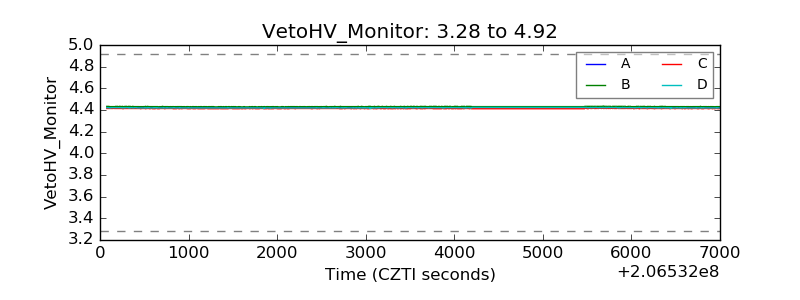 |
| Veto LLD | 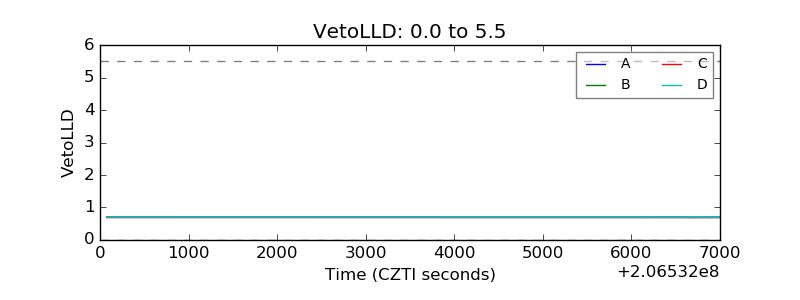 |
| Alpha Counter | 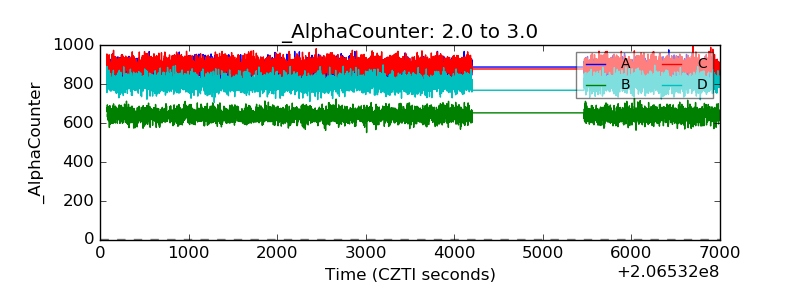 |
| _CPM_Rate | 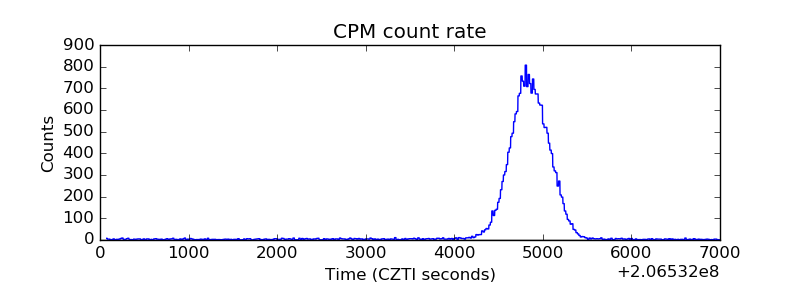 |
| CZT Counter | 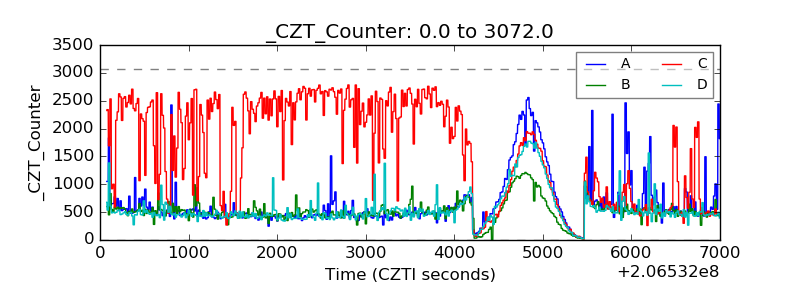 |
| +2.5 Volts monitor |  |
| +5 Volts monitor |  |
| _ROLL_ROT |  |
| _Roll_DEC | 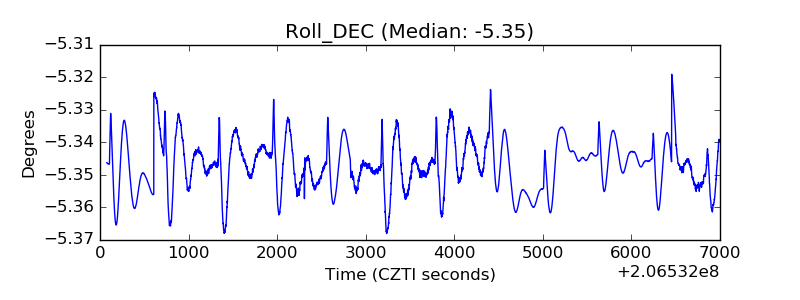 |
| _Roll_RA | 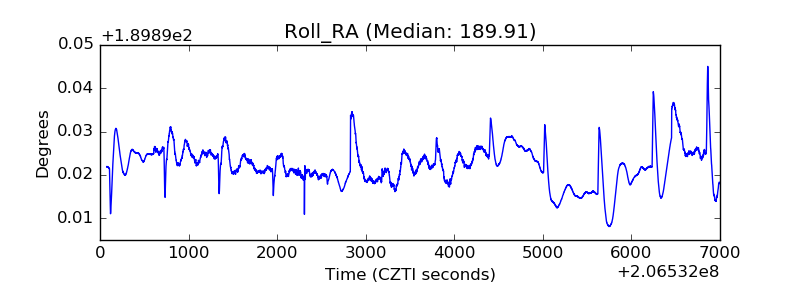 |
| Veto Counter | 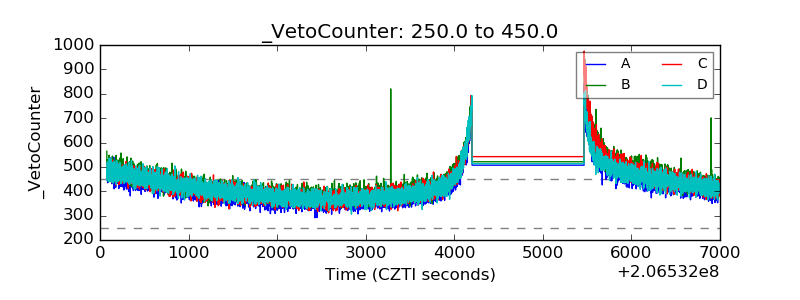 |