| Param | Original file | Final file |
|---|---|---|
| Filename | modeM0/AS1G05_219T01_9000000540_04358cztM0_level2.evt | modeM0/AS1G05_219T01_9000000540_04358cztM0_level2_quad_clean.evt |
| Size (bytes) | 574,764,480 | 85,996,800 |
| Size | 548.1 MB | 82.0 MB |
| Events in quadrant A | 5,196,534 | 525,029 |
| Events in quadrant B | 3,983,140 | 551,224 |
| Events in quadrant C | 4,375,841 | 529,487 |
| Events in quadrant D | 3,395,211 | 529,210 |
| Mode SS | |||
|---|---|---|---|
| Quadrant | BADHDUFLAG | Total packets | Discarded packets |
| A | 0 | 136 | 0 |
| B | 0 | 136 | 0 |
| C | 0 | 136 | 0 |
| D | 0 | 136 | 0 |
| Mode M9 | |||
|---|---|---|---|
| Quadrant | BADHDUFLAG | Total packets | Discarded packets |
| A | 0 | 11 | 0 |
| B | 0 | 11 | 0 |
| C | 0 | 11 | 0 |
| D | 0 | 11 | 0 |
| Mode M0 | |||
|---|---|---|---|
| Quadrant | BADHDUFLAG | Total packets | Discarded packets |
| A | 0 | 19866 | 3 |
| B | 0 | 16326 | 2 |
| C | 0 | 17559 | 2 |
| D | 0 | 14698 | 2 |
| Quadrant | Total seconds | Saturated seconds | Saturation percentage |
|---|---|---|---|
| A | 6728 | 691 | 10.270511% |
| B | 6728 | 154 | 2.288942% |
| C | 6728 | 324 | 4.815696% |
| D | 6729 | 135 | 2.006242% |
Noise dominated data is calculated using 1-second bins in cleaned event files. If a bin has >2000 counts, and if more than 50% of those come from <1% of pixels, then it is considered to be noise-dominated and hence unusable.
| Quadrant | # 1 sec bins | Bins with >0 counts | Bins with >2000 counts | High rate bins dominated by noise | Noise dominated (total time) | Noise dominated (detector-on time) | Marked lightcurve |
|---|---|---|---|---|---|---|---|
| A | 7818 | 6728 | 449 | 449 | 5.74% | 6.67% |  |
| B | 7818 | 6728 | 3 | 3 | 0.04% | 0.04% |  |
| C | 7818 | 6728 | 209 | 209 | 2.67% | 3.11% |  |
| D | 7819 | 6729 | 15 | 15 | 0.19% | 0.22% | 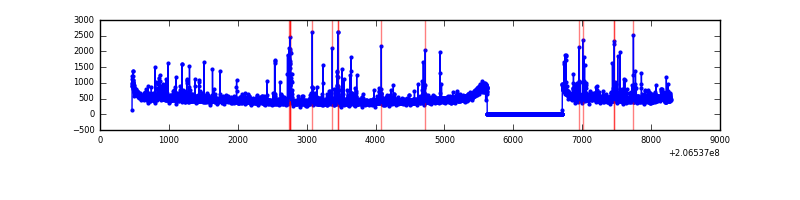 |
Top three noisy pixels from each quadrant. If the there are fewer than three noisy pixels in the level2.evt file, extra rows are filled as -1
| Pixel properties | Quadrant properties | ||||||
|---|---|---|---|---|---|---|---|
| Quadrant | DetID | PixID | Counts | Sigma | Mean | Median | Sigma |
| A | 0 | 13 | 1382548 | 8299.9 | 808 | 790 | 166.5 |
| A | 13 | 251 | 603128 | 3618.11 | 808 | 790 | 166.5 |
| A | 15 | 234 | 50969 | 301.41 | 808 | 790 | 166.5 |
| B | 0 | 187 | 442988 | 2749.06 | 833 | 815 | 160.8 |
| B | 15 | 204 | 158485 | 980.26 | 833 | 815 | 160.8 |
| B | 14 | 167 | 61485 | 377.2 | 833 | 815 | 160.8 |
| C | 9 | 247 | 1173242 | 6320.17 | 793 | 795 | 185.5 |
| C | 9 | 16 | 53804 | 285.75 | 793 | 795 | 185.5 |
| C | 12 | 4 | 25062 | 130.81 | 793 | 795 | 185.5 |
| D | 2 | 136 | 73062 | 369.63 | 809 | 785 | 195.5 |
| D | 13 | 53 | 61389 | 309.93 | 809 | 785 | 195.5 |
| D | 8 | 112 | 42649 | 214.09 | 809 | 785 | 195.5 |
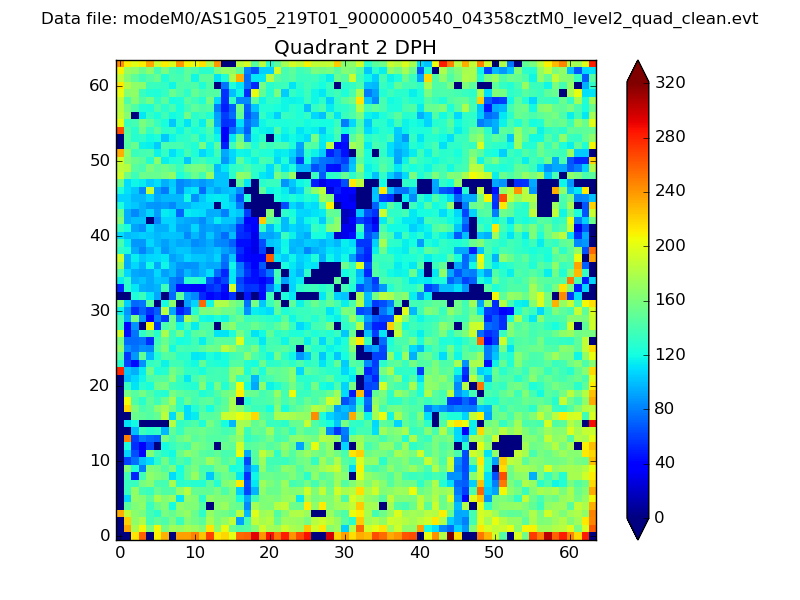
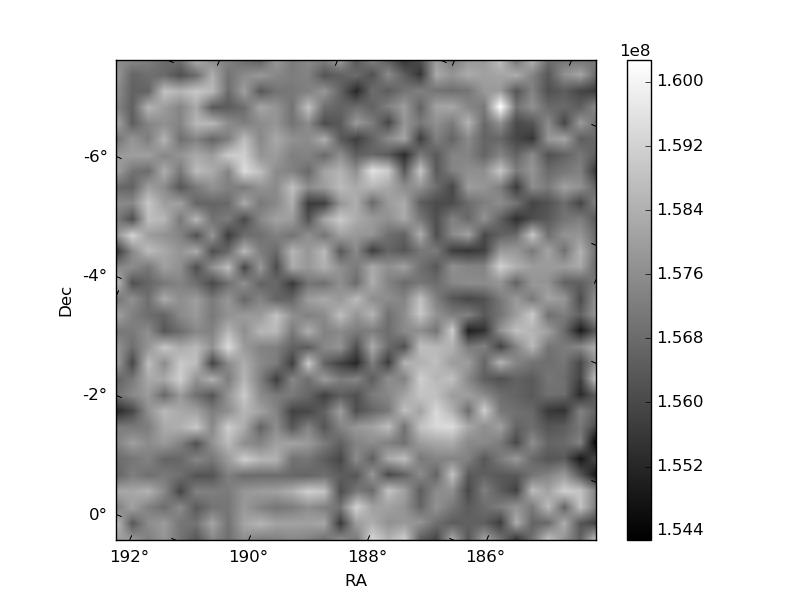
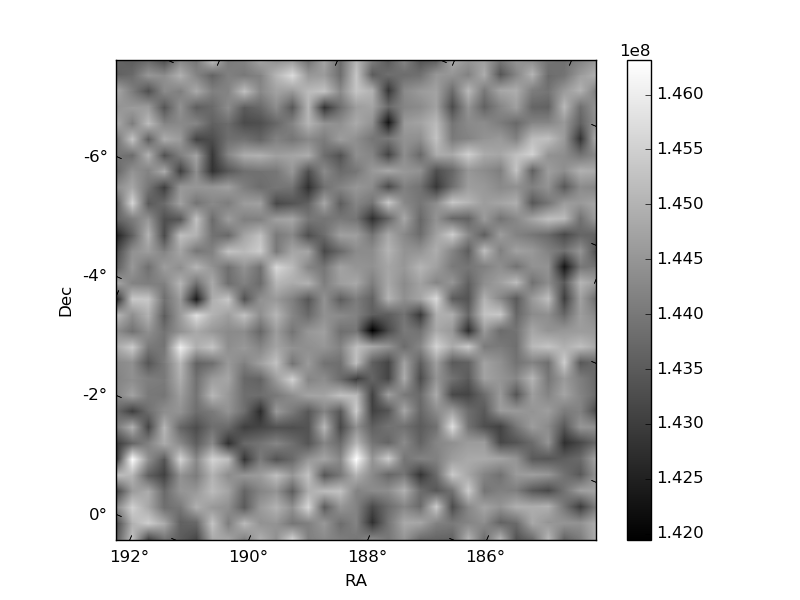
Histogram calculated using DETX and DETY for each event in the final _common_clean file
| Quadrant A |  |
 |
Quadrant B |
|---|---|---|---|
| Quadrant D | 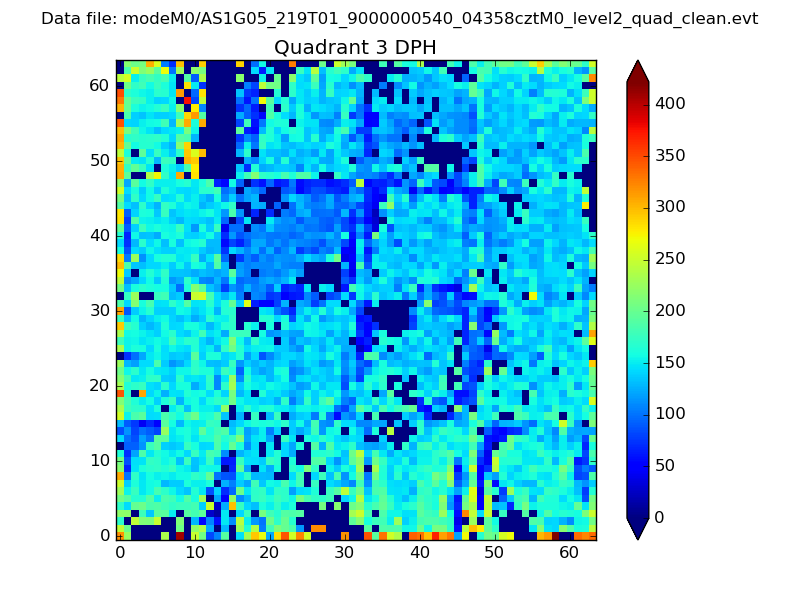 |
 |
Quadrant C |
| Plot type | Count rate plots | Images |
|---|---|---|
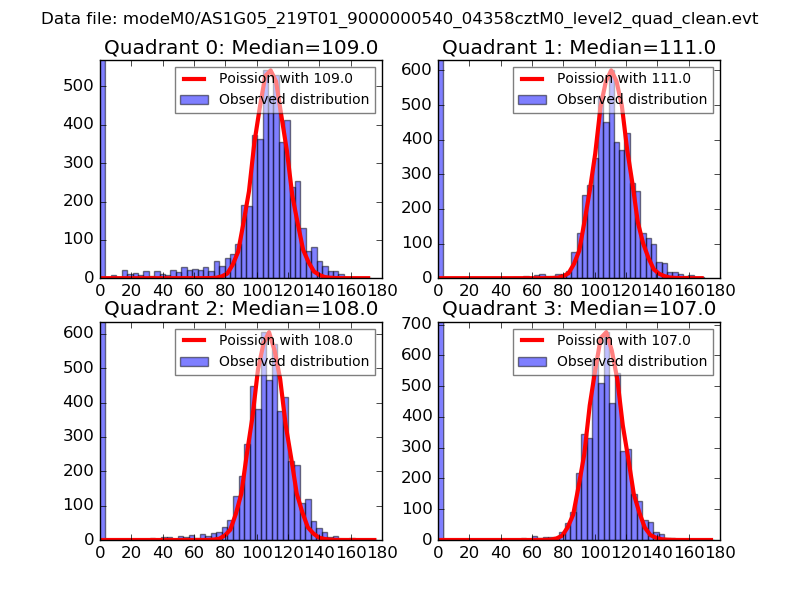
| Comparison with Poisson distribution Blue bars denote a histogram of data divided into 1 sec bins. Red curve is a Poisson curve with rate = median count rate of data. |
 |
 |
| Quadrant-wise count rates Data is divided into 100 sec bins |
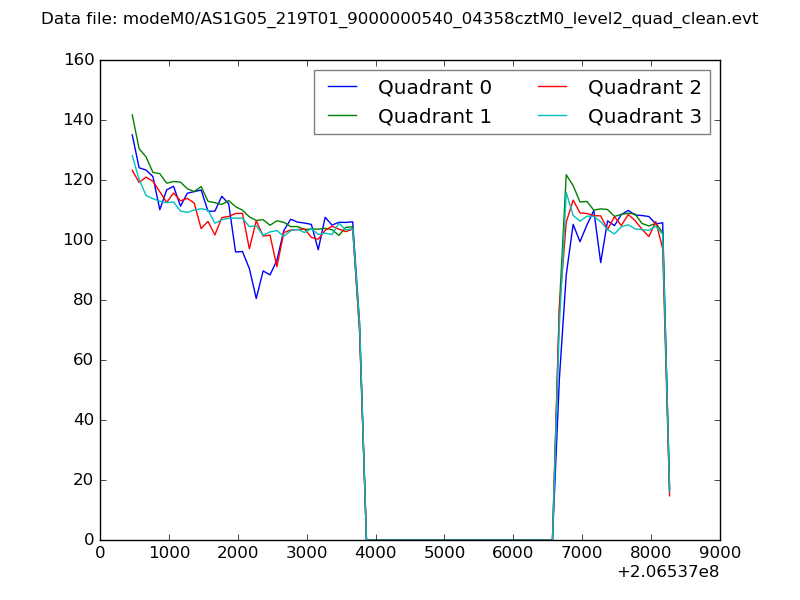 |
|
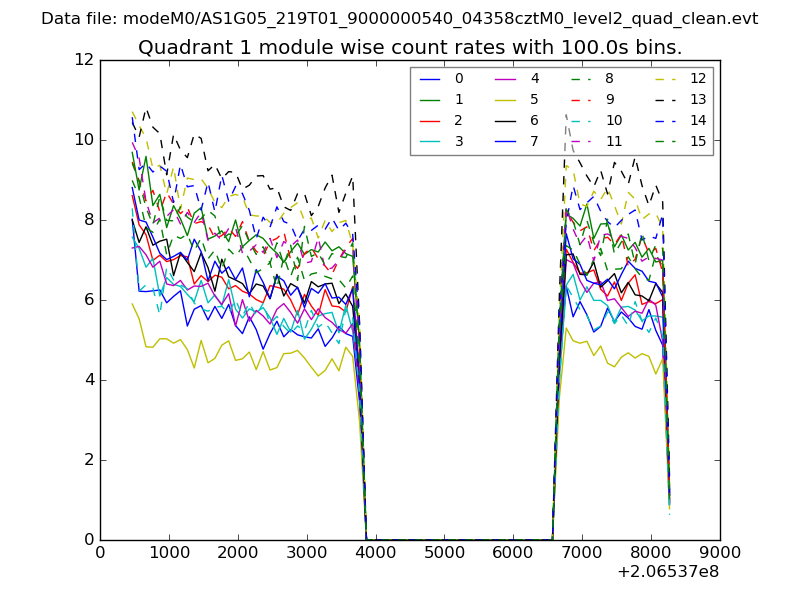
| Module-wise count rates for Quadrant A Data is divided into 100 sec bins |
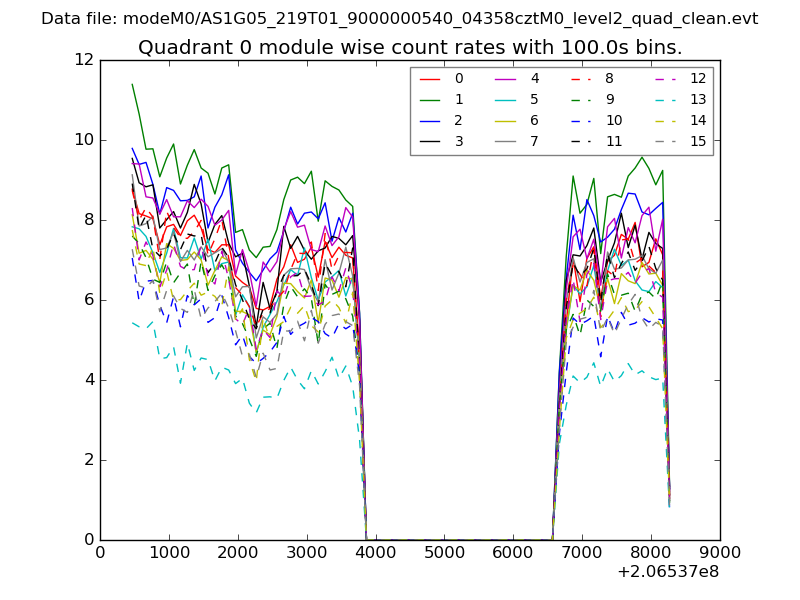 |
 |
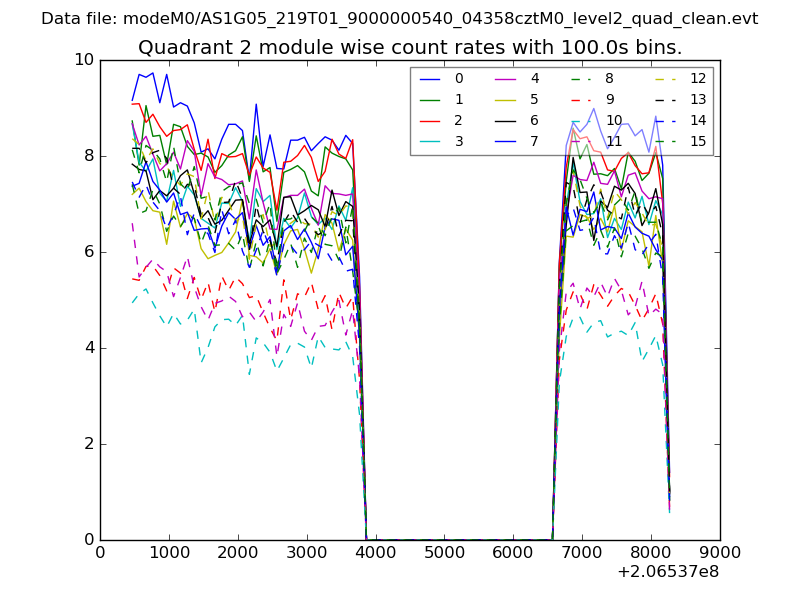
| Module-wise count rates for Quadrant B Data is divided into 100 sec bins |
 |
 |
| Module-wise count rates for Quadrant C Data is divided into 100 sec bins |
 |
 |
| Module-wise count rates for Quadrant D Data is divided into 100 sec bins |
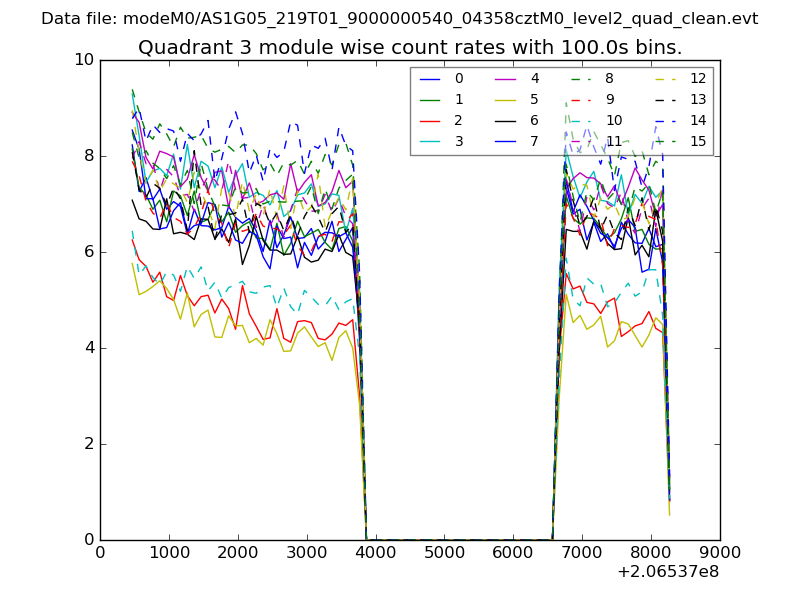 |
 |
| Parameter | Plot |
|---|---|
| CZT HV Monitor | 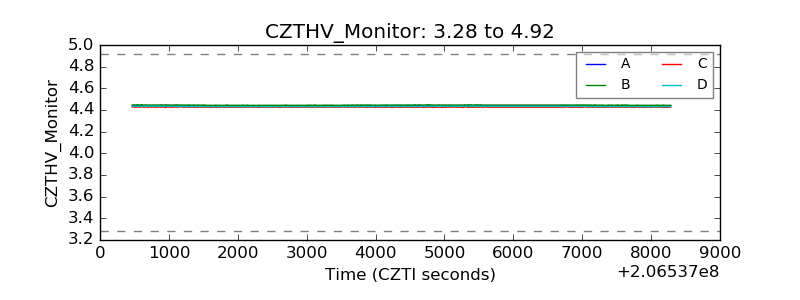 |
| D_VDD | 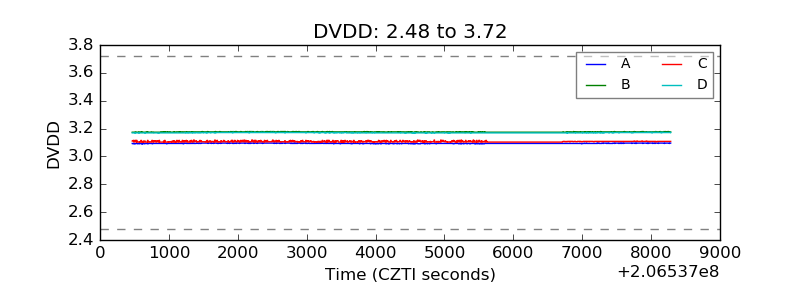 |
| Temperature 1 | 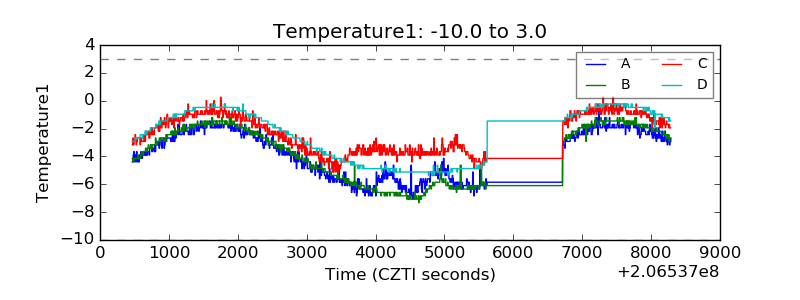 |
| Veto HV Monitor | 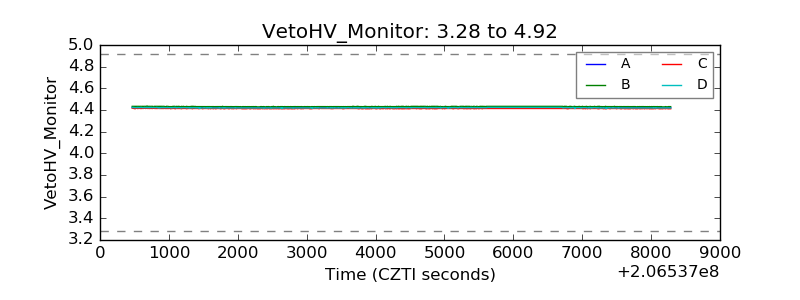 |
| Veto LLD | 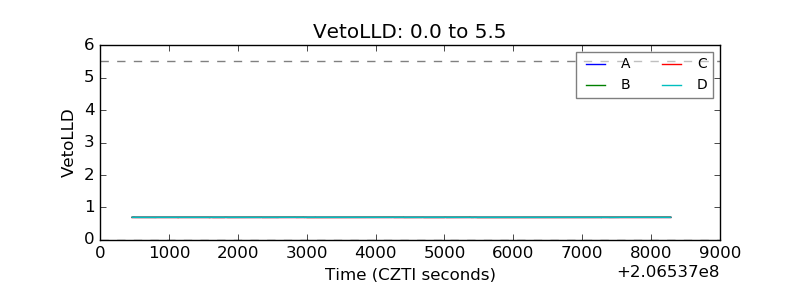 |
| Alpha Counter | 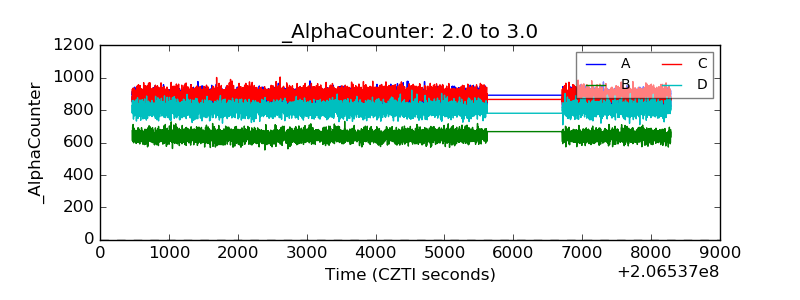 |
| _CPM_Rate | 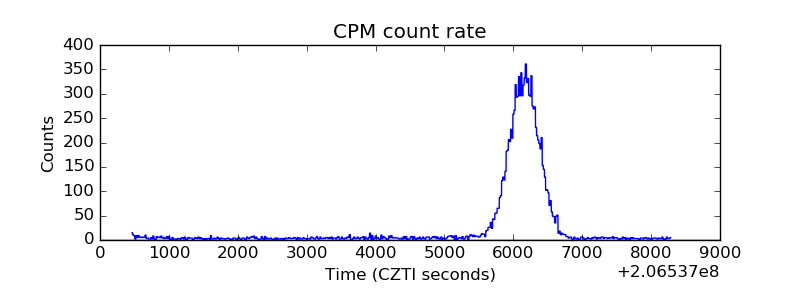 |
| CZT Counter | 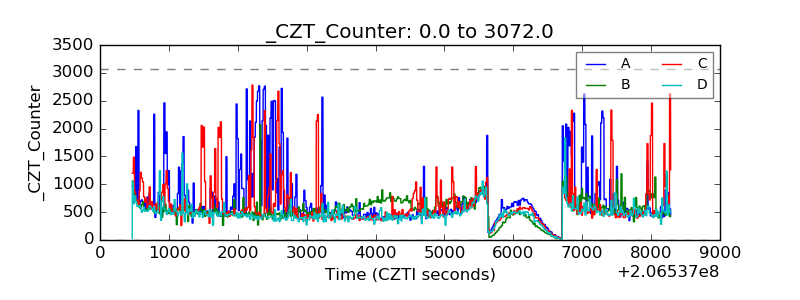 |
| +2.5 Volts monitor | 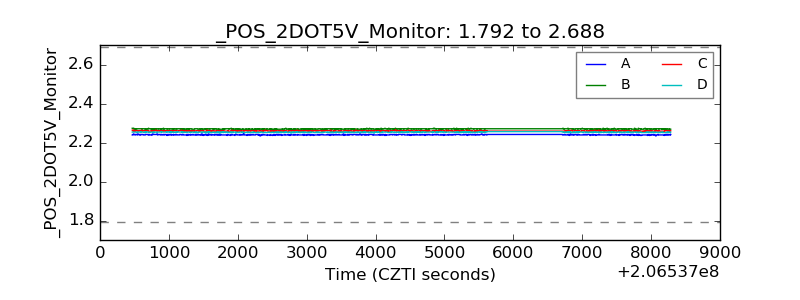 |
| +5 Volts monitor |  |
| _ROLL_ROT | 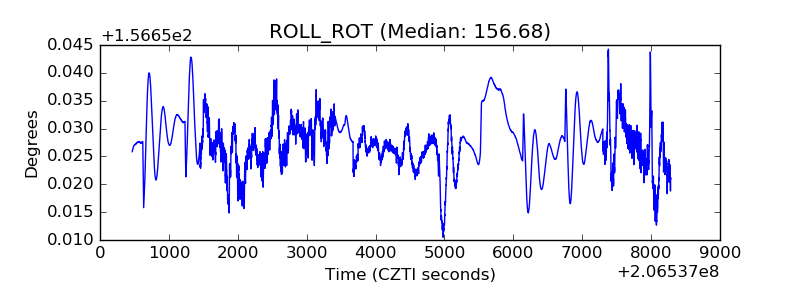 |
| _Roll_DEC | 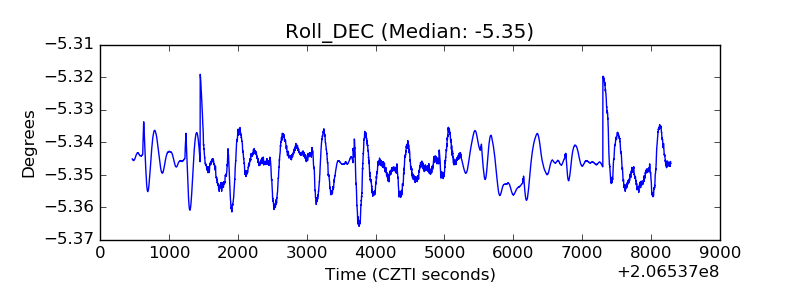 |
| _Roll_RA | 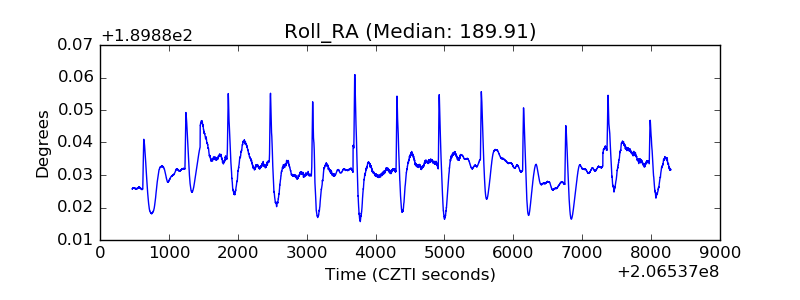 |
| Veto Counter | 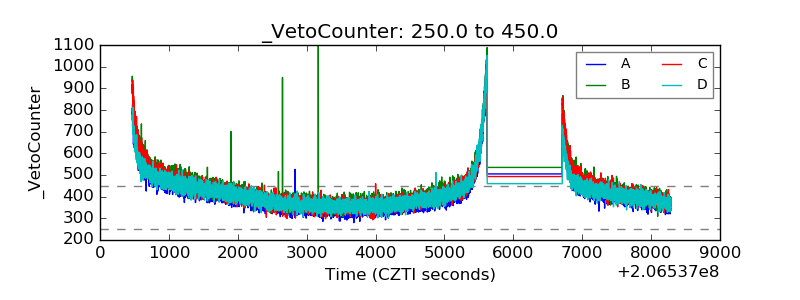 |