| Param | Original file | Final file |
|---|---|---|
| Filename | modeM0/AS1G05_219T01_9000000540_04359cztM0_level2.evt | modeM0/AS1G05_219T01_9000000540_04359cztM0_level2_quad_clean.evt |
| Size (bytes) | 150,966,720 | 30,464,640 |
| Size | 144.0 MB | 29.1 MB |
| Events in quadrant A | 1,321,795 | 194,970 |
| Events in quadrant B | 1,102,480 | 200,475 |
| Events in quadrant C | 1,030,181 | 195,399 |
| Events in quadrant D | 987,490 | 194,146 |
| Mode SS | |||
|---|---|---|---|
| Quadrant | BADHDUFLAG | Total packets | Discarded packets |
| A | 0 | 40 | 0 |
| B | 0 | 40 | 2 |
| C | 0 | 40 | 0 |
| D | 0 | 40 | 4 |
| Mode M0 | |||
|---|---|---|---|
| Quadrant | BADHDUFLAG | Total packets | Discarded packets |
| A | 0 | 5440 | 271 |
| B | 0 | 4688 | 234 |
| C | 0 | 4689 | 376 |
| D | 0 | 4330 | 234 |
| Quadrant | Total seconds | Saturated seconds | Saturation percentage |
|---|---|---|---|
| A | 1873 | 138 | 7.367859% |
| B | 1872 | 5 | 0.267094% |
| C | 1873 | 41 | 2.189002% |
| D | 1875 | 6 | 0.320000% |
Noise dominated data is calculated using 1-second bins in cleaned event files. If a bin has >2000 counts, and if more than 50% of those come from <1% of pixels, then it is considered to be noise-dominated and hence unusable.
| Quadrant | # 1 sec bins | Bins with >0 counts | Bins with >2000 counts | High rate bins dominated by noise | Noise dominated (total time) | Noise dominated (detector-on time) | Marked lightcurve |
|---|---|---|---|---|---|---|---|
| A | 1978 | 1932 | 90 | 90 | 4.55% | 4.66% |  |
| B | 1977 | 1940 | 2 | 2 | 0.10% | 0.10% |  |
| C | 1978 | 1925 | 33 | 33 | 1.67% | 1.71% |  |
| D | 1978 | 1938 | 5 | 5 | 0.25% | 0.26% | 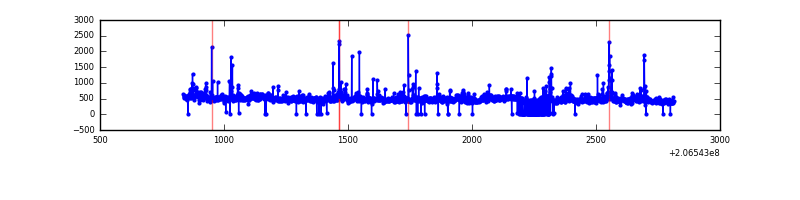 |
Top three noisy pixels from each quadrant. If the there are fewer than three noisy pixels in the level2.evt file, extra rows are filled as -1
| Pixel properties | Quadrant properties | ||||||
|---|---|---|---|---|---|---|---|
| Quadrant | DetID | PixID | Counts | Sigma | Mean | Median | Sigma |
| A | 0 | 13 | 441802 | 9695.54 | 214 | 209 | 45.5 |
| A | 13 | 251 | 36661 | 800.33 | 214 | 209 | 45.5 |
| A | 3 | 1 | 6761 | 143.85 | 214 | 209 | 45.5 |
| B | 0 | 187 | 101550 | 2286.27 | 218 | 214 | 44.3 |
| B | 15 | 204 | 75815 | 1705.66 | 218 | 214 | 44.3 |
| B | 14 | 167 | 35000 | 784.82 | 218 | 214 | 44.3 |
| C | 9 | 247 | 172581 | 3429.09 | 209 | 210 | 50.3 |
| C | 9 | 16 | 36331 | 718.58 | 209 | 210 | 50.3 |
| C | 12 | 4 | 2646 | 48.46 | 209 | 210 | 50.3 |
| D | 13 | 53 | 58699 | 1090.1 | 215 | 209 | 53.7 |
| D | 2 | 136 | 46123 | 855.72 | 215 | 209 | 53.7 |
| D | 4 | 95 | 9016 | 164.14 | 215 | 209 | 53.7 |
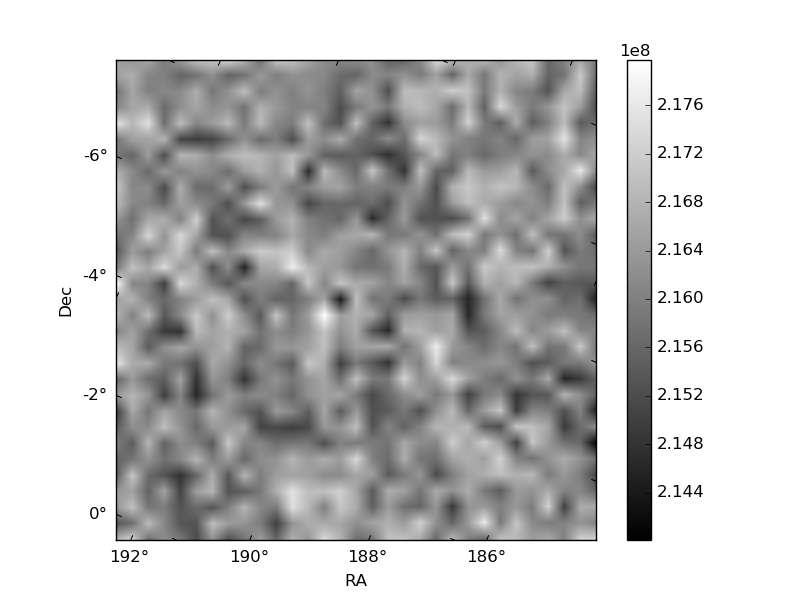
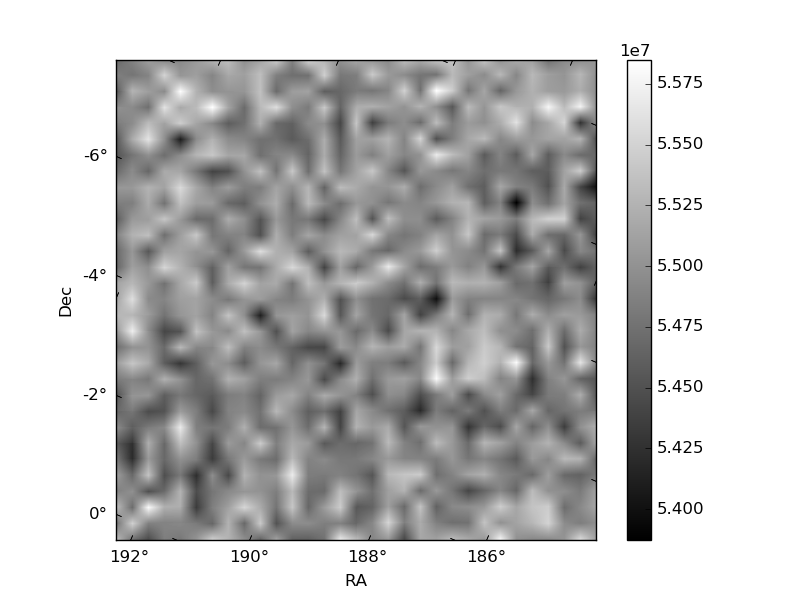
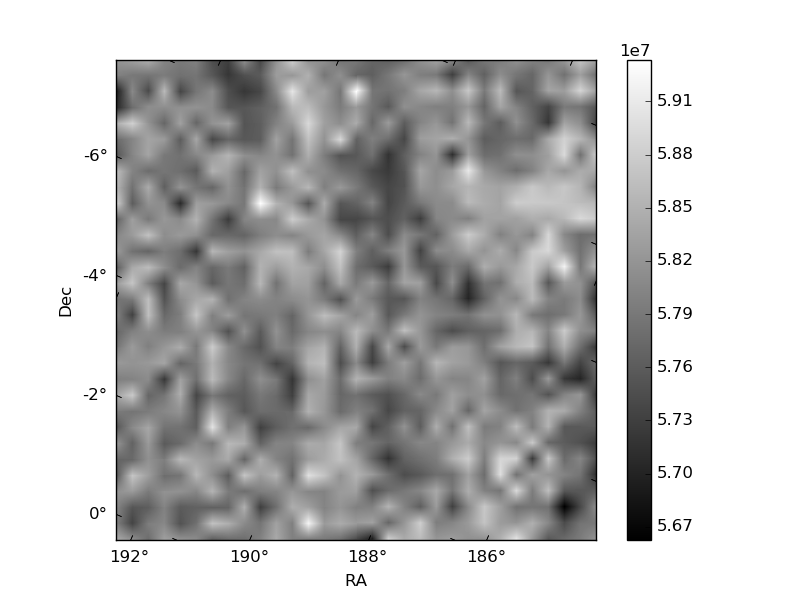
Histogram calculated using DETX and DETY for each event in the final _common_clean file
| Quadrant A |  |
 |
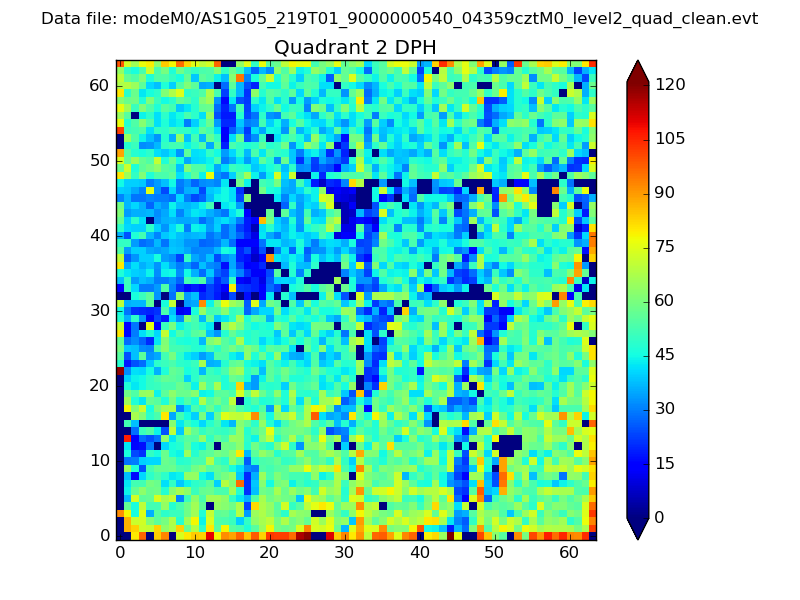
Quadrant B |
|---|---|---|---|
| Quadrant D | 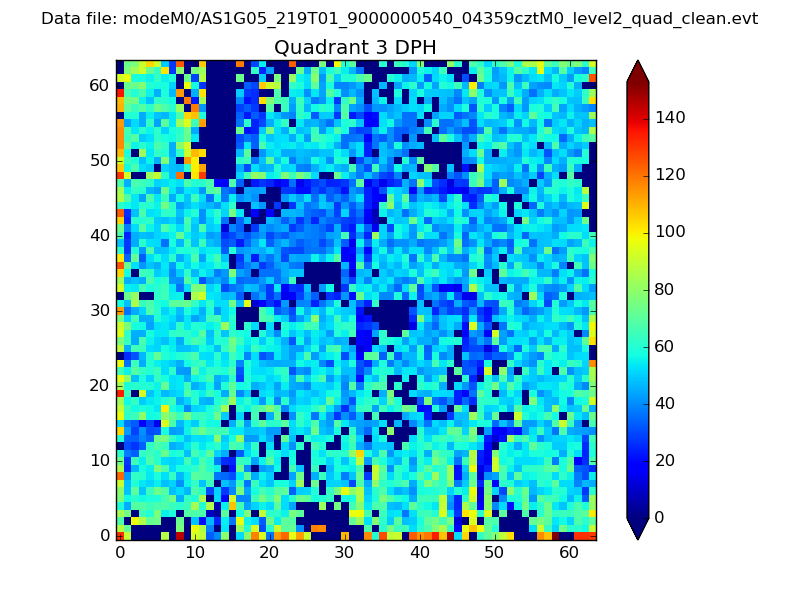 |
 |
Quadrant C |
| Plot type | Count rate plots | Images |
|---|---|---|
| Comparison with Poisson distribution Blue bars denote a histogram of data divided into 1 sec bins. Red curve is a Poisson curve with rate = median count rate of data. |
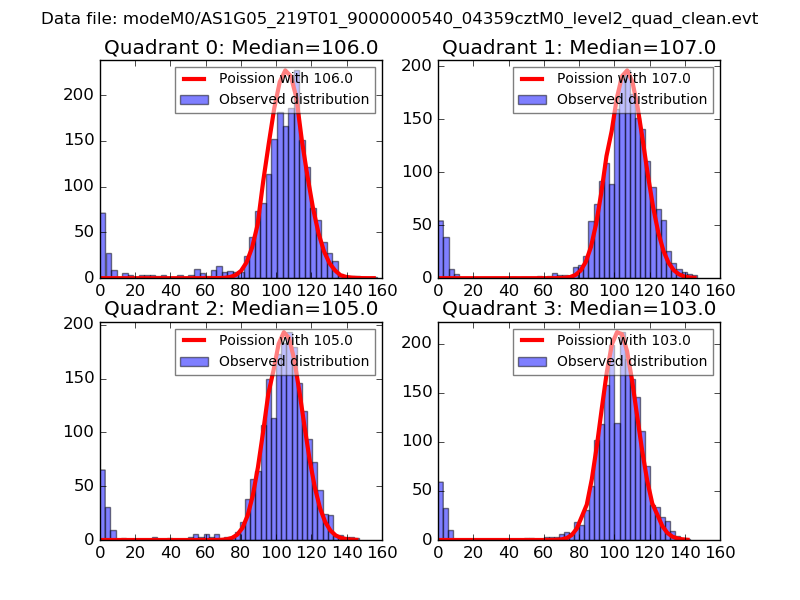 |
 |
| Quadrant-wise count rates Data is divided into 100 sec bins |
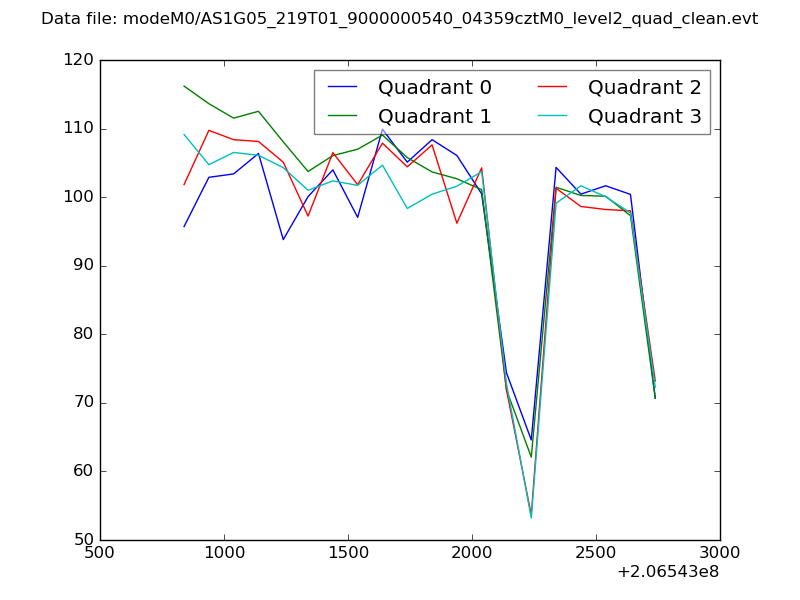 |
|
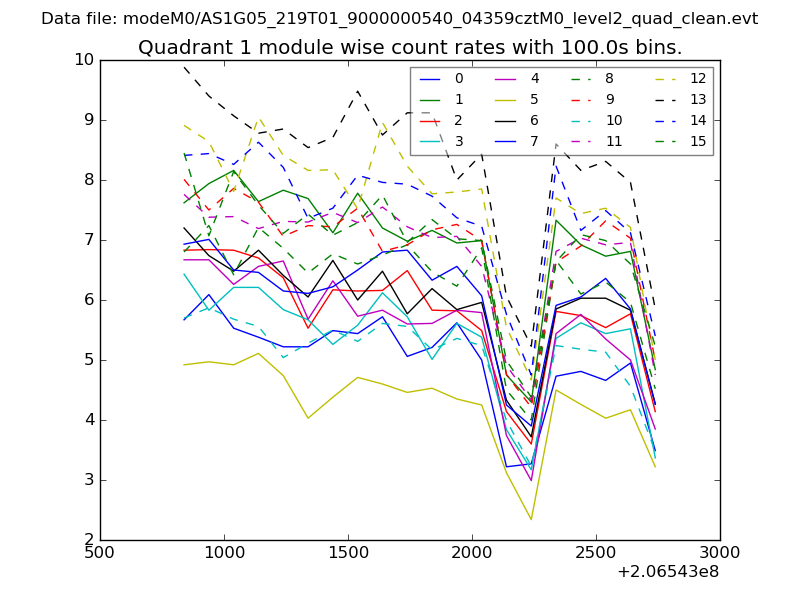
| Module-wise count rates for Quadrant A Data is divided into 100 sec bins |
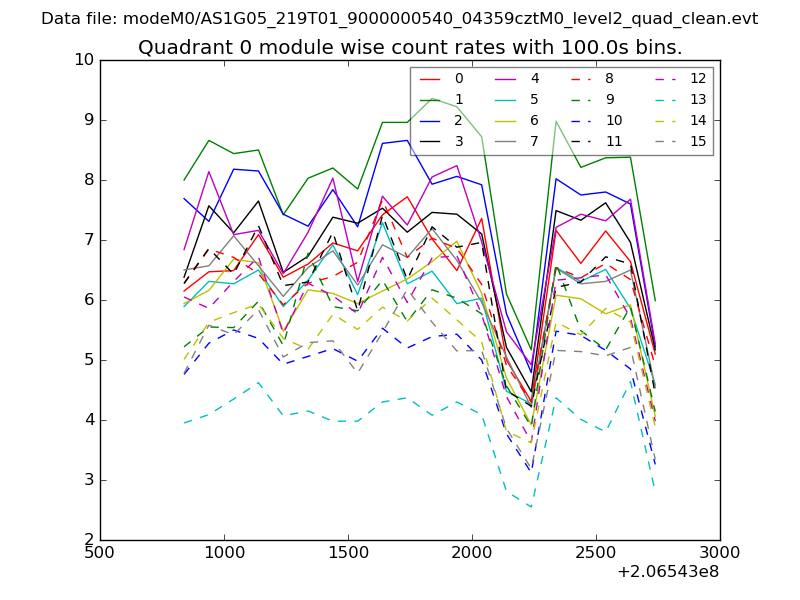 |
 |
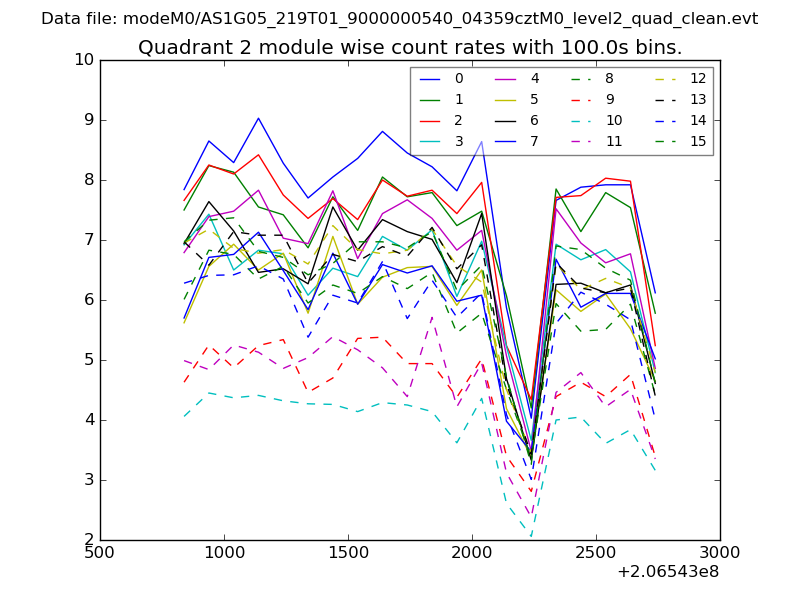
| Module-wise count rates for Quadrant B Data is divided into 100 sec bins |
 |
 |
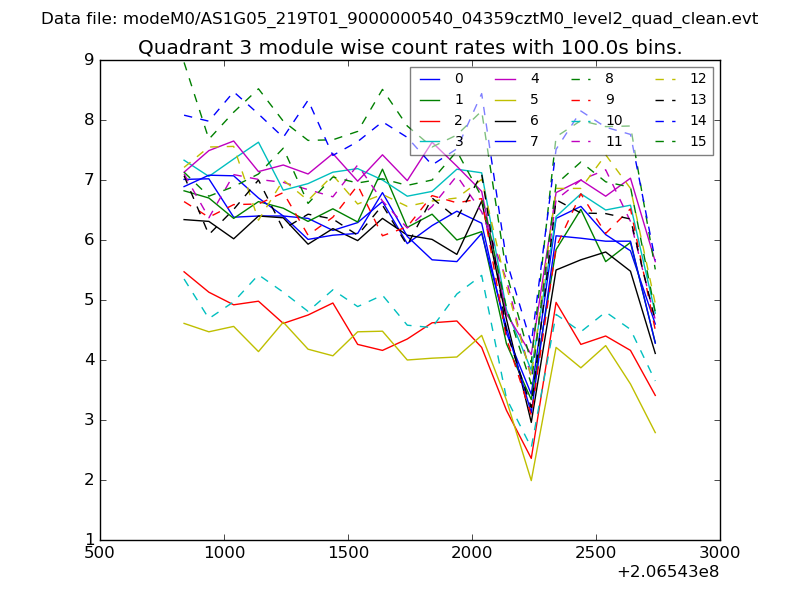
| Module-wise count rates for Quadrant C Data is divided into 100 sec bins |
 |
 |
| Module-wise count rates for Quadrant D Data is divided into 100 sec bins |
 |
 |
| Parameter | Plot |
|---|---|
| CZT HV Monitor | 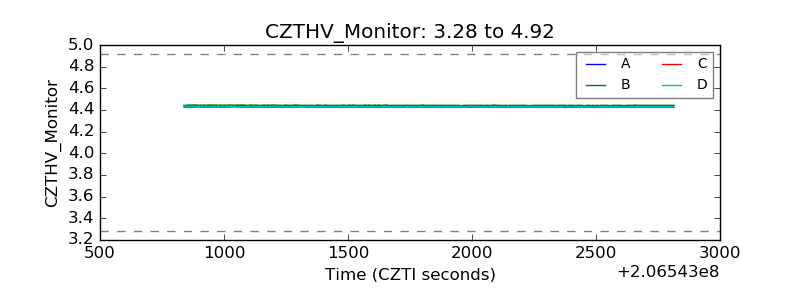 |
| D_VDD | 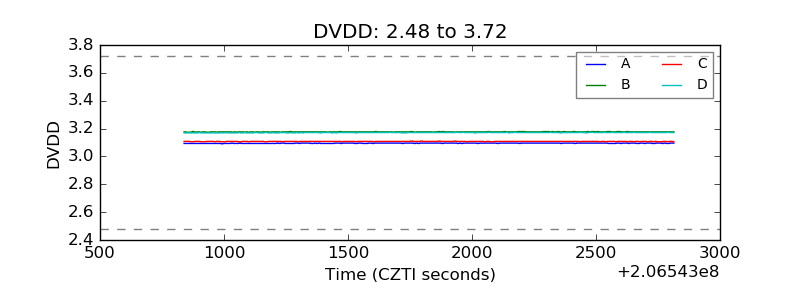 |
| Temperature 1 | 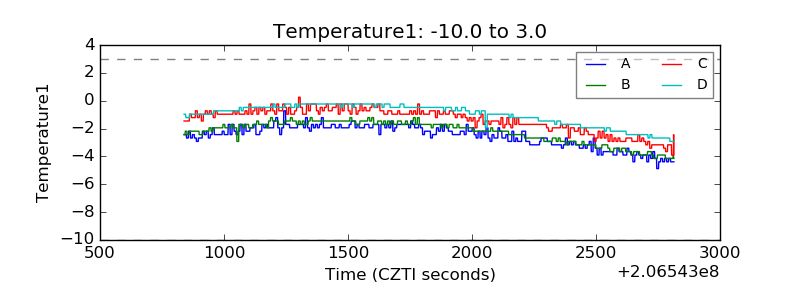 |
| Veto HV Monitor | 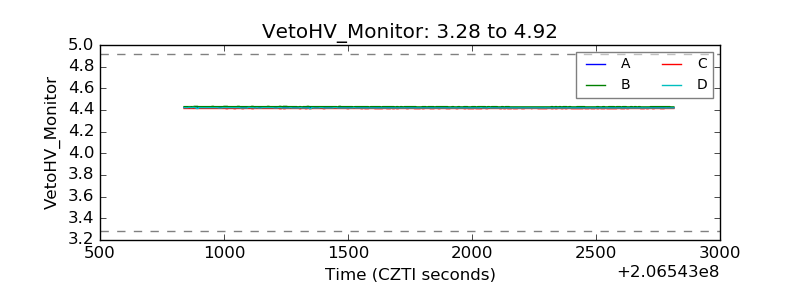 |
| Veto LLD | 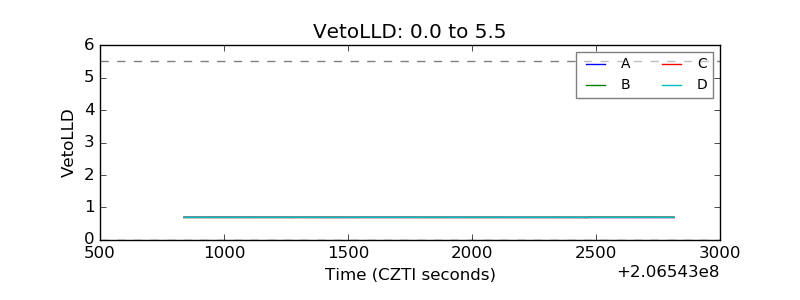 |
| Alpha Counter | 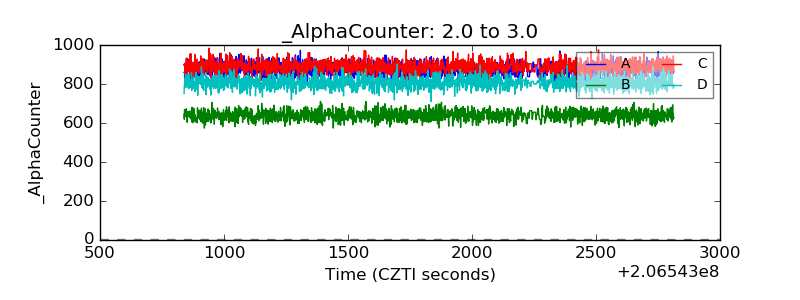 |
| _CPM_Rate | 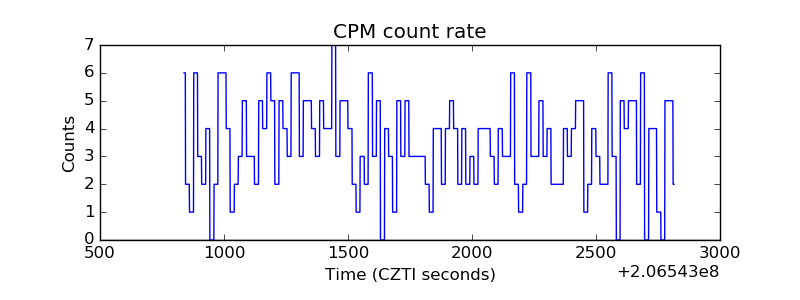 |
| CZT Counter | 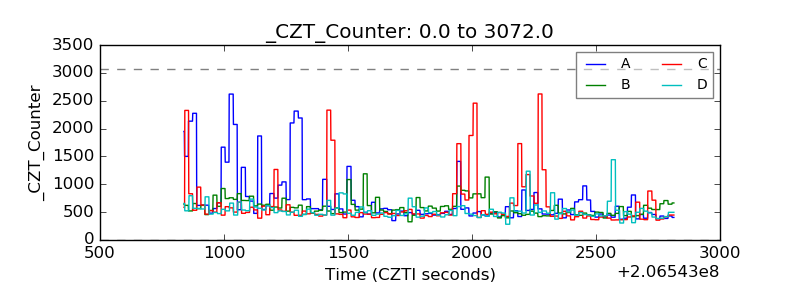 |
| +2.5 Volts monitor | 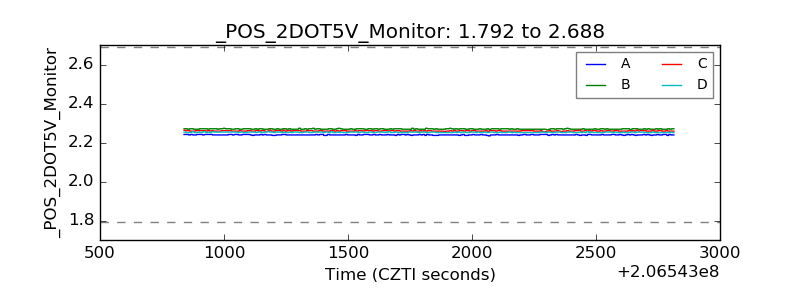 |
| +5 Volts monitor |  |
| _ROLL_ROT | 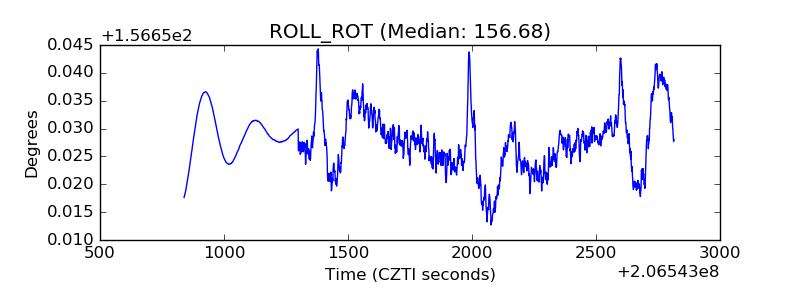 |
| _Roll_DEC | 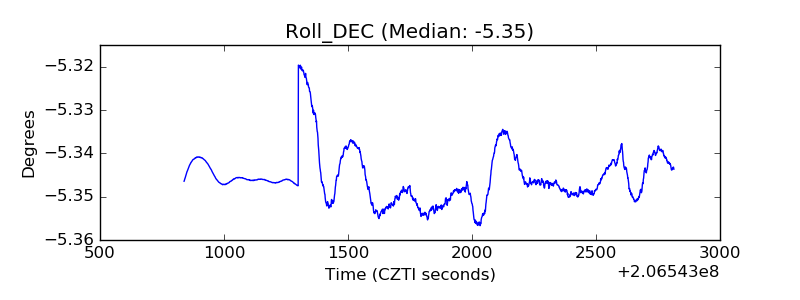 |
| _Roll_RA | 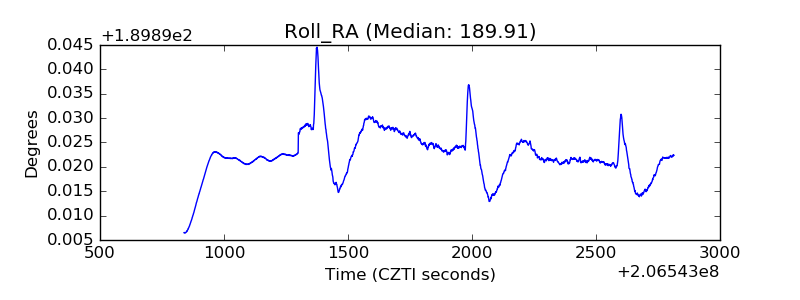 |
| Veto Counter | 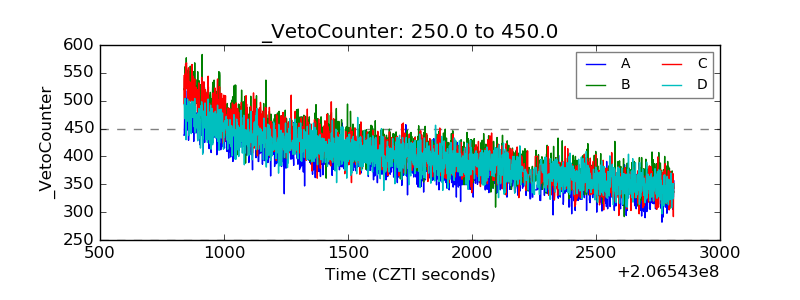 |