| Param | Original file | Final file |
|---|---|---|
| Filename | modeM0/AS1G05_219T01_9000000540_04360cztM0_level2.evt | modeM0/AS1G05_219T01_9000000540_04360cztM0_level2_quad_clean.evt |
| Size (bytes) | 361,365,120 | 35,141,760 |
| Size | 344.6 MB | 33.5 MB |
| Events in quadrant A | 3,498,426 | 195,296 |
| Events in quadrant B | 2,066,884 | 196,685 |
| Events in quadrant C | 2,984,306 | 190,941 |
| Events in quadrant D | 2,113,973 | 190,491 |
| Mode SS | |||
|---|---|---|---|
| Quadrant | BADHDUFLAG | Total packets | Discarded packets |
| A | 0 | 86 | 0 |
| B | 0 | 86 | 0 |
| C | 0 | 86 | 0 |
| D | 0 | 86 | 0 |
| Mode M9 | |||
|---|---|---|---|
| Quadrant | BADHDUFLAG | Total packets | Discarded packets |
| A | 0 | 8 | 0 |
| B | 0 | 8 | 0 |
| C | 0 | 8 | 0 |
| D | 0 | 8 | 0 |
| Mode M0 | |||
|---|---|---|---|
| Quadrant | BADHDUFLAG | Total packets | Discarded packets |
| A | 0 | 13200 | 1 |
| B | 0 | 8893 | 1 |
| C | 0 | 11826 | 1 |
| D | 0 | 9269 | 1 |
| Quadrant | Total seconds | Saturated seconds | Saturation percentage |
|---|---|---|---|
| A | 4110 | 501 | 12.189781% |
| B | 4110 | 96 | 2.335766% |
| C | 4110 | 264 | 6.423358% |
| D | 4110 | 96 | 2.335766% |
Noise dominated data is calculated using 1-second bins in cleaned event files. If a bin has >2000 counts, and if more than 50% of those come from <1% of pixels, then it is considered to be noise-dominated and hence unusable.
| Quadrant | # 1 sec bins | Bins with >0 counts | Bins with >2000 counts | High rate bins dominated by noise | Noise dominated (total time) | Noise dominated (detector-on time) | Marked lightcurve |
|---|---|---|---|---|---|---|---|
| A | 4935 | 4110 | 362 | 362 | 7.34% | 8.81% |  |
| B | 4935 | 4110 | 2 | 2 | 0.04% | 0.05% |  |
| C | 4934 | 4109 | 186 | 186 | 3.77% | 4.53% | 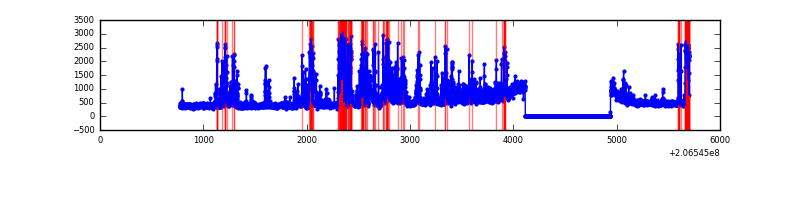 |
| D | 4935 | 4110 | 26 | 26 | 0.53% | 0.63% | 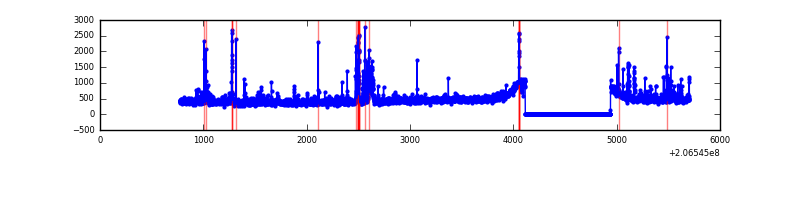 |
Top three noisy pixels from each quadrant. If the there are fewer than three noisy pixels in the level2.evt file, extra rows are filled as -1
| Pixel properties | Quadrant properties | ||||||
|---|---|---|---|---|---|---|---|
| Quadrant | DetID | PixID | Counts | Sigma | Mean | Median | Sigma |
| A | 0 | 13 | 1412488 | 13981.07 | 483 | 473 | 101.0 |
| A | 13 | 251 | 143521 | 1416.39 | 483 | 473 | 101.0 |
| A | 15 | 234 | 25505 | 247.85 | 483 | 473 | 101.0 |
| B | 14 | 167 | 37153 | 366.32 | 506 | 493 | 100.1 |
| B | 4 | 48 | 26060 | 255.48 | 506 | 493 | 100.1 |
| B | 15 | 204 | 18749 | 182.42 | 506 | 493 | 100.1 |
| C | 9 | 247 | 1106262 | 9801.36 | 477 | 481 | 112.8 |
| C | 12 | 4 | 5875 | 47.81 | 477 | 481 | 112.8 |
| C | 9 | 16 | 4722 | 37.59 | 477 | 481 | 112.8 |
| D | 2 | 136 | 106276 | 892.14 | 481 | 467 | 118.6 |
| D | 13 | 223 | 61012 | 510.49 | 481 | 467 | 118.6 |
| D | 4 | 95 | 38530 | 320.93 | 481 | 467 | 118.6 |
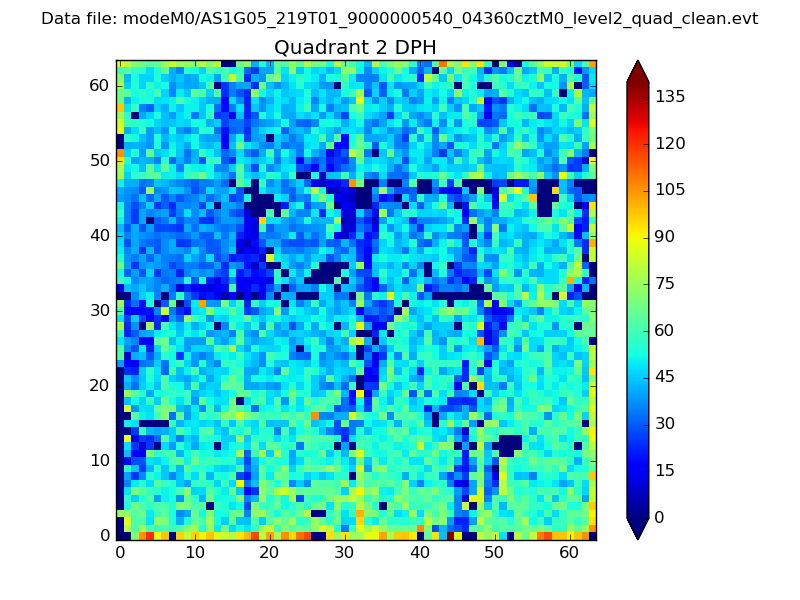
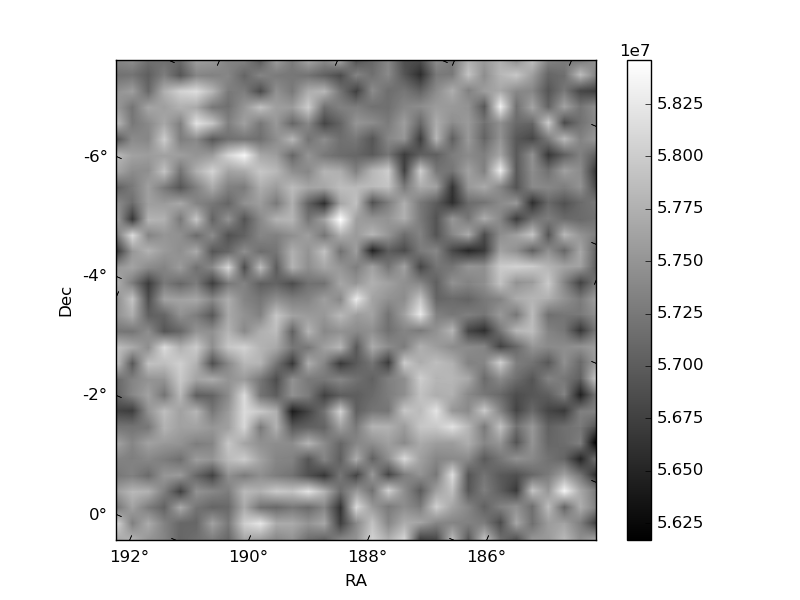
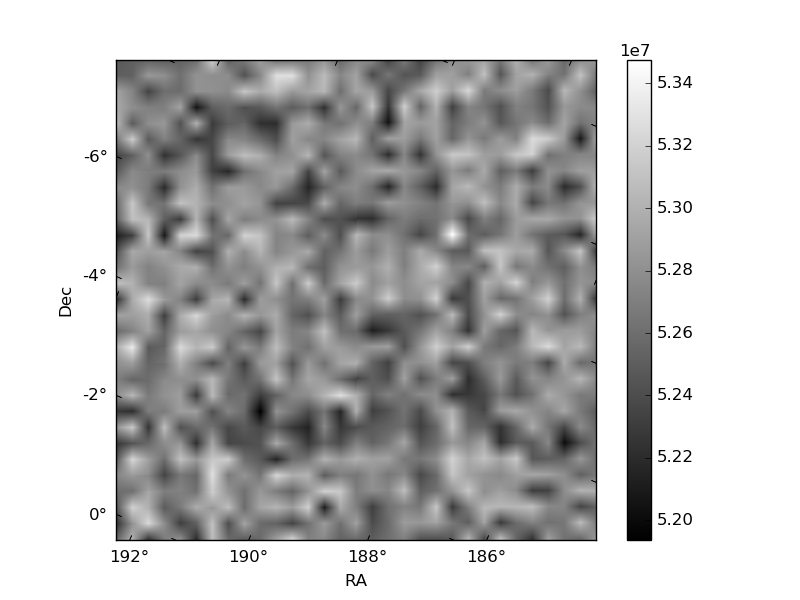
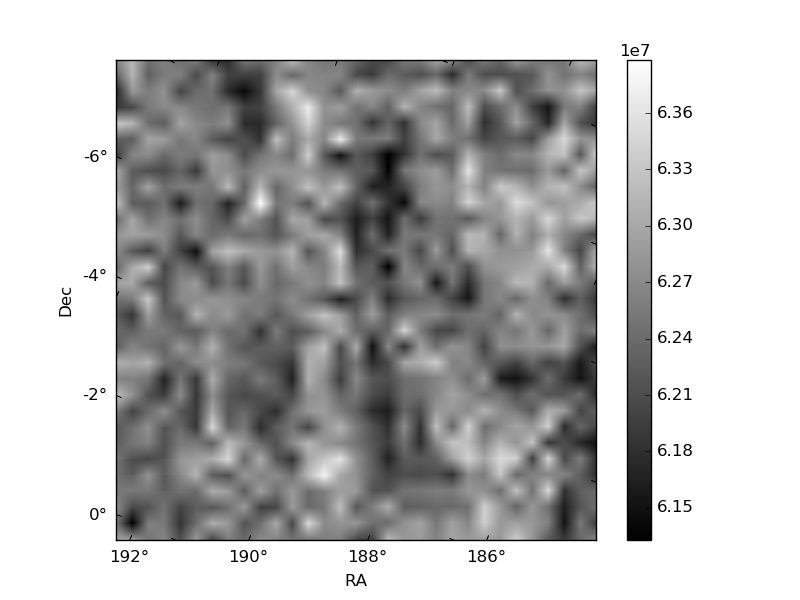
Histogram calculated using DETX and DETY for each event in the final _common_clean file
| Quadrant A | 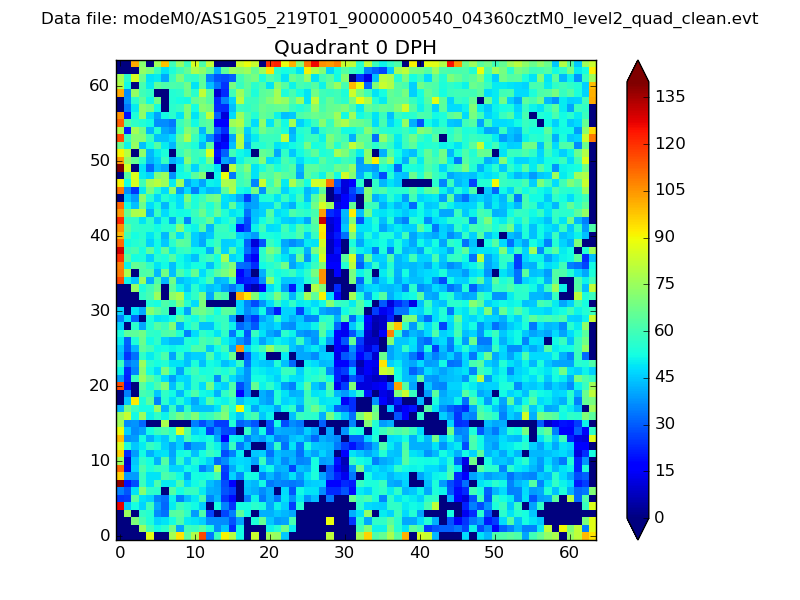 |
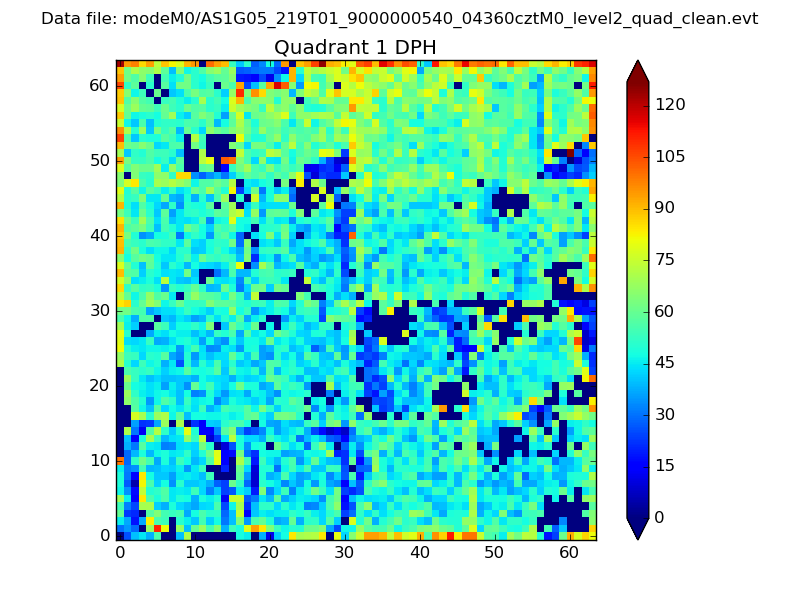 |
Quadrant B |
|---|---|---|---|
| Quadrant D | 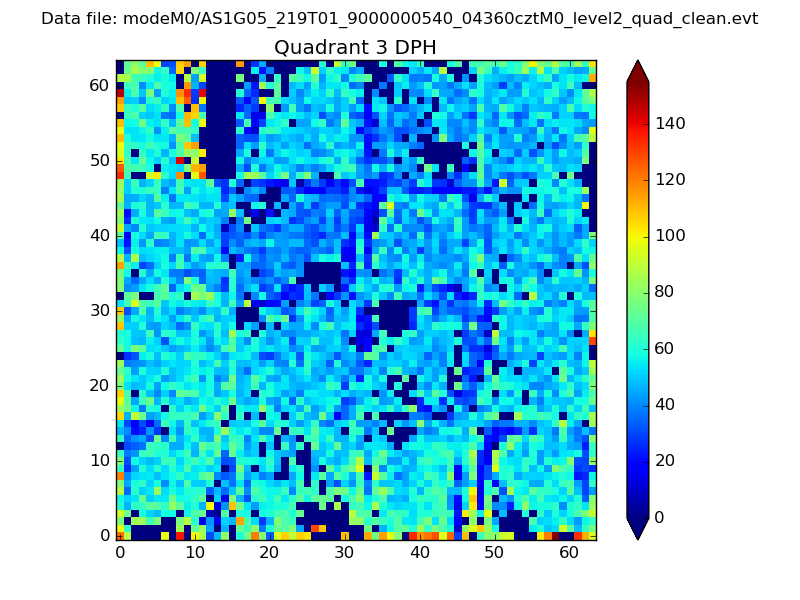 |
 |
Quadrant C |
| Plot type | Count rate plots | Images |
|---|---|---|
| Comparison with Poisson distribution Blue bars denote a histogram of data divided into 1 sec bins. Red curve is a Poisson curve with rate = median count rate of data. |
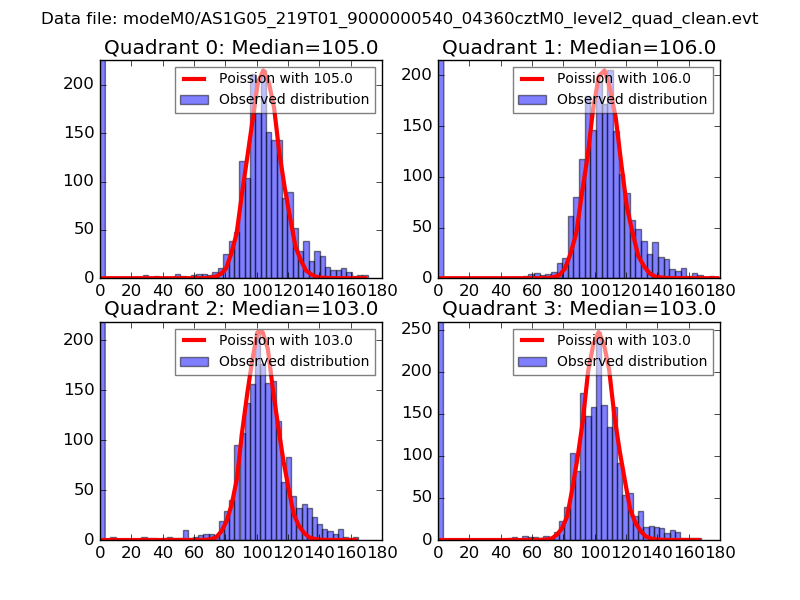 |
 |
| Quadrant-wise count rates Data is divided into 100 sec bins |
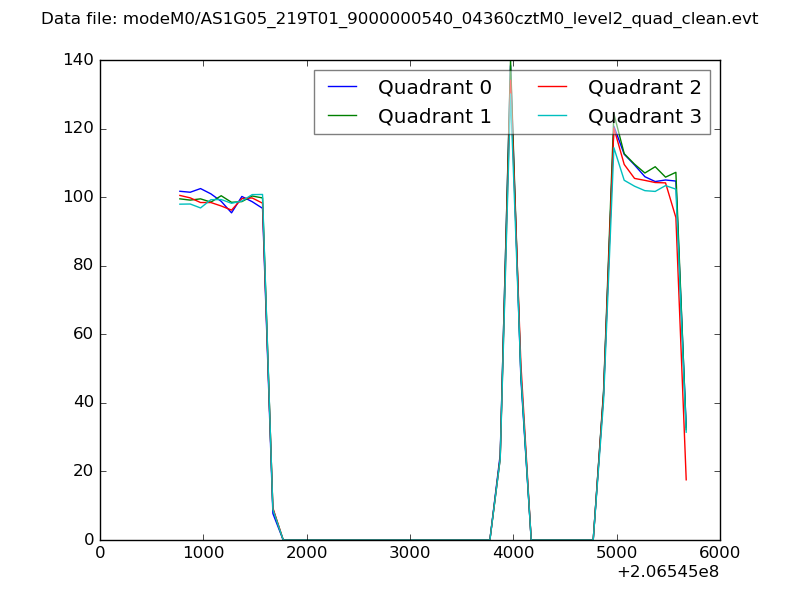 |
|
| Module-wise count rates for Quadrant A Data is divided into 100 sec bins |
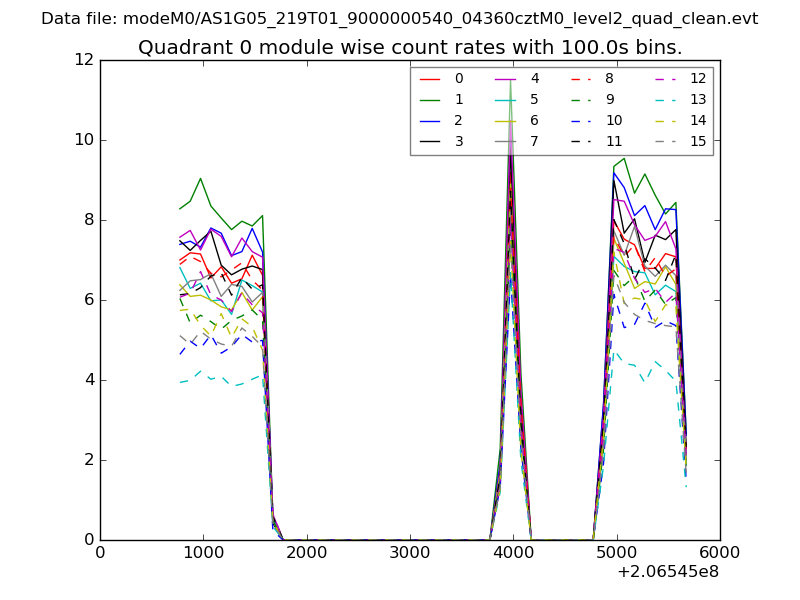 |
 |
| Module-wise count rates for Quadrant B Data is divided into 100 sec bins |
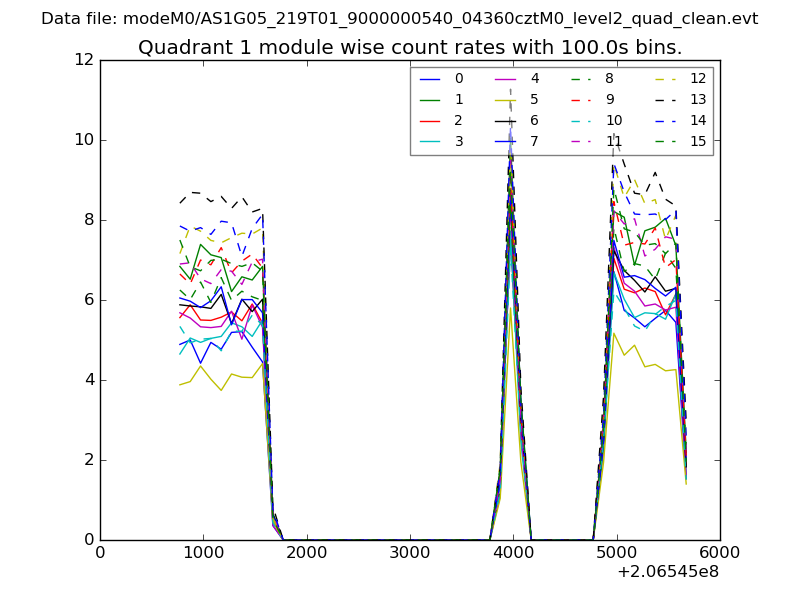 |
 |
| Module-wise count rates for Quadrant C Data is divided into 100 sec bins |
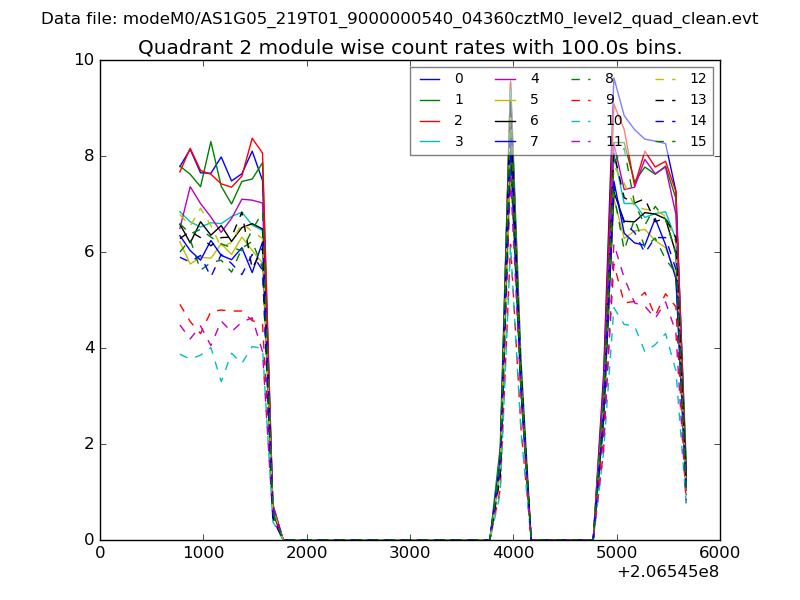 |
 |
| Module-wise count rates for Quadrant D Data is divided into 100 sec bins |
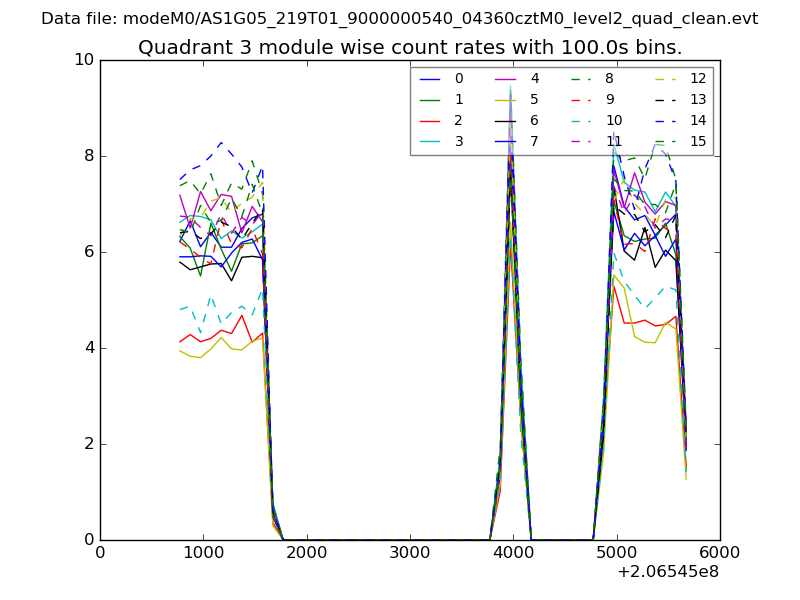 |
 |
| Parameter | Plot |
|---|---|
| CZT HV Monitor | 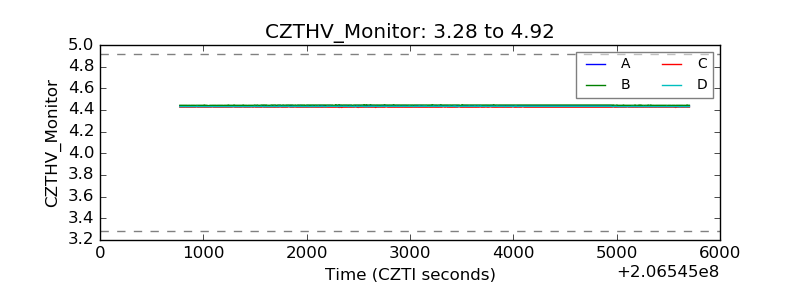 |
| D_VDD | 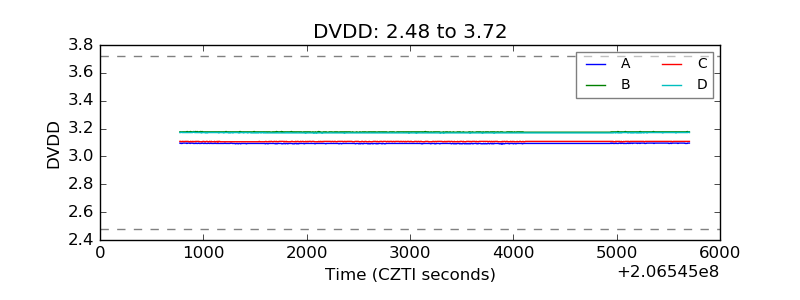 |
| Temperature 1 | 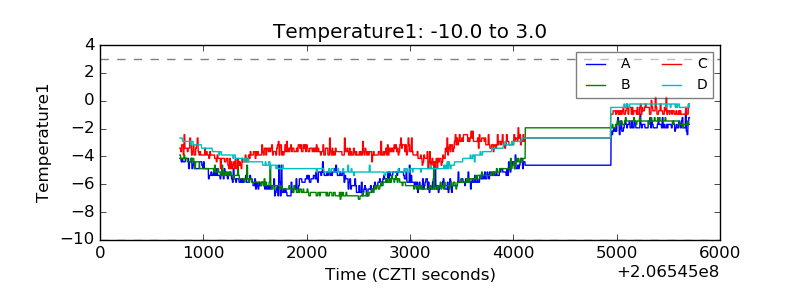 |
| Veto HV Monitor | 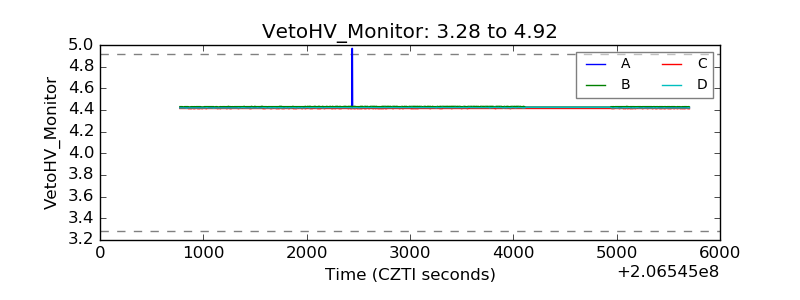 |
| Veto LLD | 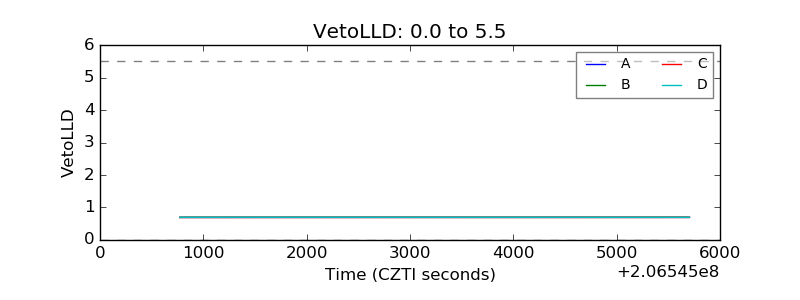 |
| Alpha Counter | 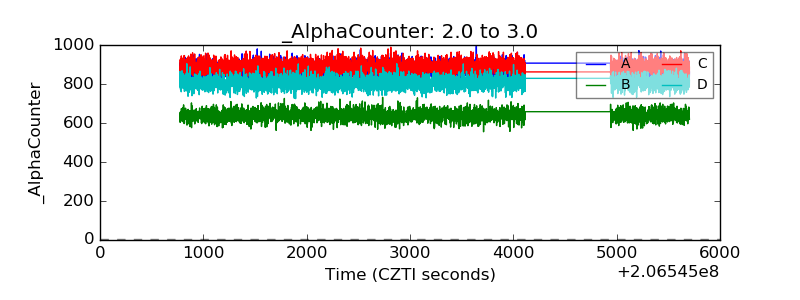 |
| _CPM_Rate | 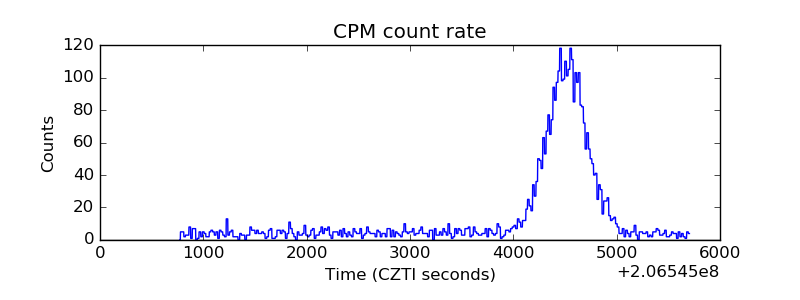 |
| CZT Counter | 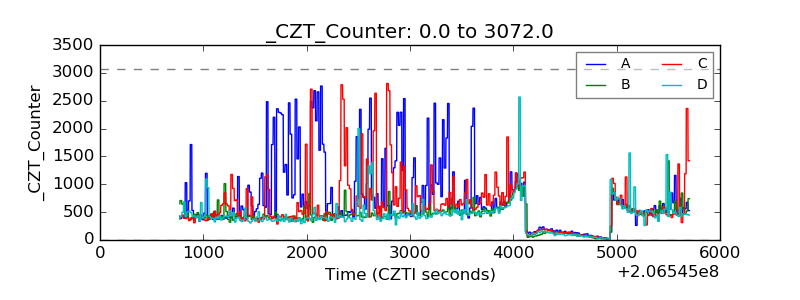 |
| +2.5 Volts monitor | 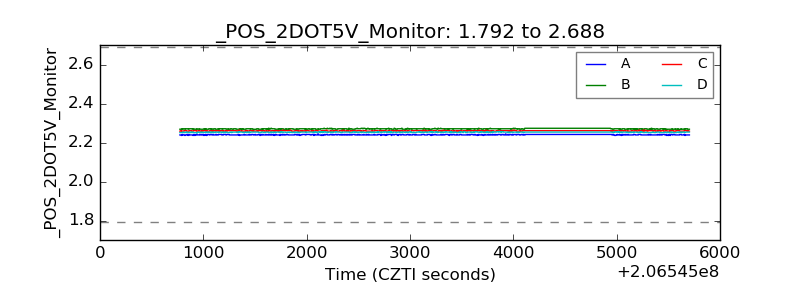 |
| +5 Volts monitor |  |
| _ROLL_ROT | 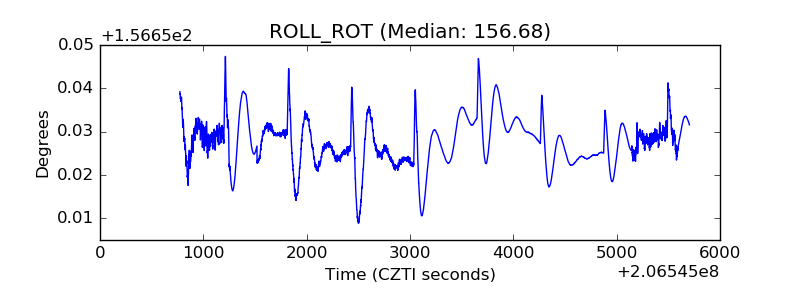 |
| _Roll_DEC | 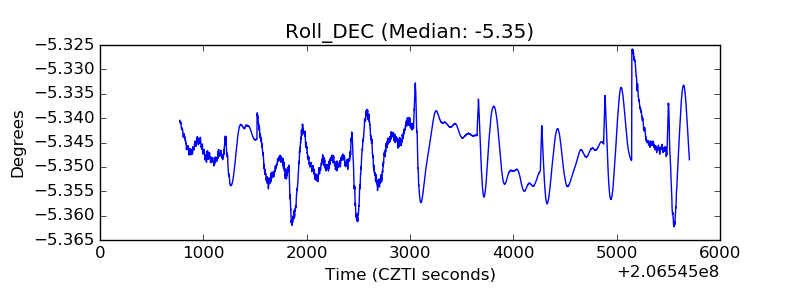 |
| _Roll_RA | 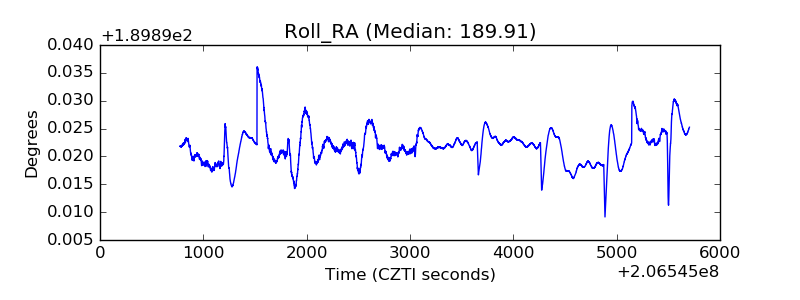 |
| Veto Counter | 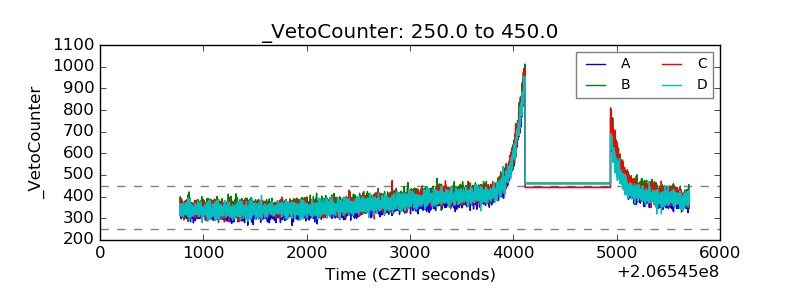 |