| Param | Original file | Final file |
|---|---|---|
| Filename | modeM0/AS1G05_167T01_9000000542cztM0_level2.fits | modeM0/AS1G05_167T01_9000000542cztM0_level2_quad_clean.evt |
| Size (bytes) | 197,081,280 | 214,784,640 |
| Size | 188.0 MB | 204.8 MB |
| Events in quadrant A | 1,177,384 | 1,319,126 |
| Events in quadrant B | 1,143,502 | 1,311,243 |
| Events in quadrant C | 1,139,720 | 1,218,126 |
| Events in quadrant D | 1,002,340 | 1,150,811 |
| Mode M0 | |||
|---|---|---|---|
| Quadrant | BADHDUFLAG | Total packets | Discarded packets |
| A | 0 | 46784 | 0 |
| B | 0 | 45830 | 0 |
| C | 0 | 53643 | 0 |
| D | 0 | 47956 | 0 |
| Mode M9 | |||
|---|---|---|---|
| Quadrant | BADHDUFLAG | Total packets | Discarded packets |
| A | 0 | 10 | 0 |
| B | 0 | 10 | 0 |
| C | 0 | 10 | 0 |
| D | 0 | 10 | 0 |
| Mode SS | |||
|---|---|---|---|
| Quadrant | BADHDUFLAG | Total packets | Discarded packets |
| A | 0 | 448 | 0 |
| B | 0 | 448 | 0 |
| C | 0 | 448 | 0 |
| D | 0 | 448 | 0 |
| Quadrant | Total seconds | Saturated seconds | Saturation percentage |
|---|---|---|---|
| A | 21861 | 297 | 1.358584% |
| B | 21861 | 287 | 1.312840% |
| C | 21859 | 735 | 3.362459% |
| D | 21858 | 368 | 1.683594% |
Noise dominated data is calculated using 1-second bins in cleaned event files. If a bin has >2000 counts, and if more than 50% of those come from <1% of pixels, then it is considered to be noise-dominated and hence unusable.
| Quadrant | # 1 sec bins | Bins with >0 counts | Bins with >2000 counts | High rate bins dominated by noise | Noise dominated (total time) | Noise dominated (detector-on time) | Marked lightcurve |
|---|---|---|---|---|---|---|---|
| A | 22727 | 21863 | 0 | 0 | 0.00% | 0.00% | 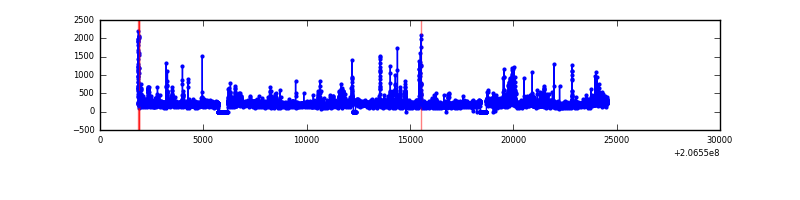 |
| B | 22727 | 21864 | 0 | 0 | 0.00% | 0.00% | 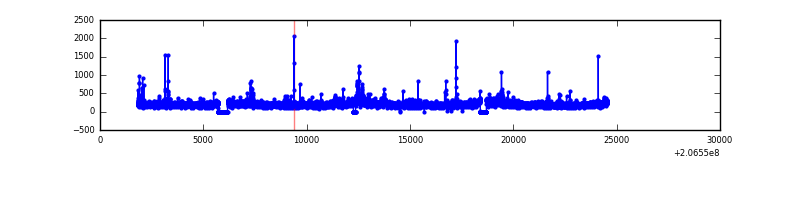 |
| C | 22727 | 21862 | 0 | 0 | 0.00% | 0.00% | 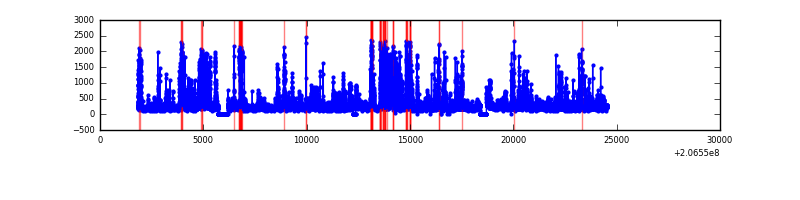 |
| D | 22726 | 21859 | 0 | 0 | 0.00% | 0.00% | 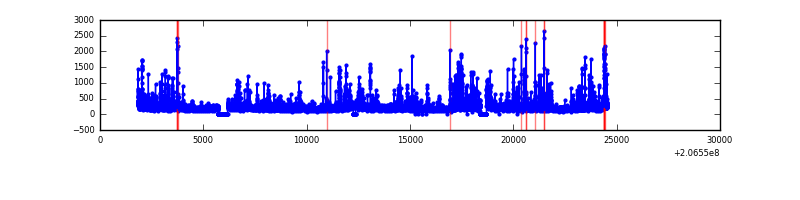 |
Top three noisy pixels from each quadrant. If the there are fewer than three noisy pixels in the level2.evt file, extra rows are filled as -1
| Pixel properties | Quadrant properties | ||||||
|---|---|---|---|---|---|---|---|
| Quadrant | DetID | PixID | Counts | Sigma | Mean | Median | Sigma |
| A | 0 | 29 | 1220 | 11.46 | 305 | 284 | 81.7 |
| A | 14 | 188 | 1125 | 10.3 | 305 | 284 | 81.7 |
| A | 14 | 204 | 1027 | 9.1 | 305 | 284 | 81.7 |
| B | 2 | 9 | 1010 | 11.13 | 301 | 284 | 65.2 |
| B | 12 | 226 | 824 | 8.28 | 301 | 284 | 65.2 |
| B | 14 | 254 | 806 | 8.01 | 301 | 284 | 65.2 |
| C | 1 | 81 | 880 | 7.16 | 301 | 278 | 84.0 |
| C | 1 | 80 | 871 | 7.06 | 301 | 278 | 84.0 |
| C | 1 | 65 | 772 | 5.88 | 301 | 278 | 84.0 |
| D | 11 | 82 | 868 | 7.65 | 285 | 258 | 79.8 |
| D | 1 | 19 | 763 | 6.33 | 285 | 258 | 79.8 |
| D | 6 | 231 | 756 | 6.24 | 285 | 258 | 79.8 |
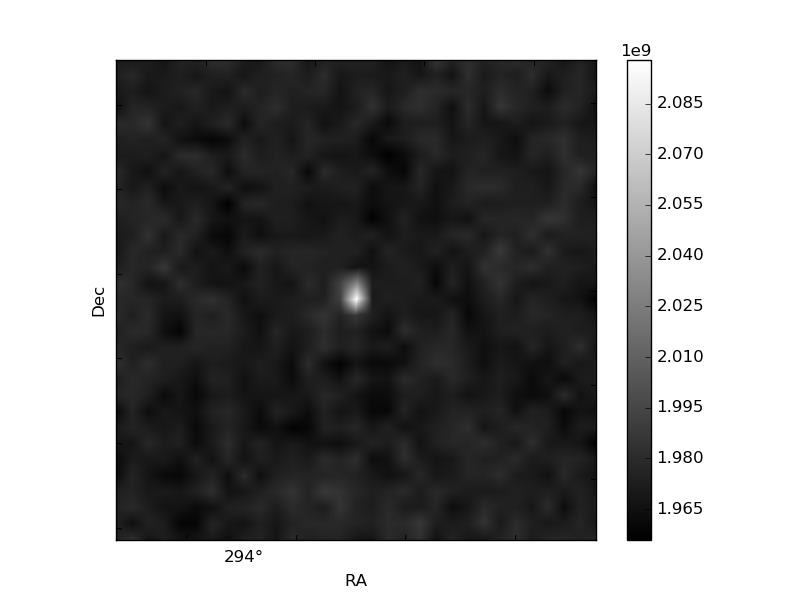
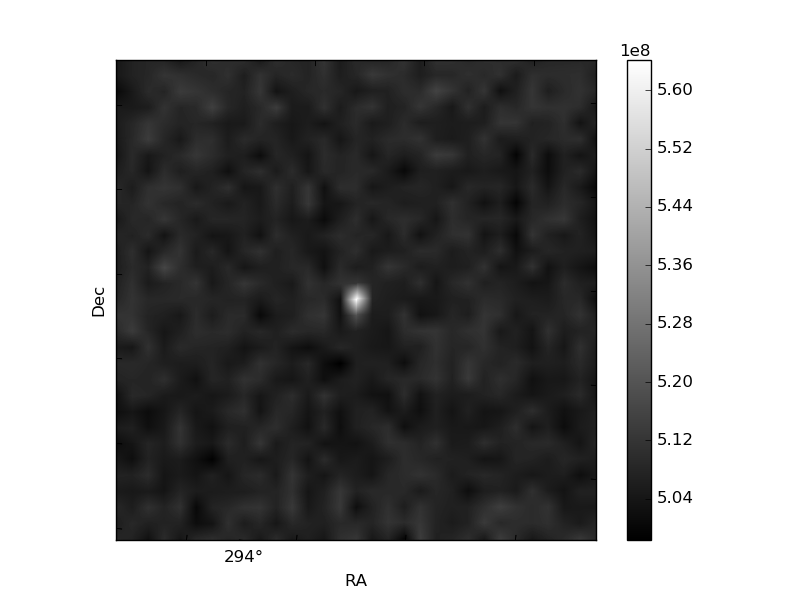
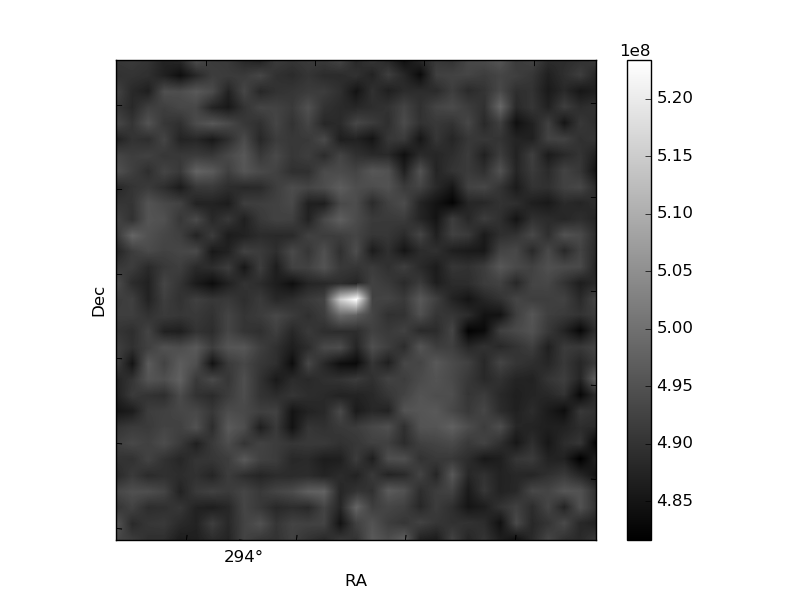
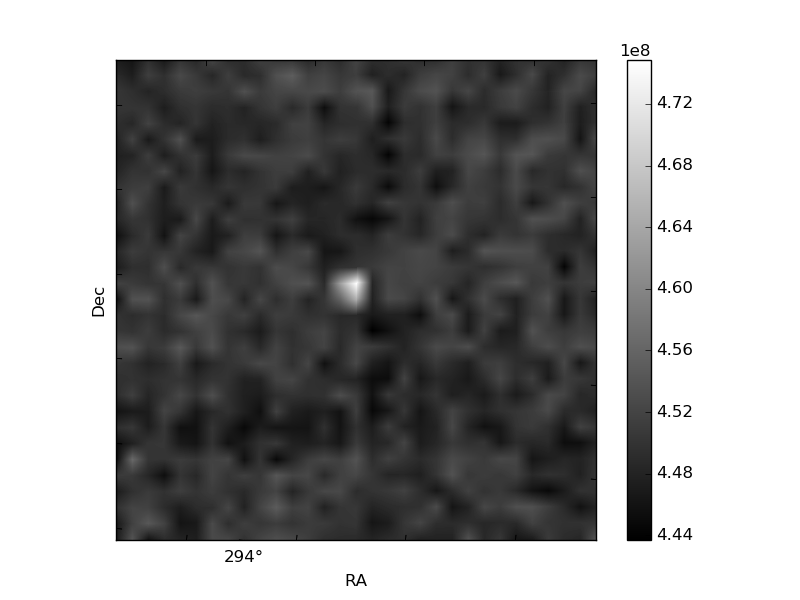
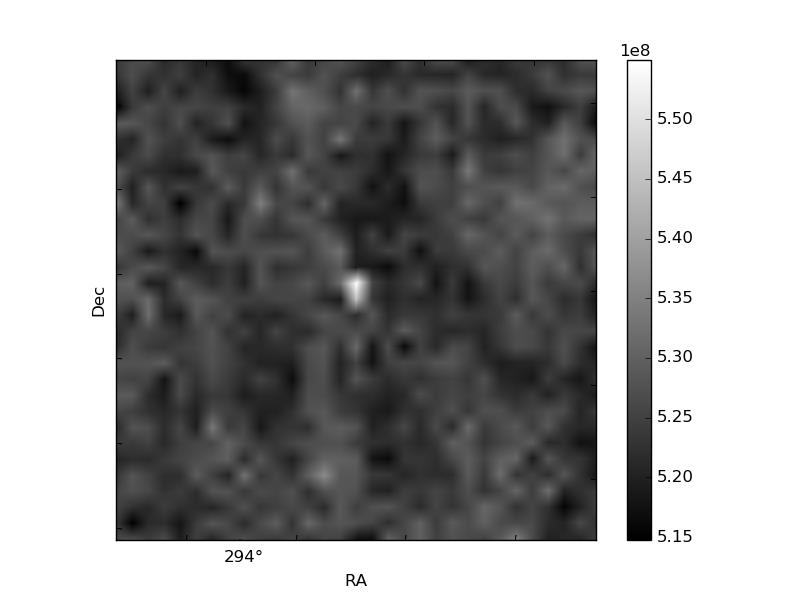
Histogram calculated using DETX and DETY for each event in the final _common_clean file
| Quadrant A | 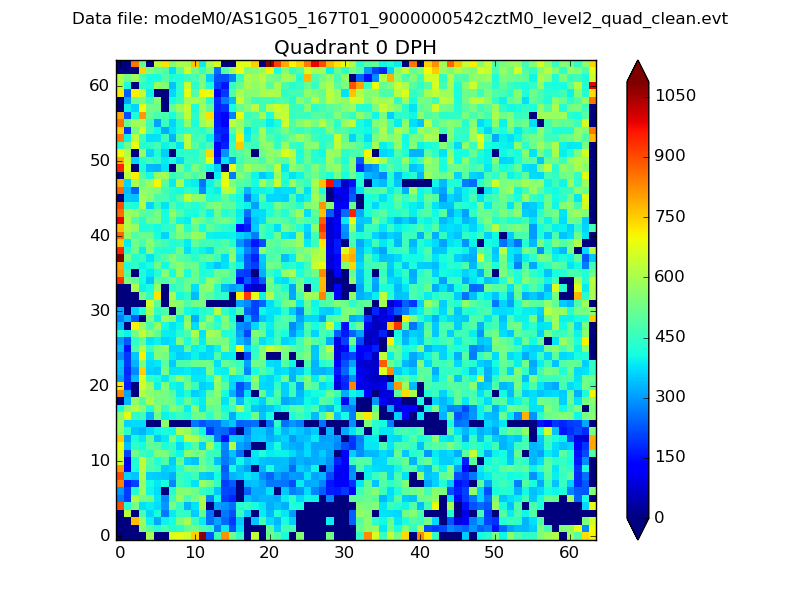 |
 |
Quadrant B |
|---|---|---|---|
| Quadrant D | 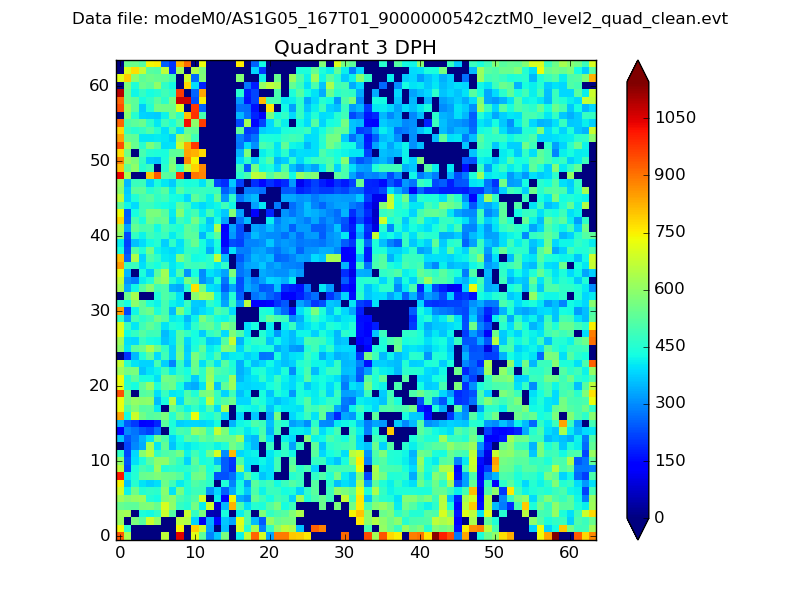 |
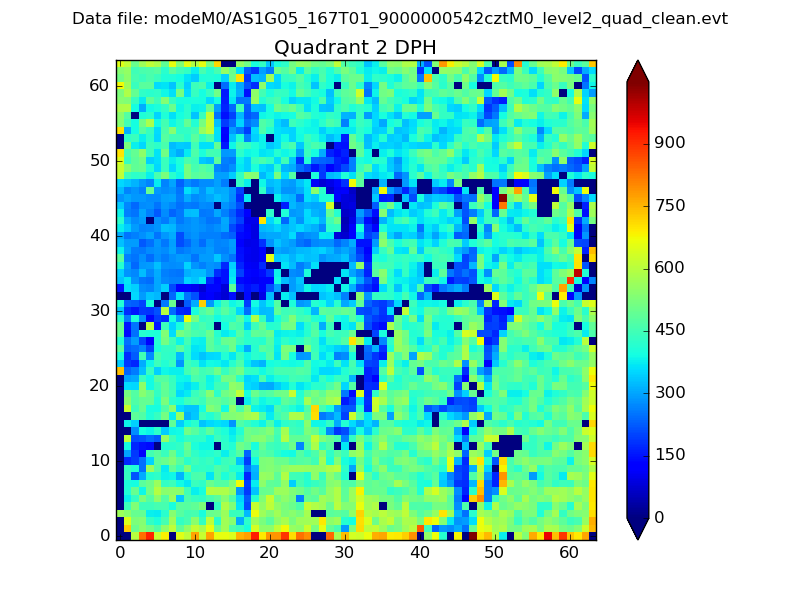 |
Quadrant C |
| Plot type | Count rate plots | Images |
|---|---|---|
| Comparison with Poisson distribution Blue bars denote a histogram of data divided into 1 sec bins. Red curve is a Poisson curve with rate = median count rate of data. |
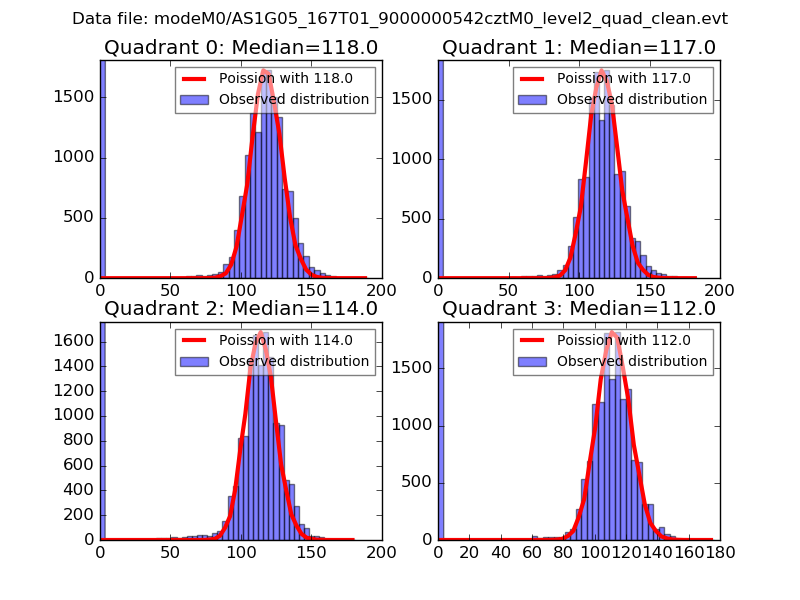 |
 |
| Quadrant-wise count rates Data is divided into 100 sec bins |
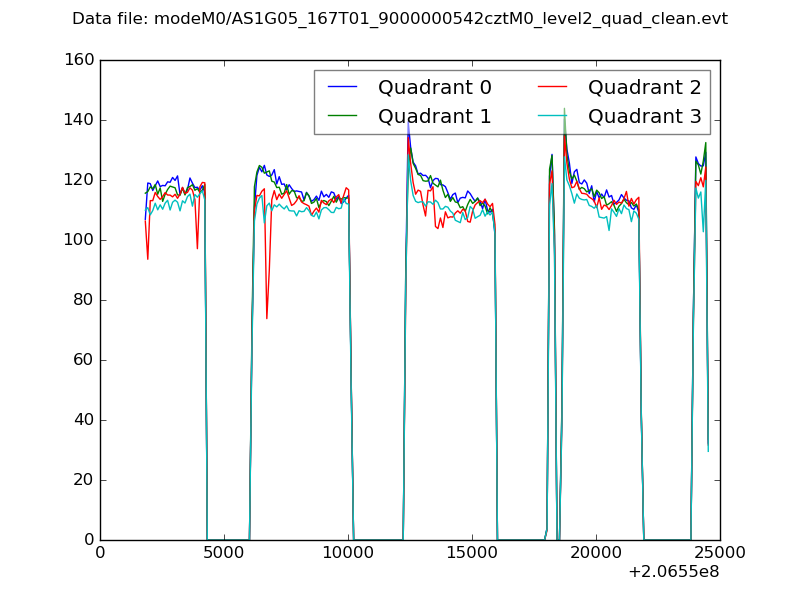 |
|
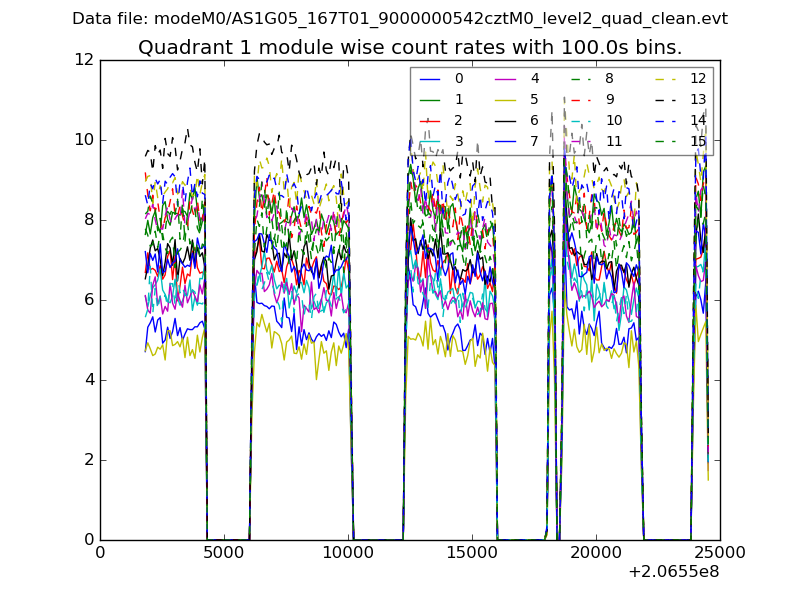
| Module-wise count rates for Quadrant A Data is divided into 100 sec bins |
 |
 |
| Module-wise count rates for Quadrant B Data is divided into 100 sec bins |
 |
 |
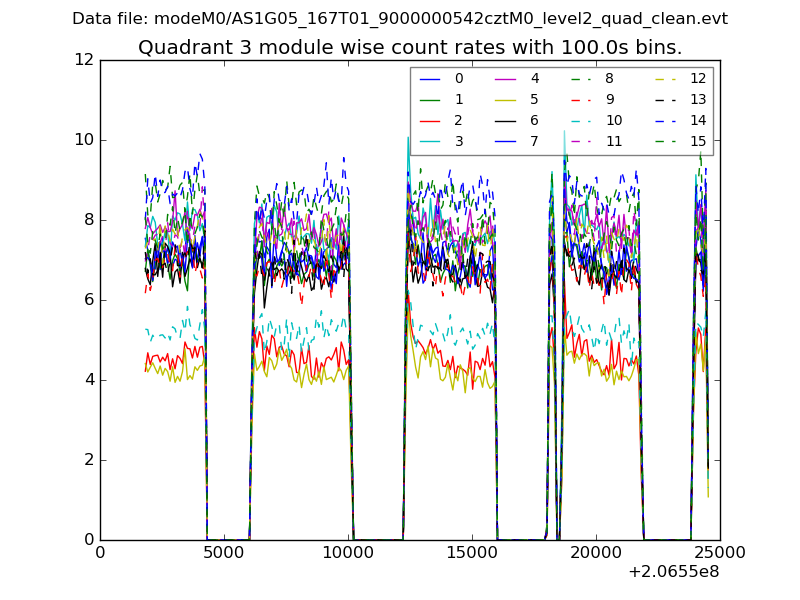
| Module-wise count rates for Quadrant C Data is divided into 100 sec bins |
 |
 |
| Module-wise count rates for Quadrant D Data is divided into 100 sec bins |
 |
 |
| Parameter | Plot |
|---|---|
| CZT HV Monitor |  |
| D_VDD | 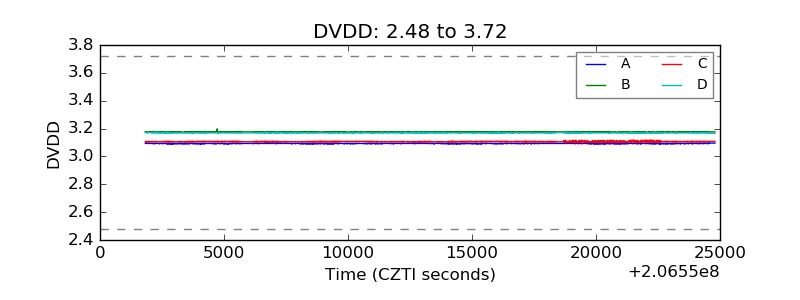 |
| Temperature 1 | 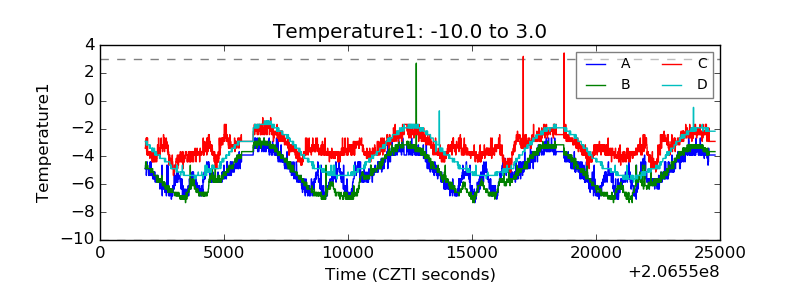 |
| Veto HV Monitor | 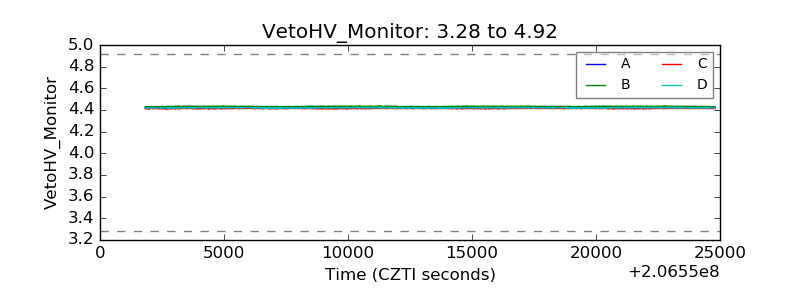 |
| Veto LLD |  |
| Alpha Counter | 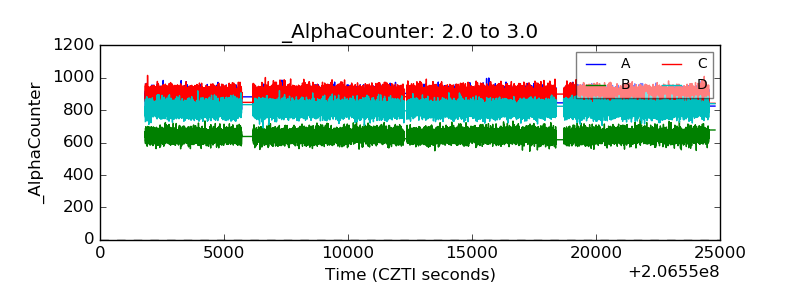 |
| _CPM_Rate | 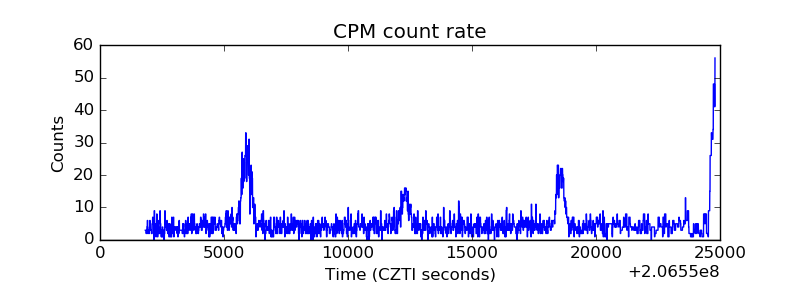 |
| CZT Counter | 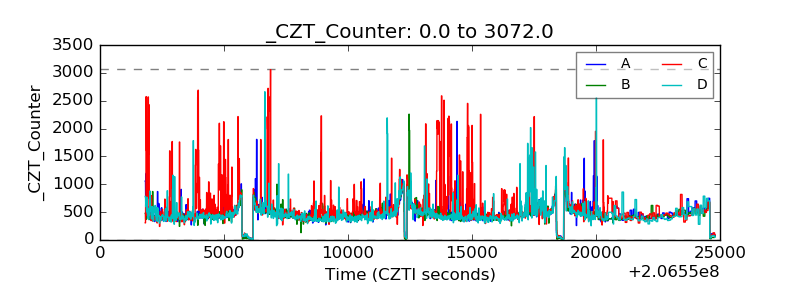 |
| +2.5 Volts monitor |  |
| +5 Volts monitor |  |
| _ROLL_ROT | 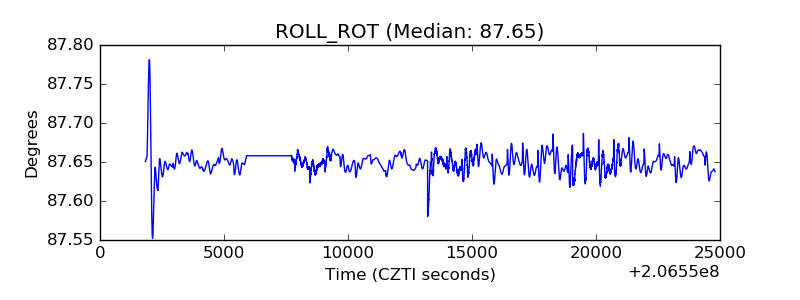 |
| _Roll_DEC | 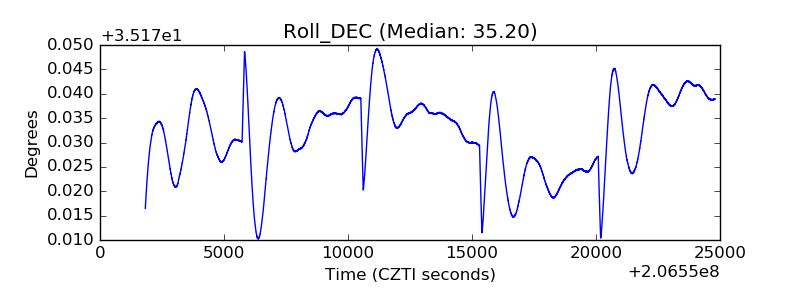 |
| _Roll_RA | 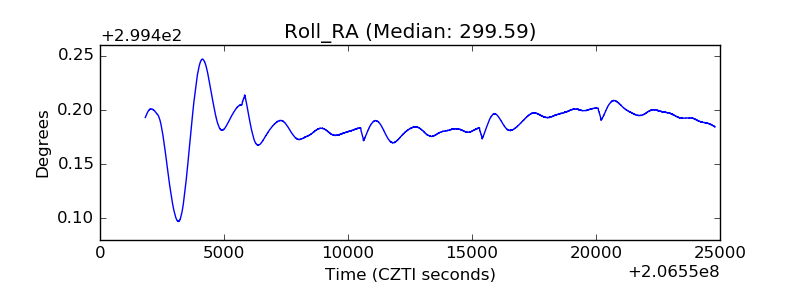 |
| Veto Counter |  |