| Param | Original file | Final file |
|---|---|---|
| Filename | modeM0/AS1G05_167T01_9000000542_04360cztM0_level2.evt | modeM0/AS1G05_167T01_9000000542_04360cztM0_level2_quad_clean.evt |
| Size (bytes) | 393,888,960 | 70,234,560 |
| Size | 375.6 MB | 67.0 MB |
| Events in quadrant A | 2,705,941 | 450,192 |
| Events in quadrant B | 2,578,475 | 445,972 |
| Events in quadrant C | 3,602,408 | 425,625 |
| Events in quadrant D | 2,672,105 | 424,271 |
| Mode M0 | |||
|---|---|---|---|
| Quadrant | BADHDUFLAG | Total packets | Discarded packets |
| A | 0 | 11648 | 2 |
| B | 0 | 11306 | 1 |
| C | 0 | 14433 | 1 |
| D | 0 | 11803 | 1 |
| Mode M9 | |||
|---|---|---|---|
| Quadrant | BADHDUFLAG | Total packets | Discarded packets |
| A | 0 | 4 | 0 |
| B | 0 | 4 | 0 |
| C | 0 | 4 | 0 |
| D | 0 | 4 | 0 |
| Mode SS | |||
|---|---|---|---|
| Quadrant | BADHDUFLAG | Total packets | Discarded packets |
| A | 0 | 112 | 0 |
| B | 0 | 112 | 0 |
| C | 0 | 112 | 0 |
| D | 0 | 112 | 0 |
| Quadrant | Total seconds | Saturated seconds | Saturation percentage |
|---|---|---|---|
| A | 5431 | 95 | 1.749217% |
| B | 5431 | 64 | 1.178420% |
| C | 5431 | 375 | 6.904806% |
| D | 5431 | 90 | 1.657153% |
Noise dominated data is calculated using 1-second bins in cleaned event files. If a bin has >2000 counts, and if more than 50% of those come from <1% of pixels, then it is considered to be noise-dominated and hence unusable.
| Quadrant | # 1 sec bins | Bins with >0 counts | Bins with >2000 counts | High rate bins dominated by noise | Noise dominated (total time) | Noise dominated (detector-on time) | Marked lightcurve |
|---|---|---|---|---|---|---|---|
| A | 5891 | 5431 | 23 | 23 | 0.39% | 0.42% | 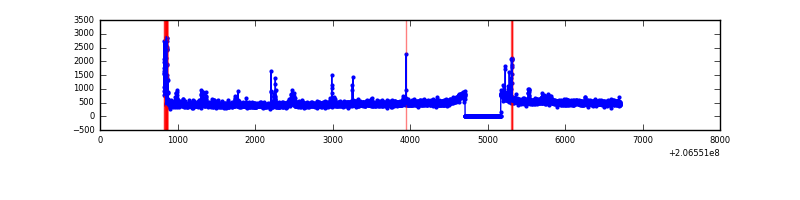 |
| B | 5891 | 5432 | 2 | 2 | 0.03% | 0.04% | 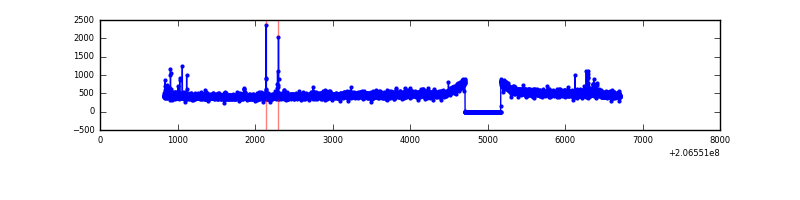 |
| C | 5891 | 5431 | 288 | 288 | 4.89% | 5.30% |  |
| D | 5891 | 5431 | 25 | 25 | 0.42% | 0.46% | 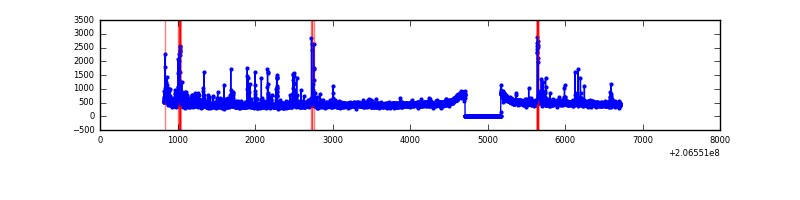 |
Top three noisy pixels from each quadrant. If the there are fewer than three noisy pixels in the level2.evt file, extra rows are filled as -1
| Pixel properties | Quadrant properties | ||||||
|---|---|---|---|---|---|---|---|
| Quadrant | DetID | PixID | Counts | Sigma | Mean | Median | Sigma |
| A | 15 | 234 | 127544 | 968.26 | 642 | 629 | 131.1 |
| A | 13 | 251 | 74962 | 567.1 | 642 | 629 | 131.1 |
| A | 13 | 14 | 12738 | 92.38 | 642 | 629 | 131.1 |
| B | 14 | 167 | 25203 | 195.72 | 651 | 637 | 125.5 |
| B | 4 | 48 | 14909 | 113.71 | 651 | 637 | 125.5 |
| B | 0 | 183 | 14868 | 113.38 | 651 | 637 | 125.5 |
| C | 9 | 247 | 1201247 | 8391.79 | 612 | 618 | 143.1 |
| C | 13 | 61 | 5062 | 31.06 | 612 | 618 | 143.1 |
| C | 9 | 16 | 4688 | 28.45 | 612 | 618 | 143.1 |
| D | 2 | 63 | 116919 | 774.68 | 622 | 605 | 150.1 |
| D | 2 | 37 | 51164 | 336.74 | 622 | 605 | 150.1 |
| D | 2 | 136 | 33078 | 216.28 | 622 | 605 | 150.1 |
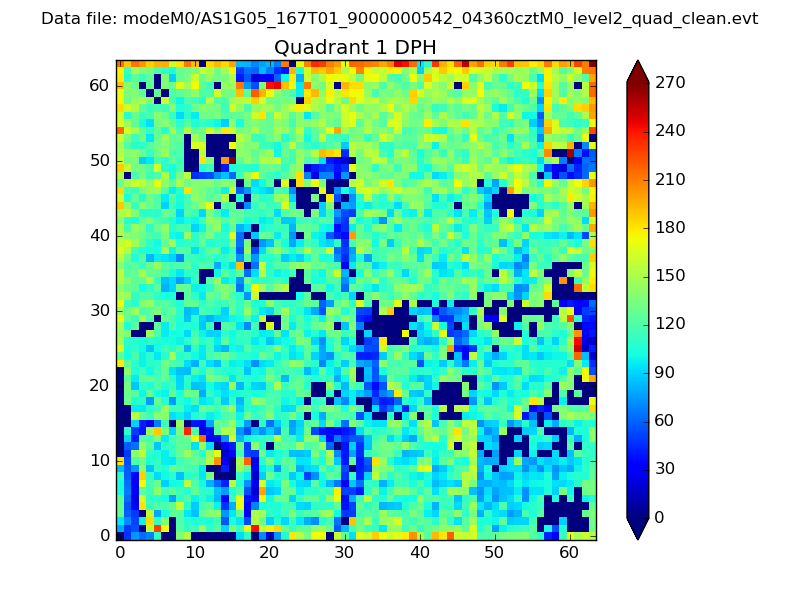
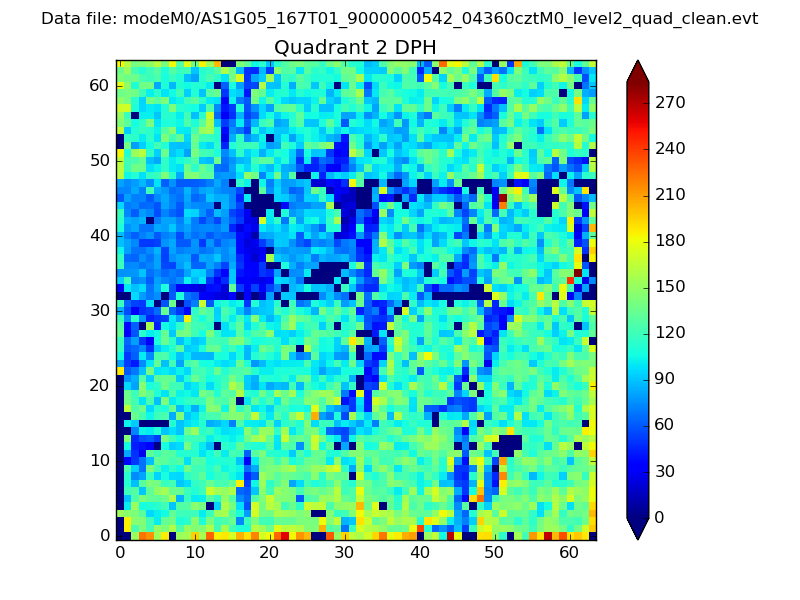
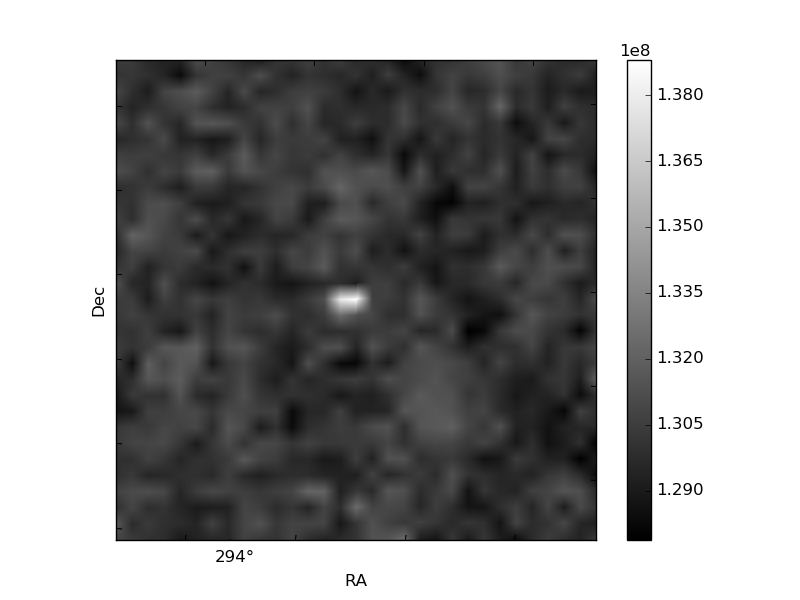
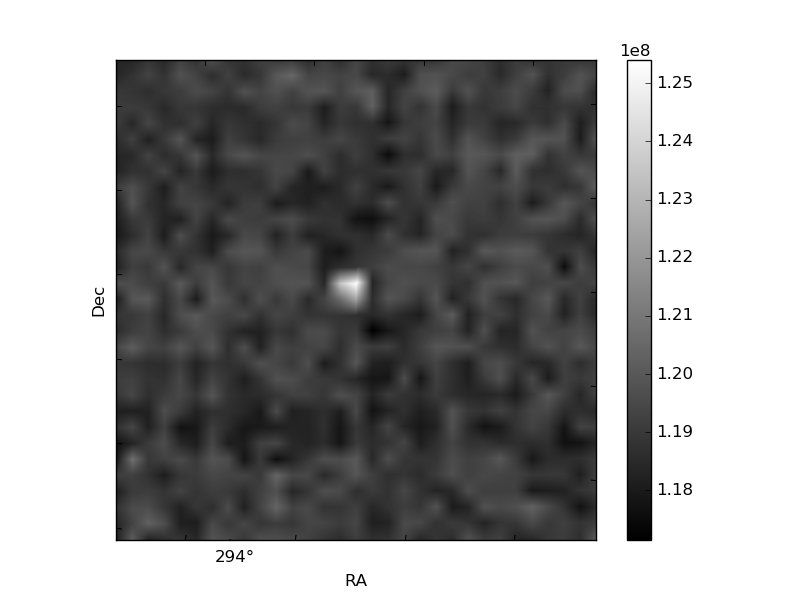
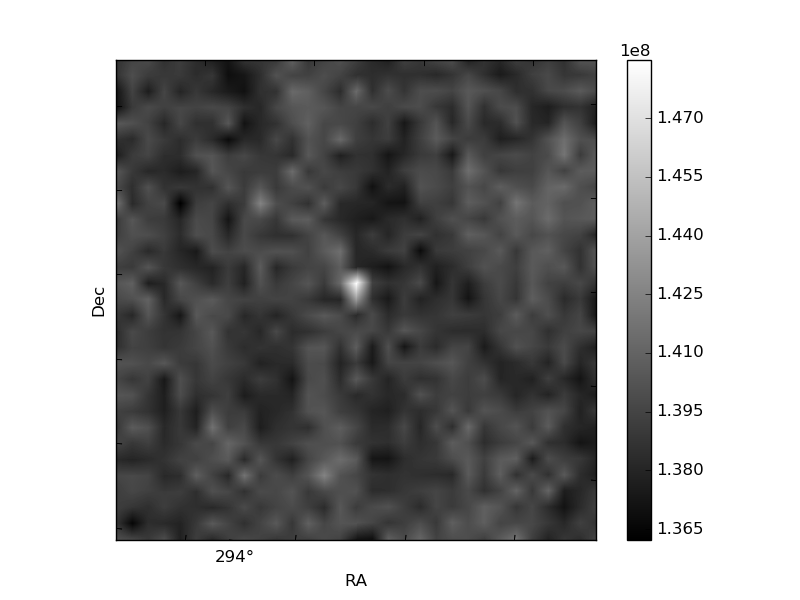
Histogram calculated using DETX and DETY for each event in the final _common_clean file
| Quadrant A | 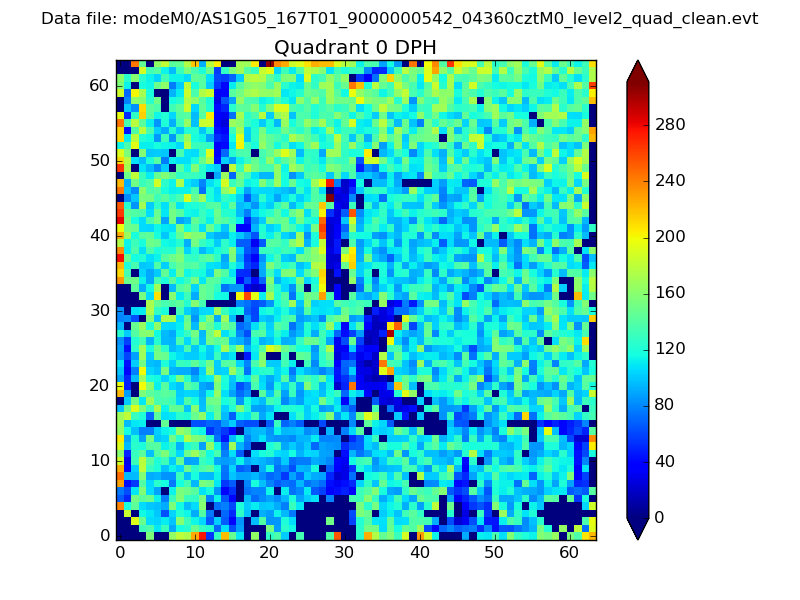 |
 |
Quadrant B |
|---|---|---|---|
| Quadrant D |  |
 |
Quadrant C |
| Plot type | Count rate plots | Images |
|---|---|---|
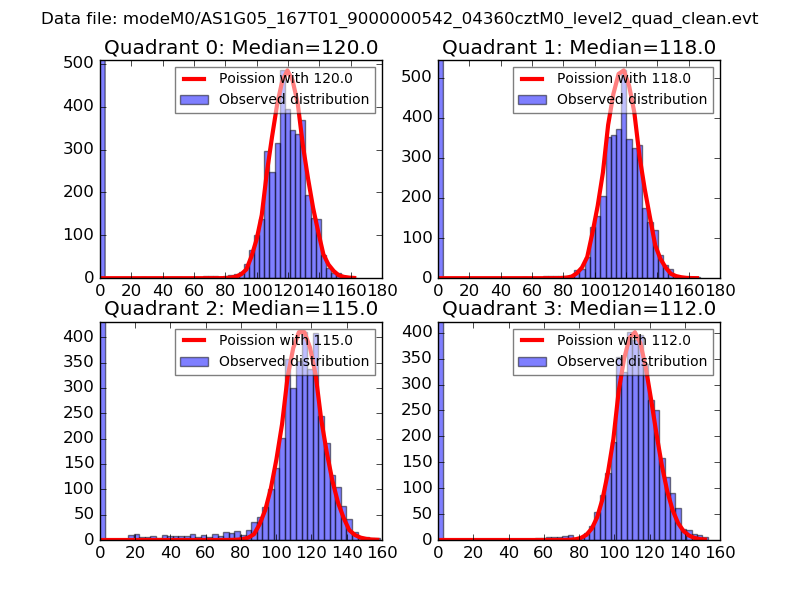
| Comparison with Poisson distribution Blue bars denote a histogram of data divided into 1 sec bins. Red curve is a Poisson curve with rate = median count rate of data. |
 |
 |
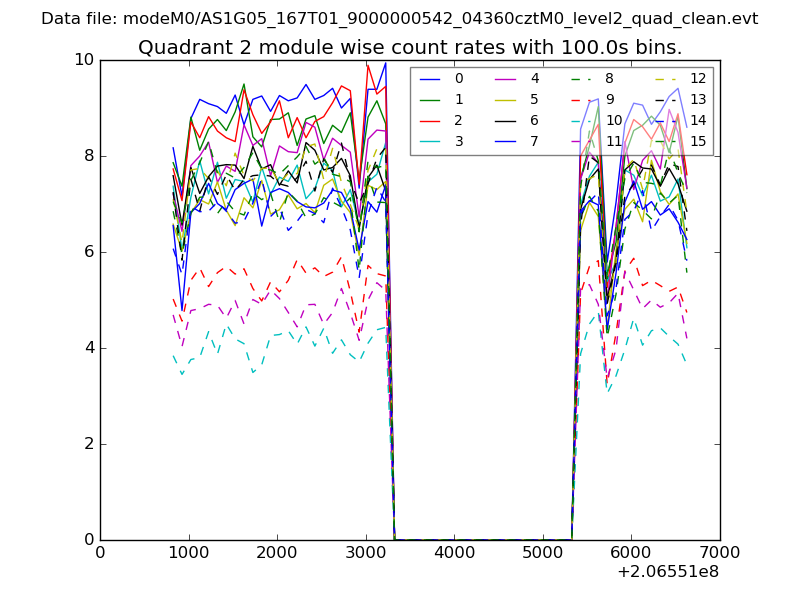
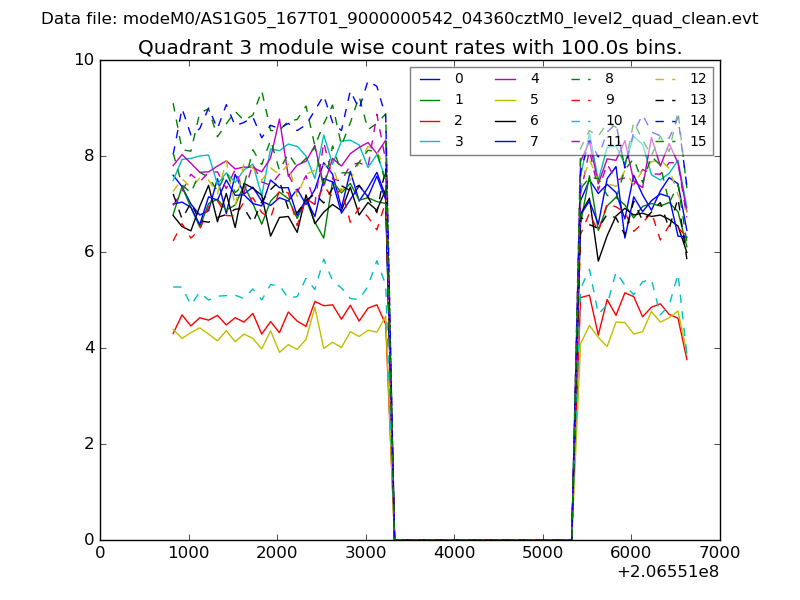
| Quadrant-wise count rates Data is divided into 100 sec bins |
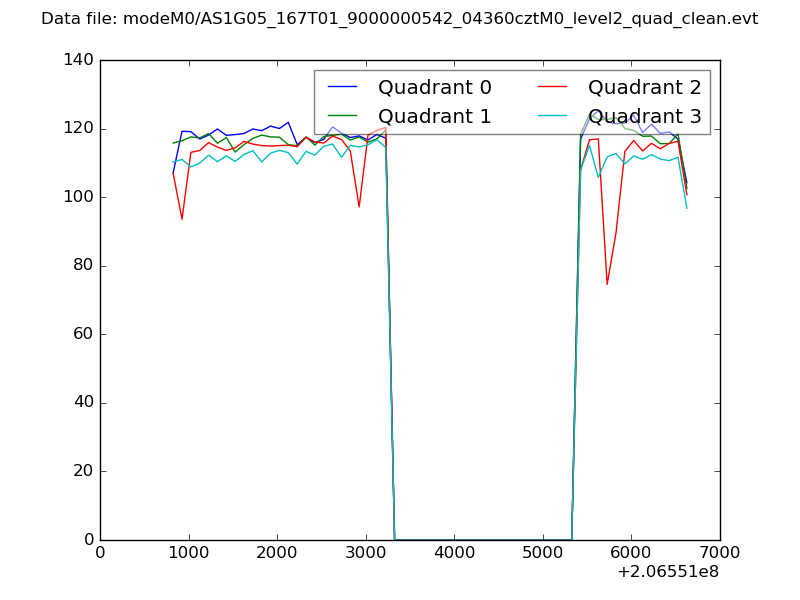 |
|
| Module-wise count rates for Quadrant A Data is divided into 100 sec bins |
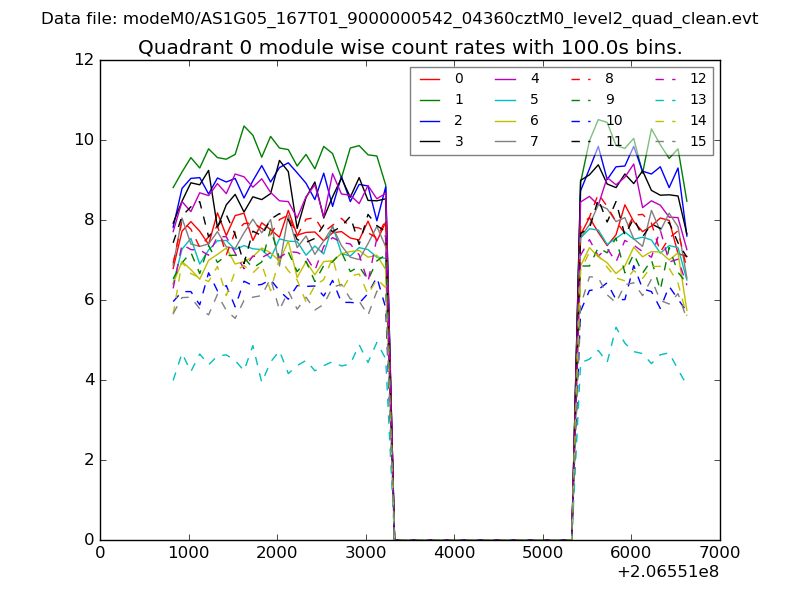 |
 |
| Module-wise count rates for Quadrant B Data is divided into 100 sec bins |
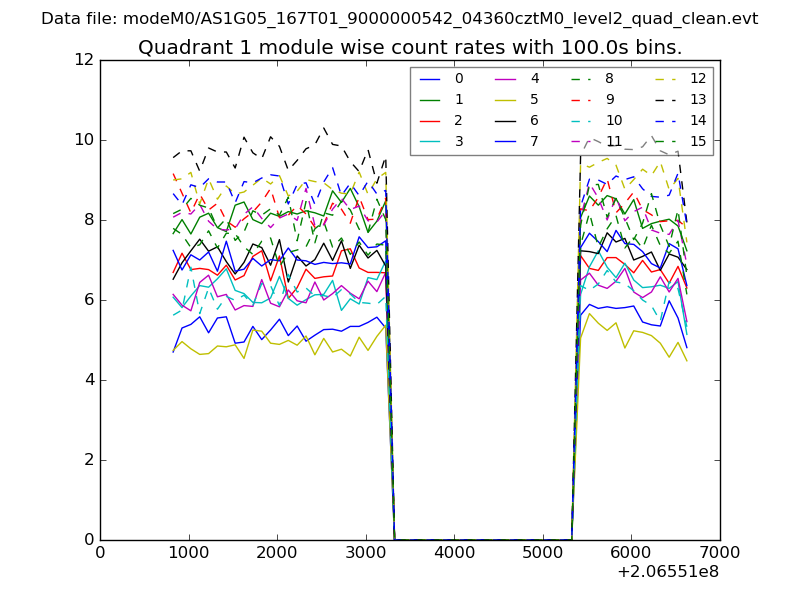 |
 |
| Module-wise count rates for Quadrant C Data is divided into 100 sec bins |
 |
 |
| Module-wise count rates for Quadrant D Data is divided into 100 sec bins |
 |
 |
| Parameter | Plot |
|---|---|
| CZT HV Monitor | 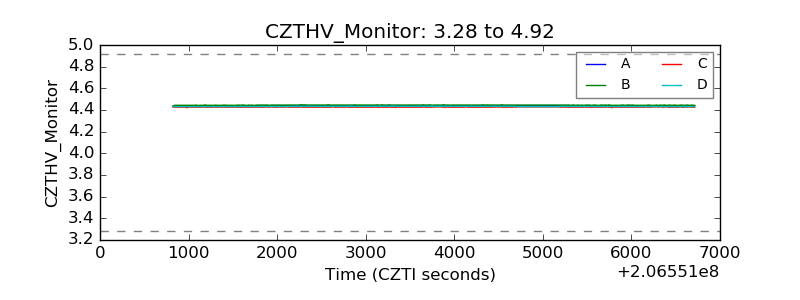 |
| D_VDD | 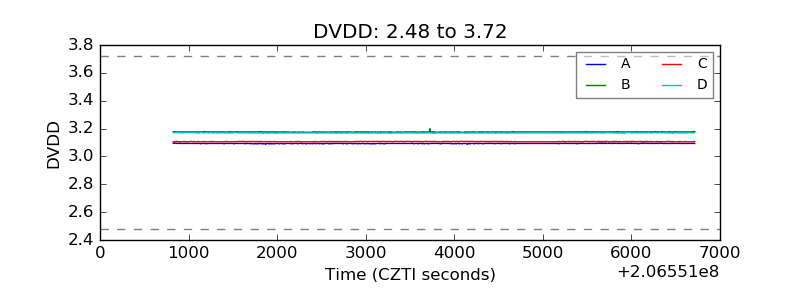 |
| Temperature 1 | 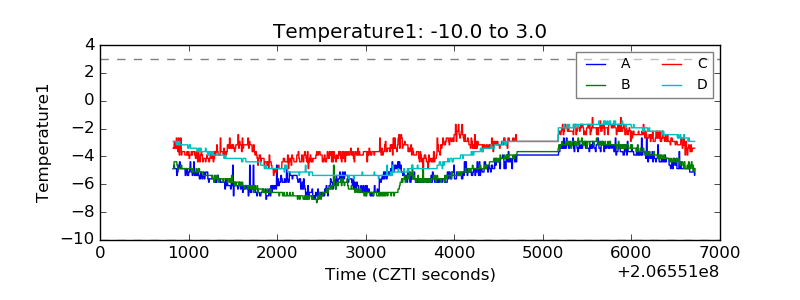 |
| Veto HV Monitor | 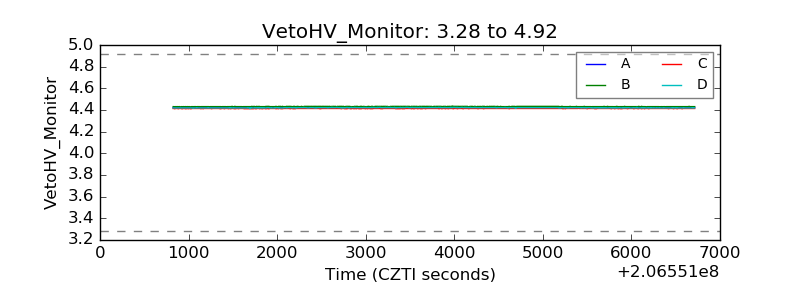 |
| Veto LLD | 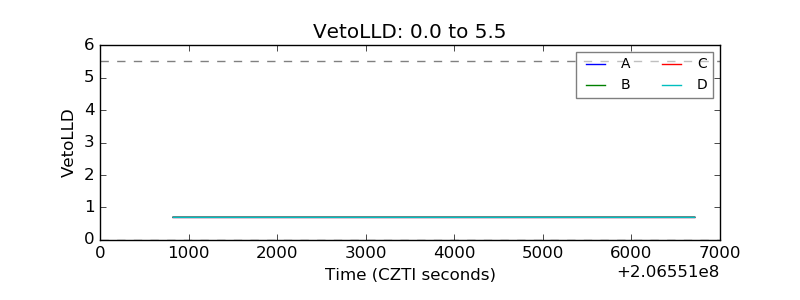 |
| Alpha Counter | 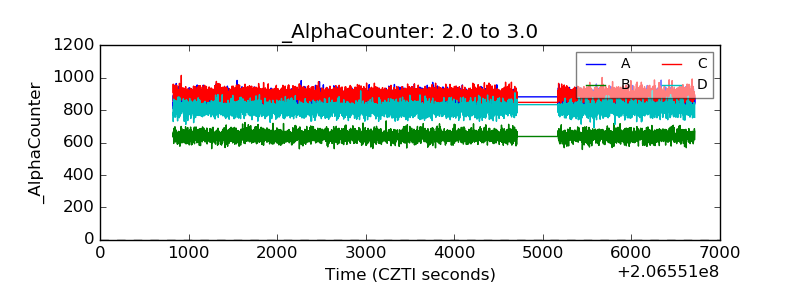 |
| _CPM_Rate | 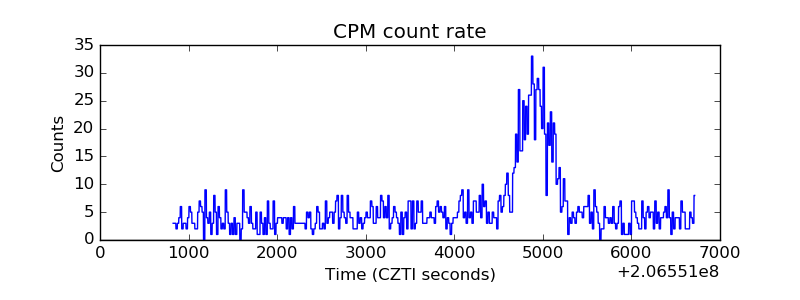 |
| CZT Counter | 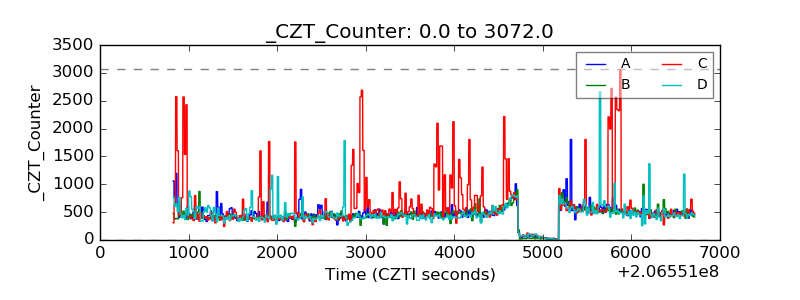 |
| +2.5 Volts monitor |  |
| +5 Volts monitor | 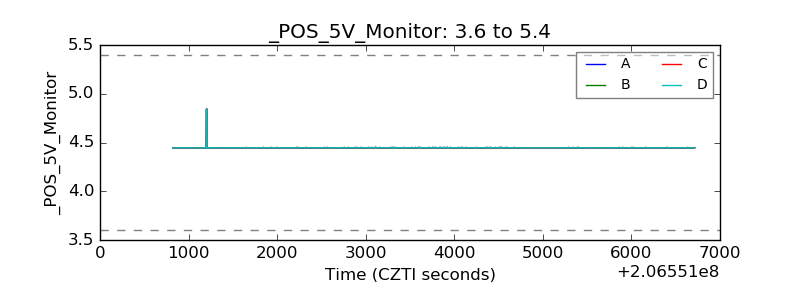 |
| _ROLL_ROT | 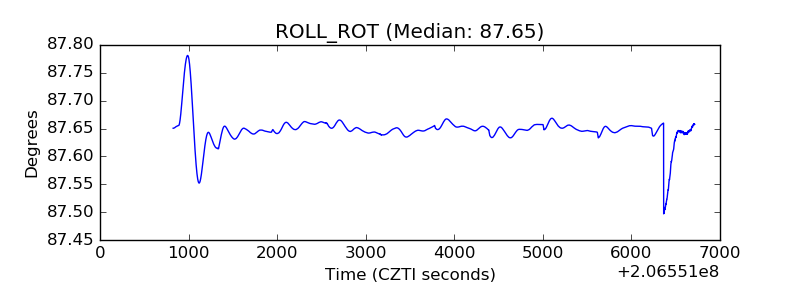 |
| _Roll_DEC | 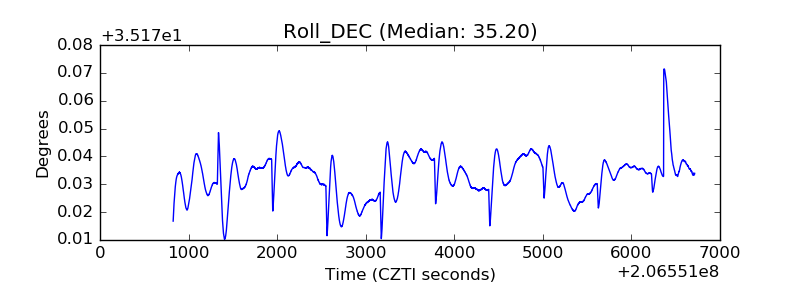 |
| _Roll_RA | 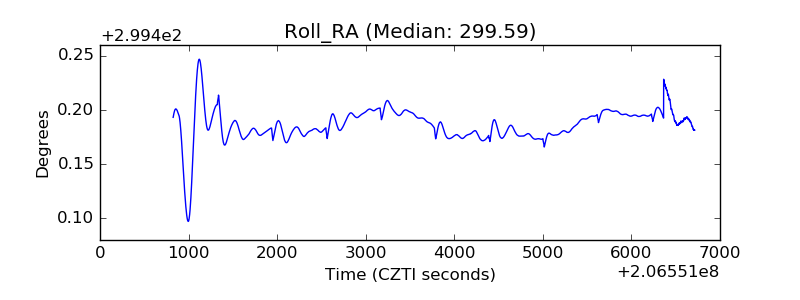 |
| Veto Counter | 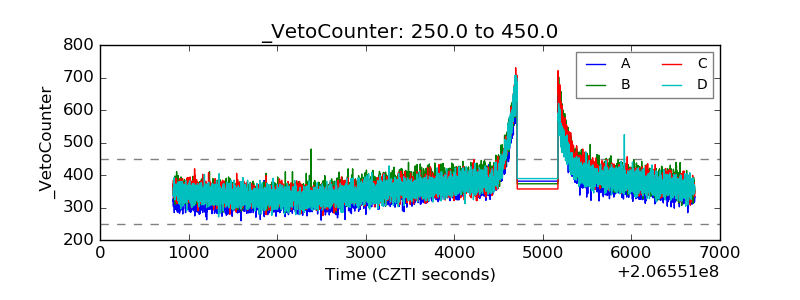 |