| Param | Original file | Final file |
|---|---|---|
| Filename | modeM0/AS1G05_167T01_9000000542_04361cztM0_level2.evt | modeM0/AS1G05_167T01_9000000542_04361cztM0_level2_quad_clean.evt |
| Size (bytes) | 554,664,960 | 100,491,840 |
| Size | 529.0 MB | 95.8 MB |
| Events in quadrant A | 3,860,105 | 645,364 |
| Events in quadrant B | 3,876,545 | 638,207 |
| Events in quadrant C | 4,740,550 | 612,845 |
| Events in quadrant D | 3,793,263 | 606,451 |
| Mode M0 | |||
|---|---|---|---|
| Quadrant | BADHDUFLAG | Total packets | Discarded packets |
| A | 0 | 16658 | 3 |
| B | 0 | 16658 | 2 |
| C | 0 | 19216 | 2 |
| D | 0 | 16879 | 2 |
| Mode M9 | |||
|---|---|---|---|
| Quadrant | BADHDUFLAG | Total packets | Discarded packets |
| A | 0 | 3 | 0 |
| B | 0 | 3 | 0 |
| C | 0 | 3 | 0 |
| D | 0 | 4 | 0 |
| Mode SS | |||
|---|---|---|---|
| Quadrant | BADHDUFLAG | Total packets | Discarded packets |
| A | 0 | 158 | 0 |
| B | 0 | 158 | 0 |
| C | 0 | 158 | 0 |
| D | 0 | 158 | 0 |
| Quadrant | Total seconds | Saturated seconds | Saturation percentage |
|---|---|---|---|
| A | 7770 | 158 | 2.033462% |
| B | 7770 | 171 | 2.200772% |
| C | 7770 | 360 | 4.633205% |
| D | 7770 | 141 | 1.814672% |
Noise dominated data is calculated using 1-second bins in cleaned event files. If a bin has >2000 counts, and if more than 50% of those come from <1% of pixels, then it is considered to be noise-dominated and hence unusable.
| Quadrant | # 1 sec bins | Bins with >0 counts | Bins with >2000 counts | High rate bins dominated by noise | Noise dominated (total time) | Noise dominated (detector-on time) | Marked lightcurve |
|---|---|---|---|---|---|---|---|
| A | 7875 | 7771 | 6 | 6 | 0.08% | 0.08% | 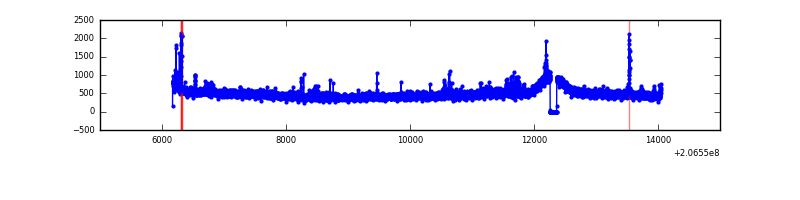 |
| B | 7875 | 7770 | 14 | 14 | 0.18% | 0.18% | 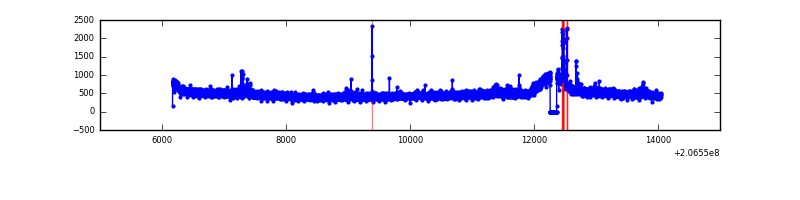 |
| C | 7875 | 7770 | 228 | 228 | 2.90% | 2.93% | 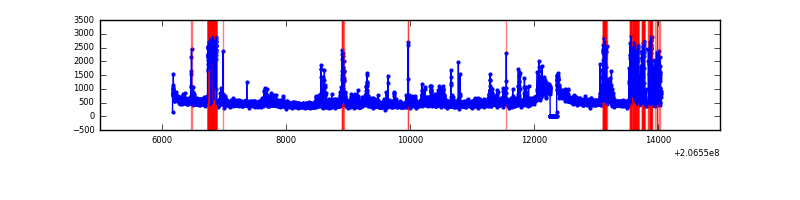 |
| D | 7875 | 7770 | 31 | 31 | 0.39% | 0.40% | 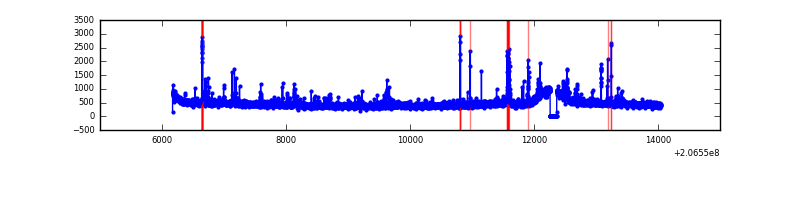 |
Top three noisy pixels from each quadrant. If the there are fewer than three noisy pixels in the level2.evt file, extra rows are filled as -1
| Pixel properties | Quadrant properties | ||||||
|---|---|---|---|---|---|---|---|
| Quadrant | DetID | PixID | Counts | Sigma | Mean | Median | Sigma |
| A | 13 | 251 | 149123 | 755.64 | 953 | 933 | 196.1 |
| A | 15 | 234 | 22400 | 109.46 | 953 | 933 | 196.1 |
| A | 8 | 15 | 13968 | 66.47 | 953 | 933 | 196.1 |
| B | 4 | 48 | 61235 | 325.93 | 958 | 938 | 185.0 |
| B | 15 | 204 | 49600 | 263.04 | 958 | 938 | 185.0 |
| B | 14 | 167 | 38346 | 202.21 | 958 | 938 | 185.0 |
| C | 9 | 247 | 1112000 | 5129.76 | 917 | 922 | 216.6 |
| C | 9 | 16 | 27349 | 122.01 | 917 | 922 | 216.6 |
| C | 10 | 65 | 20666 | 91.16 | 917 | 922 | 216.6 |
| D | 13 | 239 | 76949 | 339.17 | 926 | 899 | 224.2 |
| D | 13 | 223 | 47136 | 206.21 | 926 | 899 | 224.2 |
| D | 2 | 37 | 34288 | 148.91 | 926 | 899 | 224.2 |
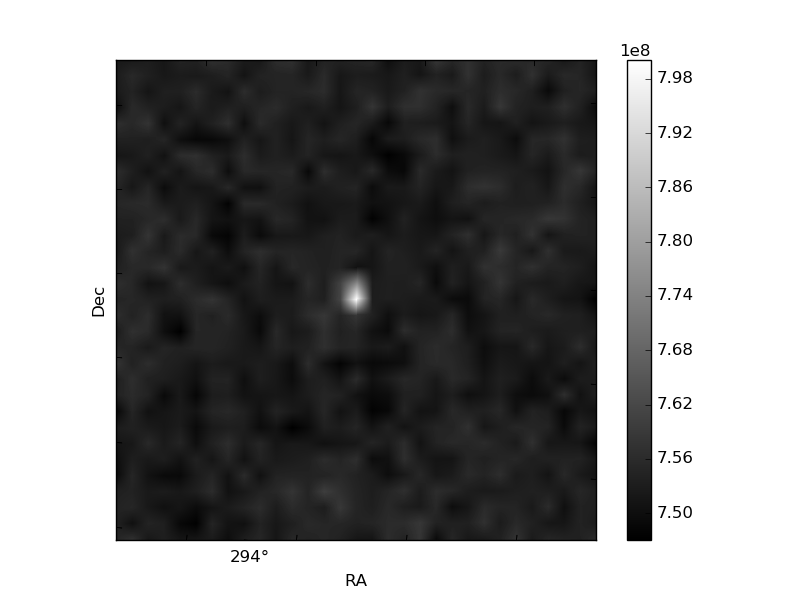
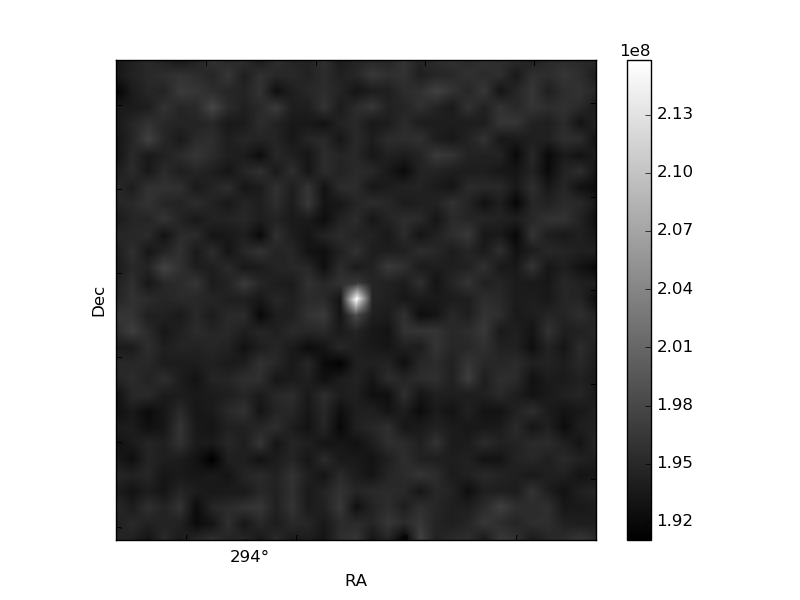
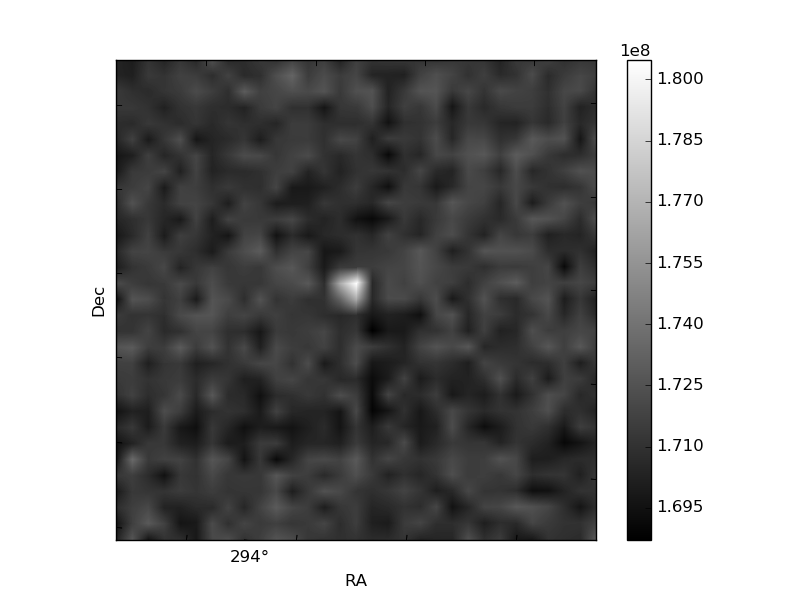
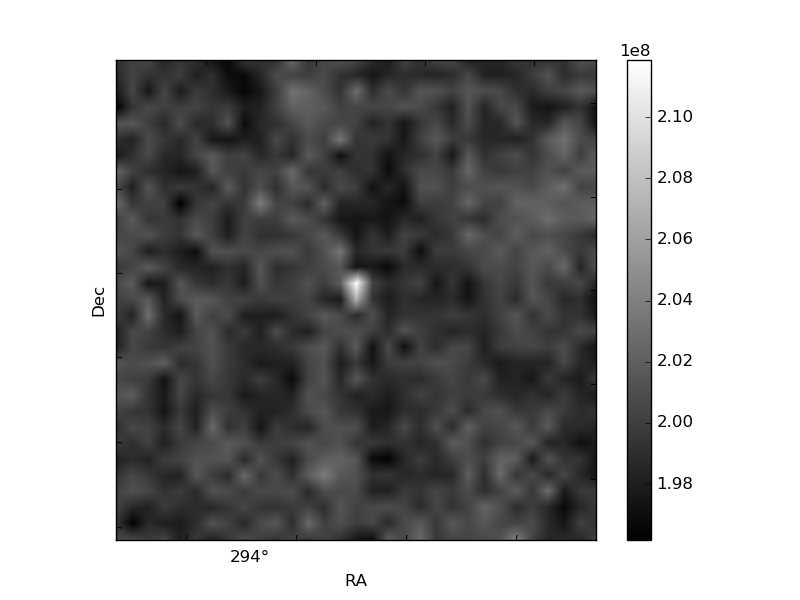
Histogram calculated using DETX and DETY for each event in the final _common_clean file
| Quadrant A | 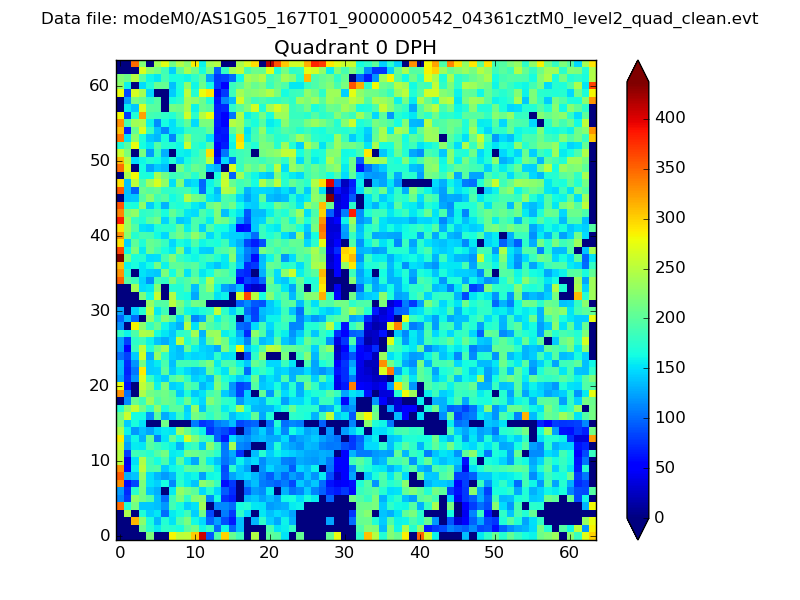 |
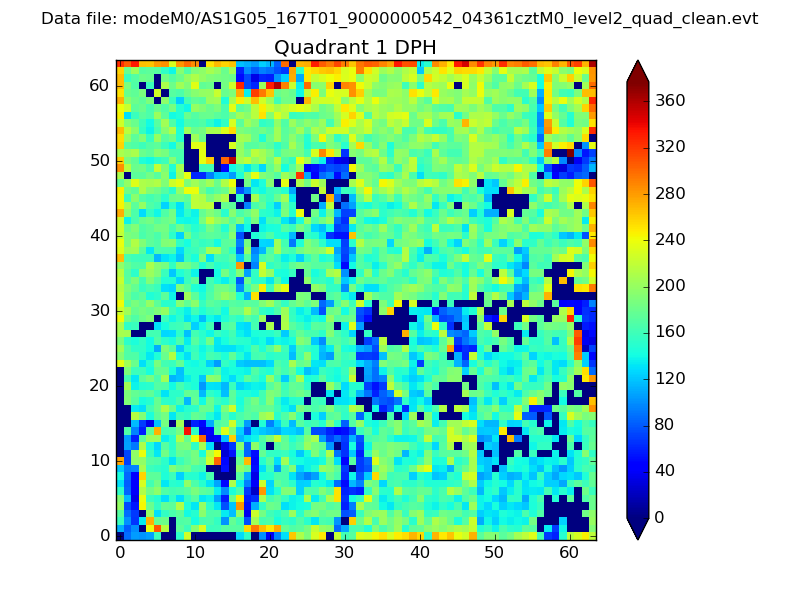 |
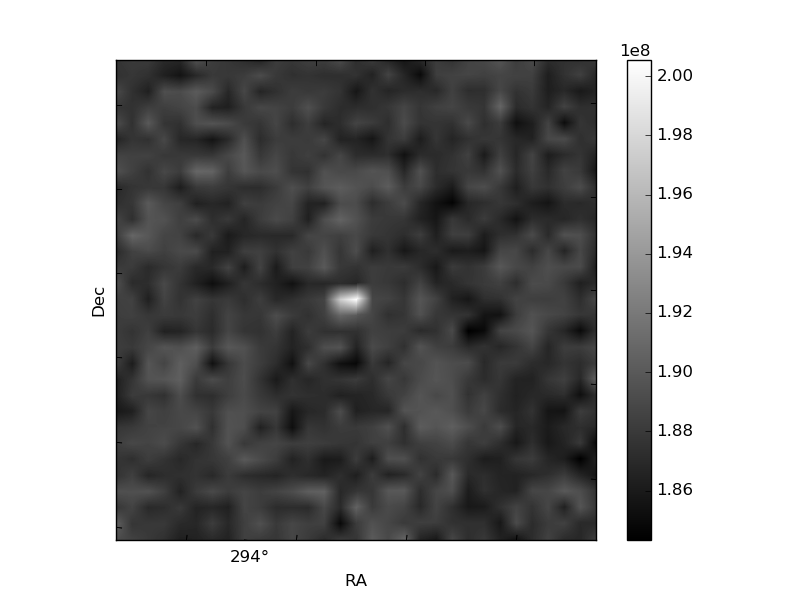
Quadrant B |
|---|---|---|---|
| Quadrant D | 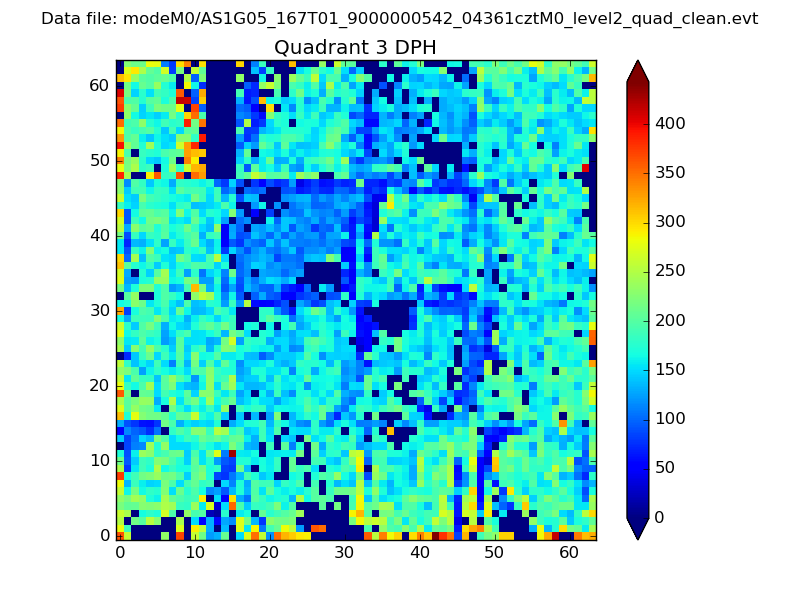 |
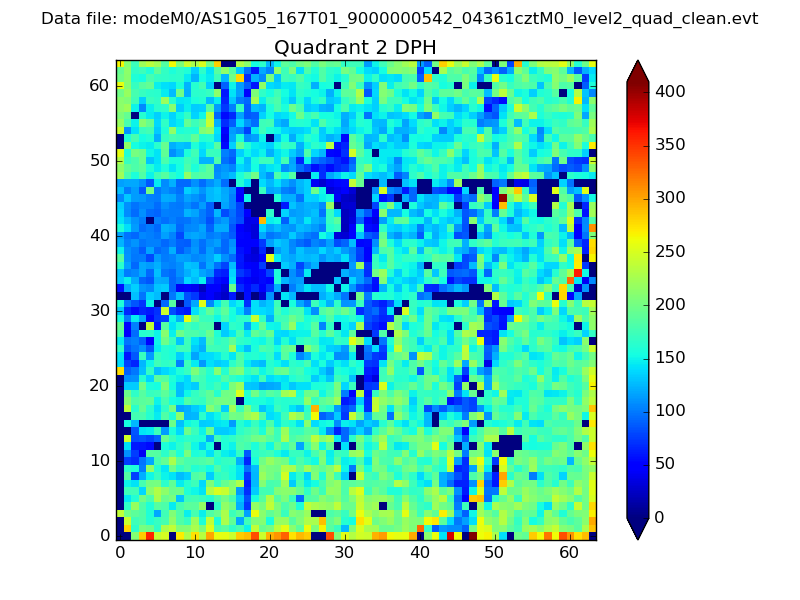 |
Quadrant C |
| Plot type | Count rate plots | Images |
|---|---|---|
| Comparison with Poisson distribution Blue bars denote a histogram of data divided into 1 sec bins. Red curve is a Poisson curve with rate = median count rate of data. |
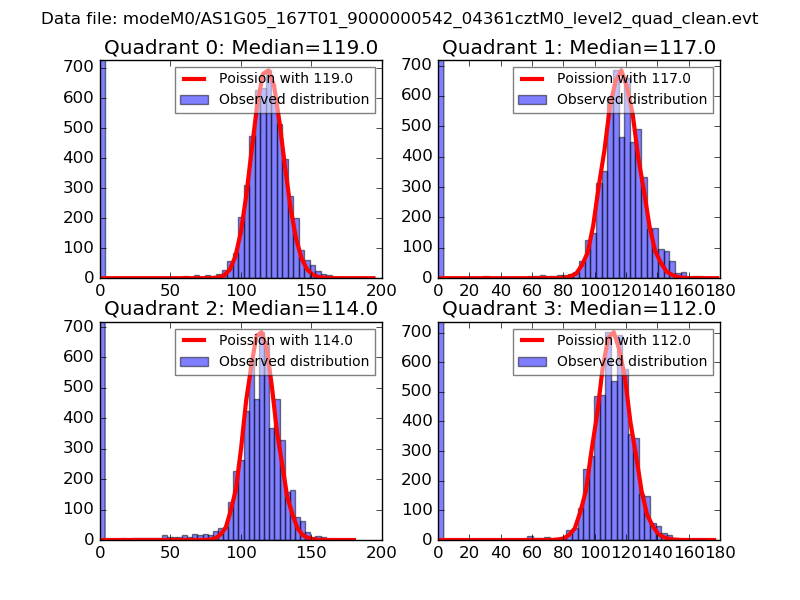 |
 |
| Quadrant-wise count rates Data is divided into 100 sec bins |
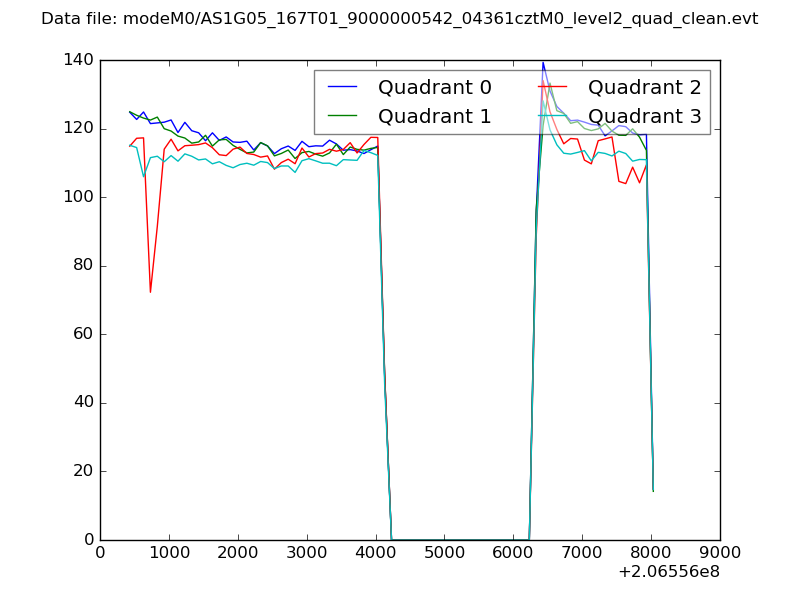 |
|
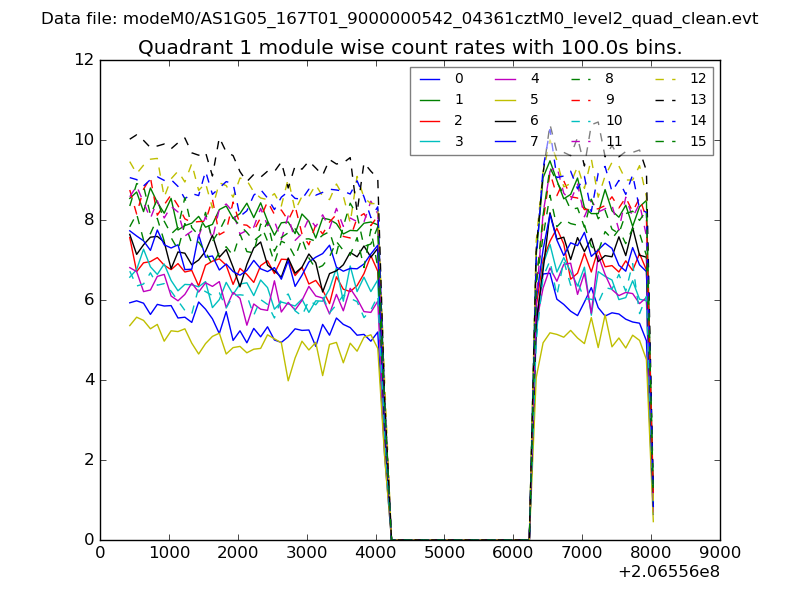
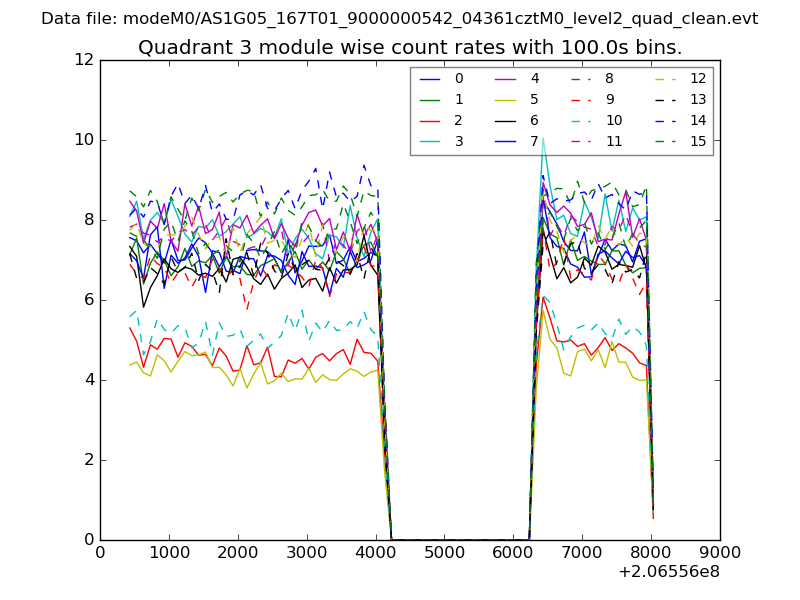
| Module-wise count rates for Quadrant A Data is divided into 100 sec bins |
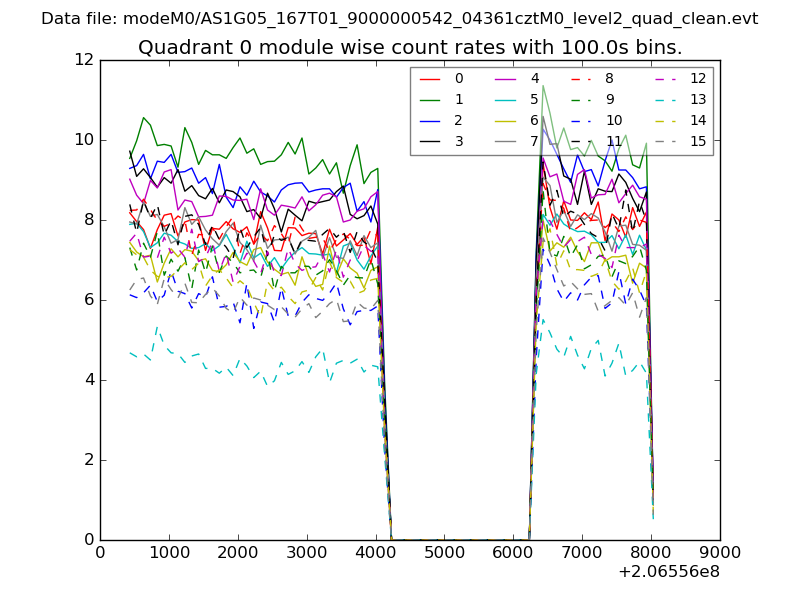 |
 |
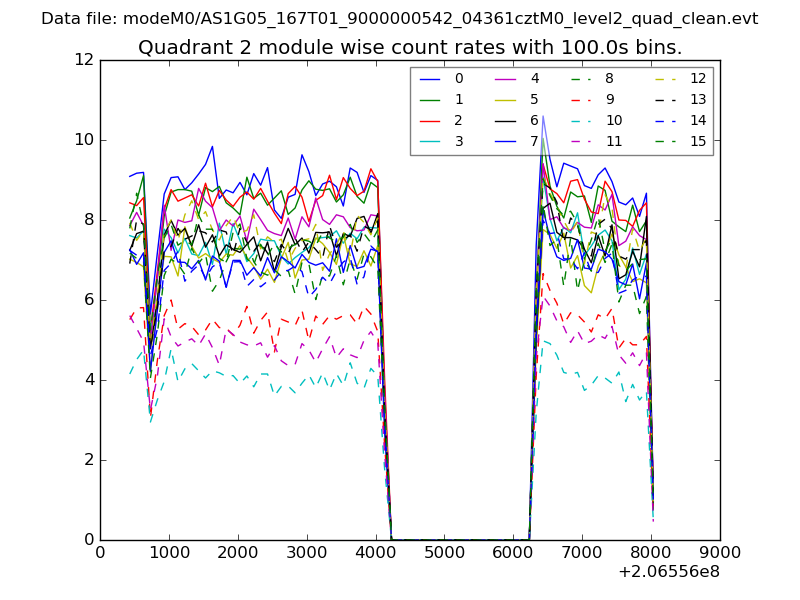
| Module-wise count rates for Quadrant B Data is divided into 100 sec bins |
 |
 |
| Module-wise count rates for Quadrant C Data is divided into 100 sec bins |
 |
 |
| Module-wise count rates for Quadrant D Data is divided into 100 sec bins |
 |
 |
| Parameter | Plot |
|---|---|
| CZT HV Monitor | 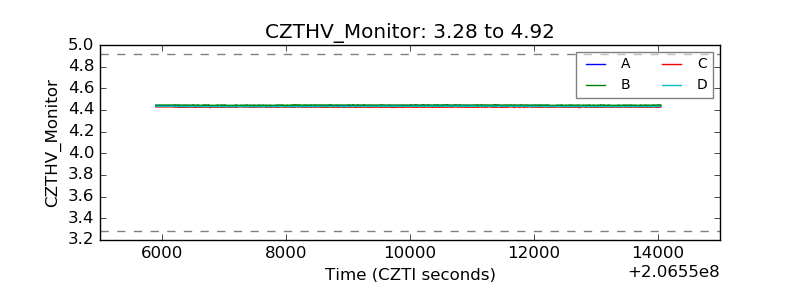 |
| D_VDD | 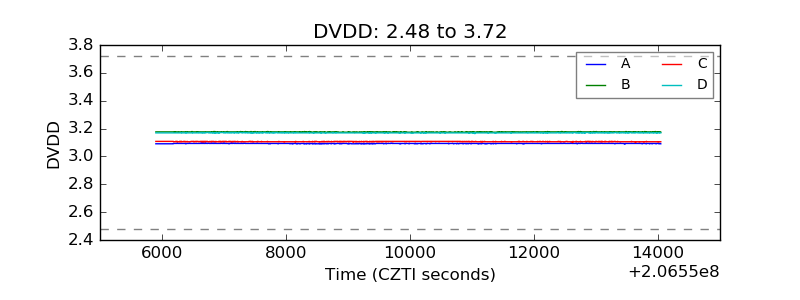 |
| Temperature 1 | 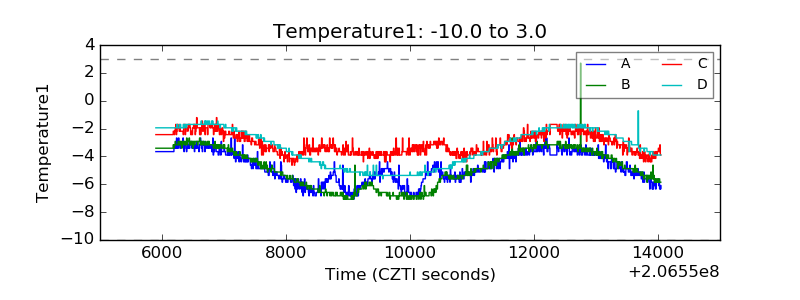 |
| Veto HV Monitor | 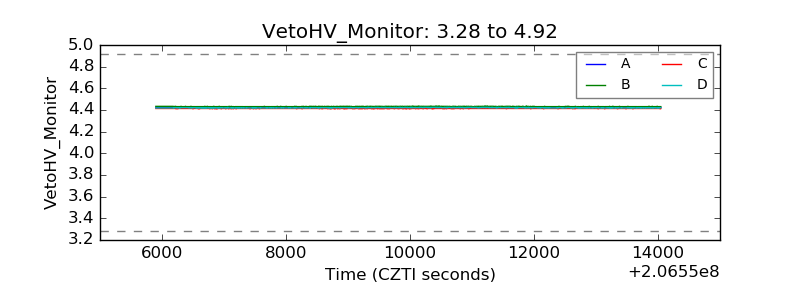 |
| Veto LLD | 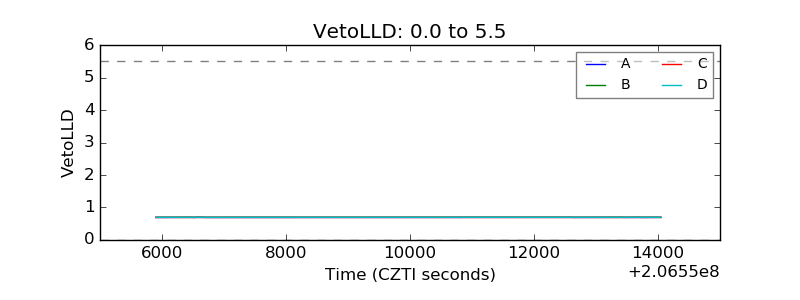 |
| Alpha Counter | 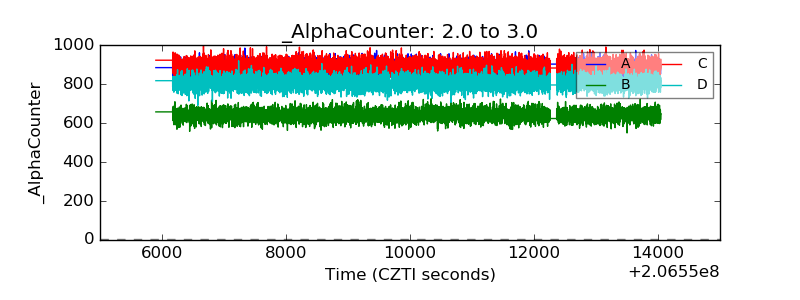 |
| _CPM_Rate | 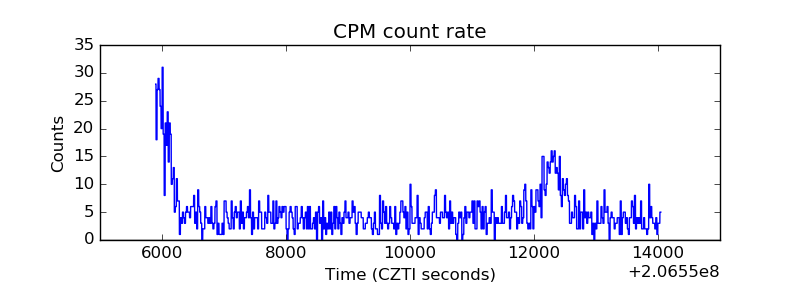 |
| CZT Counter | 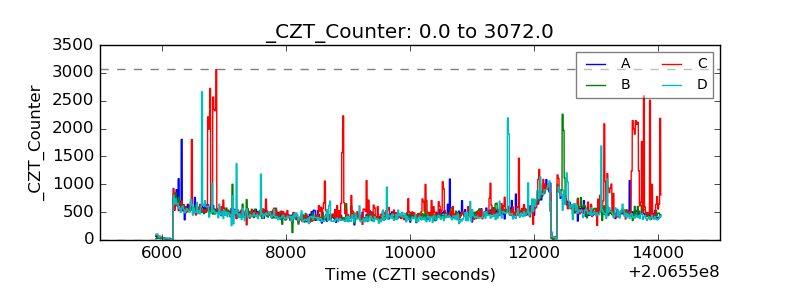 |
| +2.5 Volts monitor |  |
| +5 Volts monitor |  |
| _ROLL_ROT | 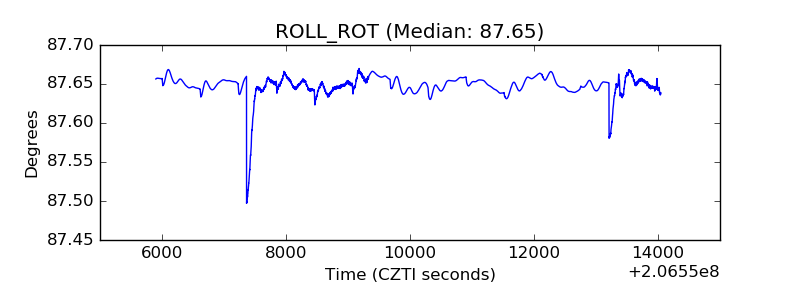 |
| _Roll_DEC | 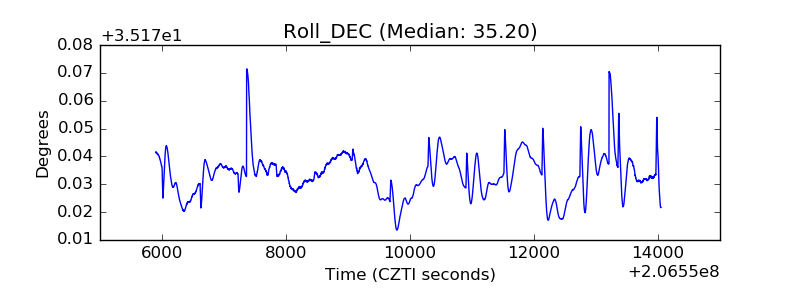 |
| _Roll_RA | 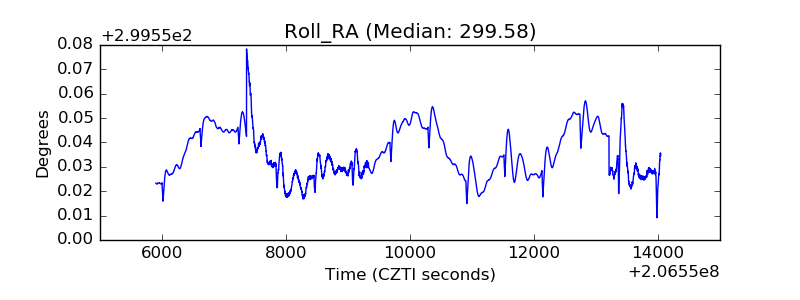 |
| Veto Counter | 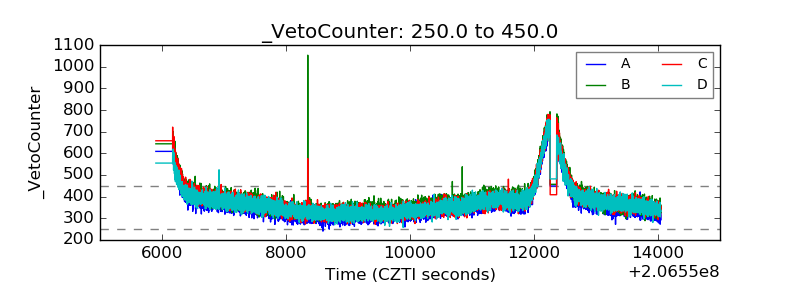 |