| Param | Original file | Final file |
|---|---|---|
| Filename | modeM0/AS1G05_167T01_9000000542_04362cztM0_level2.evt | modeM0/AS1G05_167T01_9000000542_04362cztM0_level2_quad_clean.evt |
| Size (bytes) | 524,113,920 | 96,128,640 |
| Size | 499.8 MB | 91.7 MB |
| Events in quadrant A | 3,600,578 | 615,744 |
| Events in quadrant B | 3,504,401 | 612,445 |
| Events in quadrant C | 4,640,911 | 590,735 |
| Events in quadrant D | 3,630,660 | 583,303 |
| Mode M0 | |||
|---|---|---|---|
| Quadrant | BADHDUFLAG | Total packets | Discarded packets |
| A | 0 | 15676 | 22 |
| B | 0 | 15319 | 17 |
| C | 0 | 18666 | 54 |
| D | 0 | 16177 | 27 |
| Mode M9 | |||
|---|---|---|---|
| Quadrant | BADHDUFLAG | Total packets | Discarded packets |
| A | 0 | 2 | 0 |
| B | 0 | 2 | 0 |
| C | 0 | 2 | 0 |
| D | 0 | 2 | 0 |
| Mode SS | |||
|---|---|---|---|
| Quadrant | BADHDUFLAG | Total packets | Discarded packets |
| A | 0 | 150 | 0 |
| B | 0 | 150 | 0 |
| C | 0 | 150 | 2 |
| D | 0 | 150 | 0 |
| Quadrant | Total seconds | Saturated seconds | Saturation percentage |
|---|---|---|---|
| A | 7308 | 57 | 0.779967% |
| B | 7310 | 59 | 0.807114% |
| C | 7304 | 207 | 2.834064% |
| D | 7305 | 102 | 1.396304% |
Noise dominated data is calculated using 1-second bins in cleaned event files. If a bin has >2000 counts, and if more than 50% of those come from <1% of pixels, then it is considered to be noise-dominated and hence unusable.
| Quadrant | # 1 sec bins | Bins with >0 counts | Bins with >2000 counts | High rate bins dominated by noise | Noise dominated (total time) | Noise dominated (detector-on time) | Marked lightcurve |
|---|---|---|---|---|---|---|---|
| A | 7613 | 7319 | 7 | 7 | 0.09% | 0.10% | 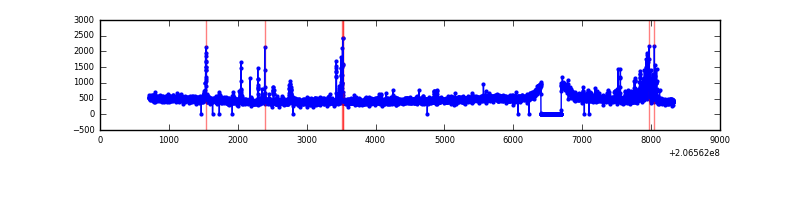 |
| B | 7613 | 7318 | 1 | 1 | 0.01% | 0.01% | 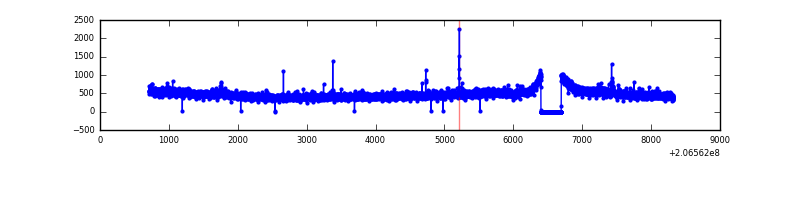 |
| C | 7613 | 7316 | 175 | 175 | 2.30% | 2.39% | 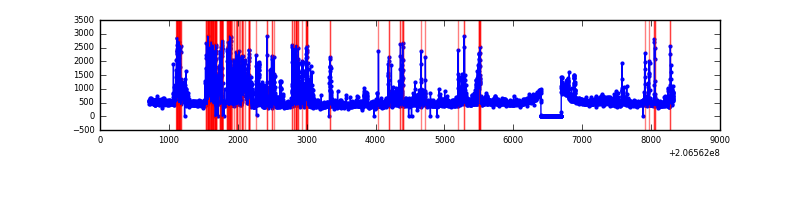 |
| D | 7613 | 7319 | 33 | 33 | 0.43% | 0.45% | 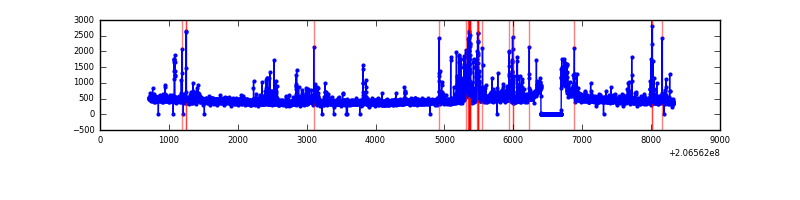 |
Top three noisy pixels from each quadrant. If the there are fewer than three noisy pixels in the level2.evt file, extra rows are filled as -1
| Pixel properties | Quadrant properties | ||||||
|---|---|---|---|---|---|---|---|
| Quadrant | DetID | PixID | Counts | Sigma | Mean | Median | Sigma |
| A | 13 | 251 | 168829 | 941.24 | 862 | 844 | 178.5 |
| A | 0 | 50 | 60954 | 336.8 | 862 | 844 | 178.5 |
| A | 8 | 15 | 18864 | 100.97 | 862 | 844 | 178.5 |
| B | 15 | 204 | 76401 | 445.47 | 870 | 847 | 169.6 |
| B | 8 | 3 | 34265 | 197.03 | 870 | 847 | 169.6 |
| B | 14 | 167 | 28385 | 162.37 | 870 | 847 | 169.6 |
| C | 9 | 247 | 890579 | 4566.29 | 834 | 841 | 194.8 |
| C | 9 | 16 | 414155 | 2121.2 | 834 | 841 | 194.8 |
| C | 10 | 65 | 48358 | 243.87 | 834 | 841 | 194.8 |
| D | 2 | 136 | 134598 | 660.47 | 835 | 814 | 202.6 |
| D | 13 | 223 | 79916 | 390.51 | 835 | 814 | 202.6 |
| D | 13 | 239 | 70659 | 344.81 | 835 | 814 | 202.6 |
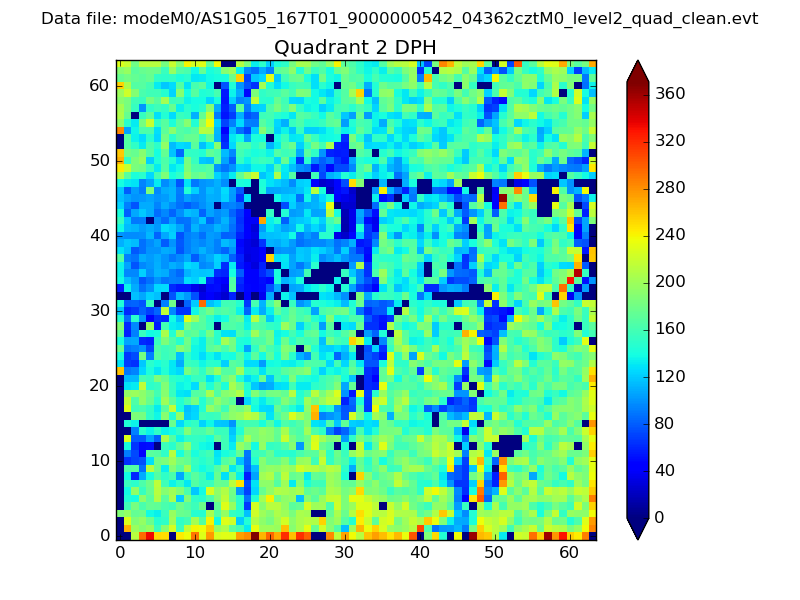
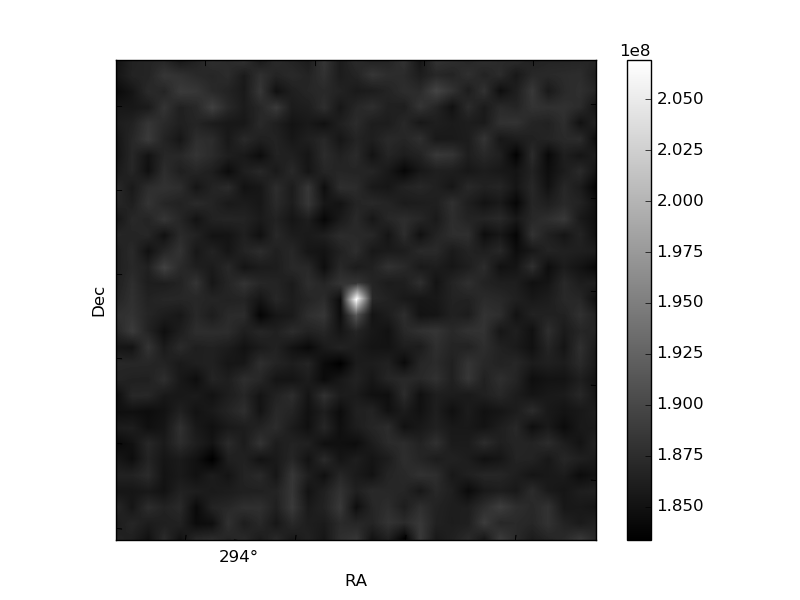
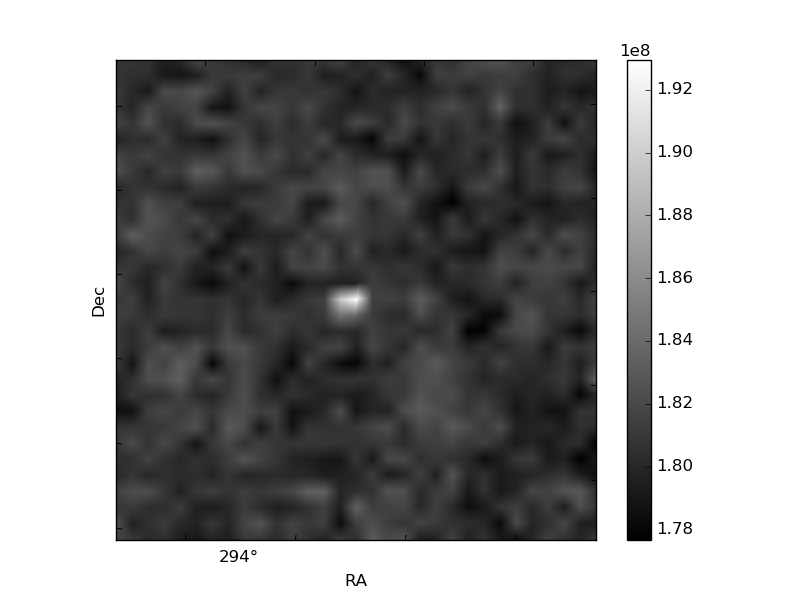
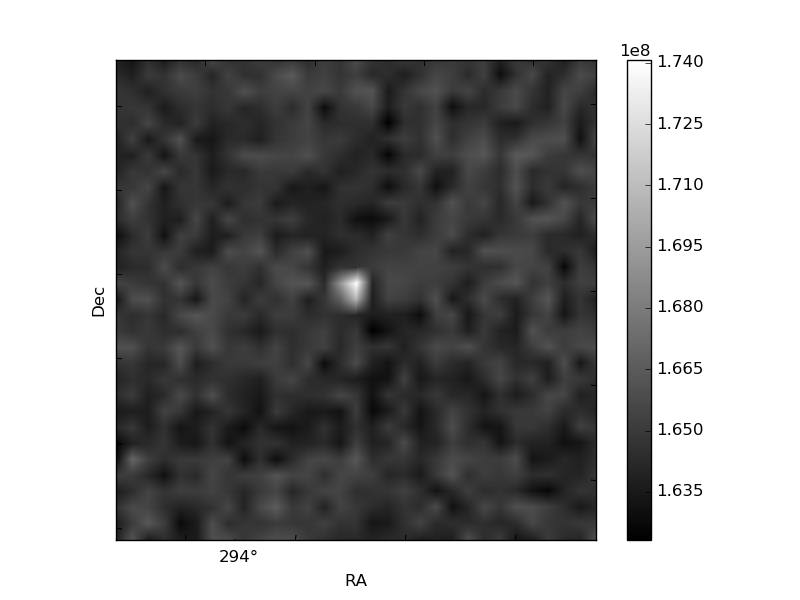
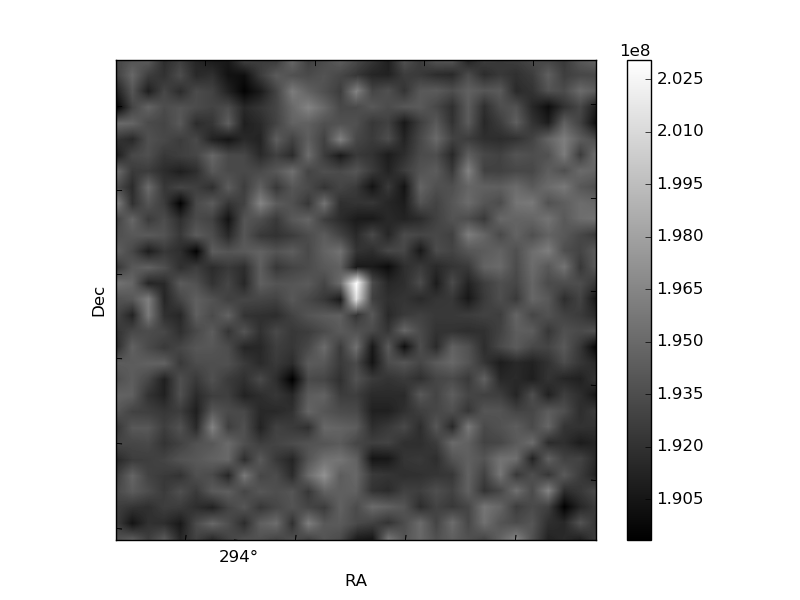
Histogram calculated using DETX and DETY for each event in the final _common_clean file
| Quadrant A | 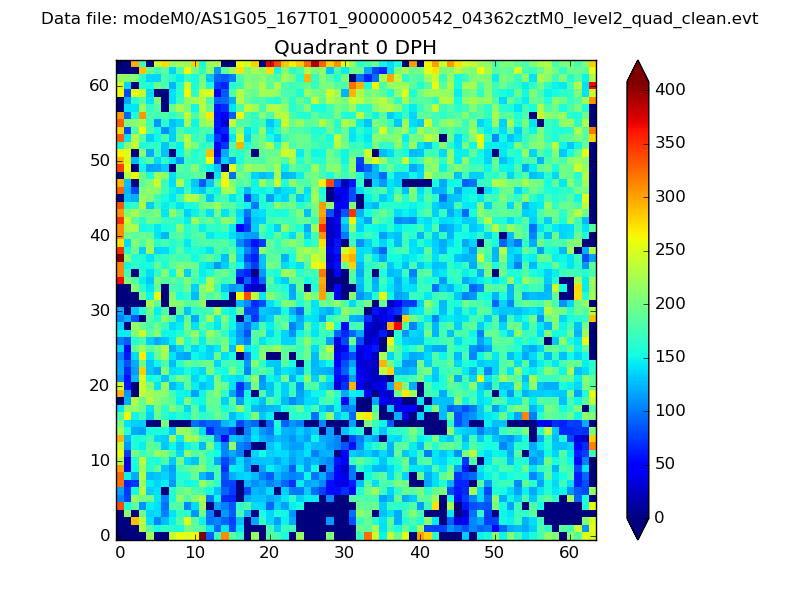 |
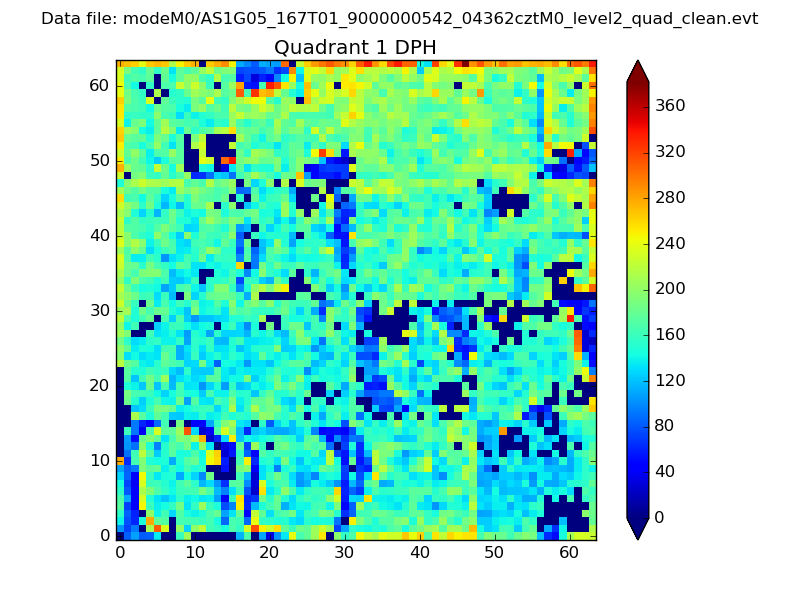 |
Quadrant B |
|---|---|---|---|
| Quadrant D | 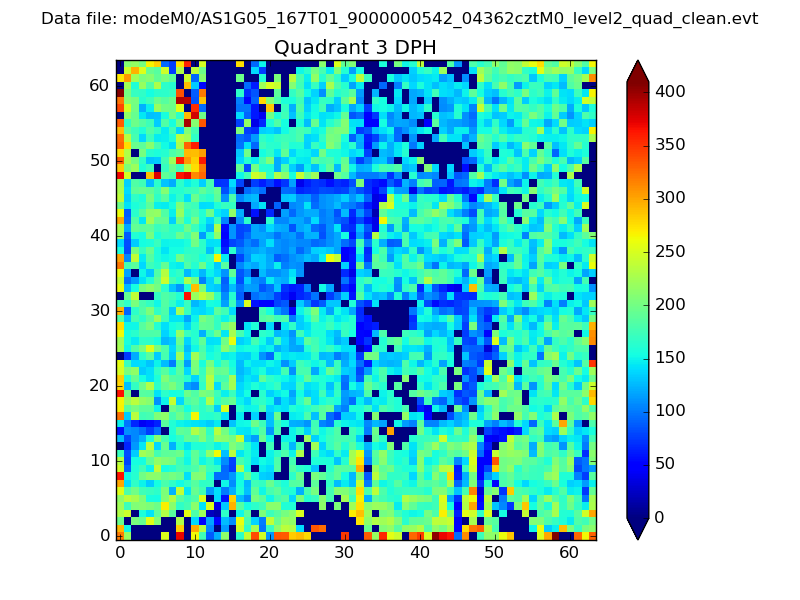 |
 |
Quadrant C |
| Plot type | Count rate plots | Images |
|---|---|---|
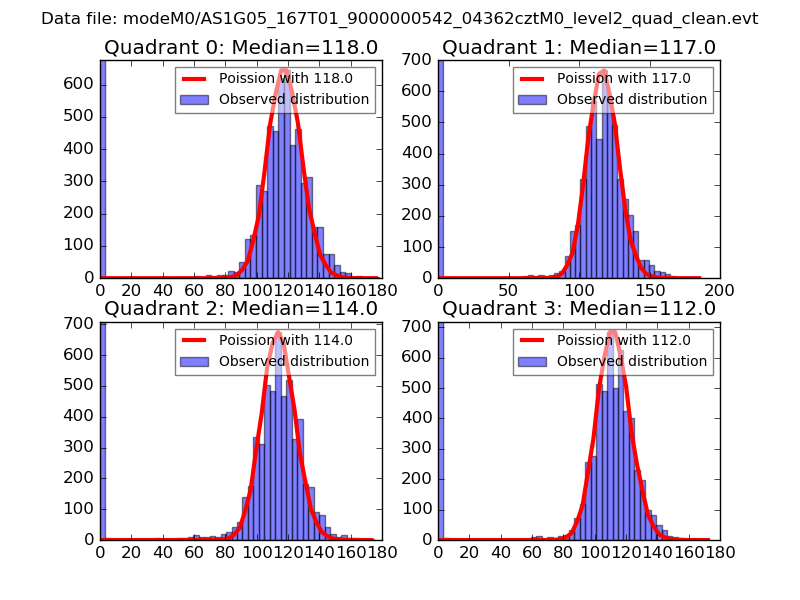
| Comparison with Poisson distribution Blue bars denote a histogram of data divided into 1 sec bins. Red curve is a Poisson curve with rate = median count rate of data. |
 |
 |
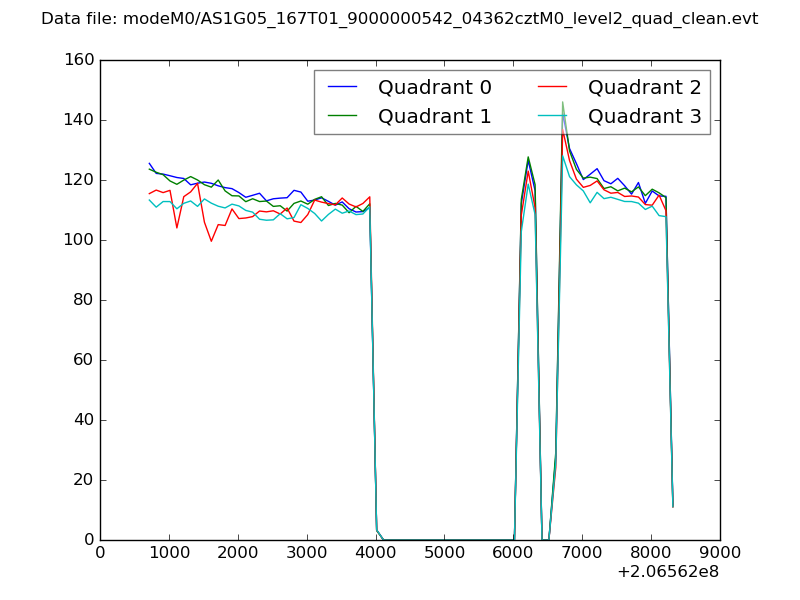
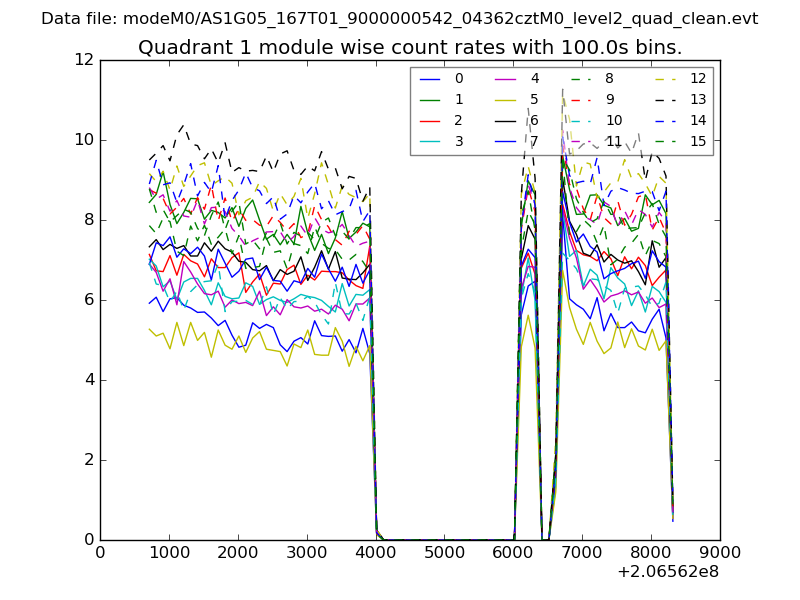
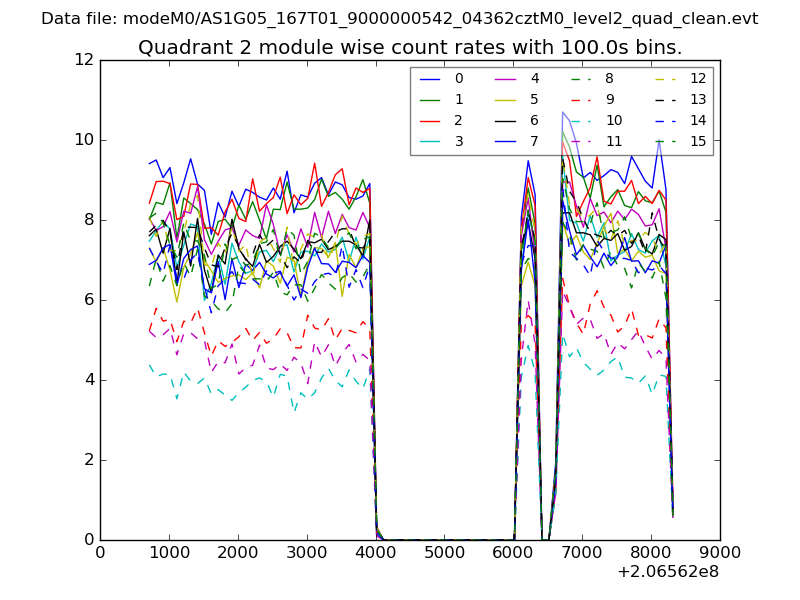
| Quadrant-wise count rates Data is divided into 100 sec bins |
 |
|
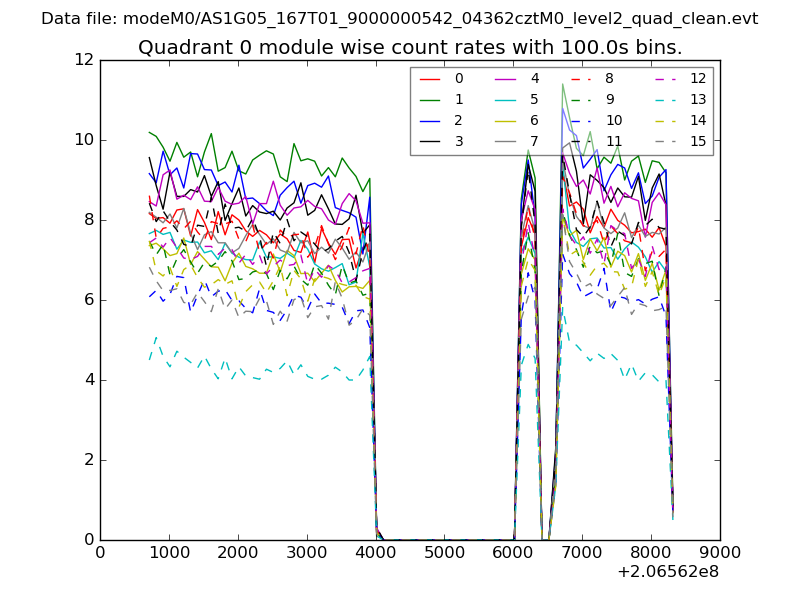
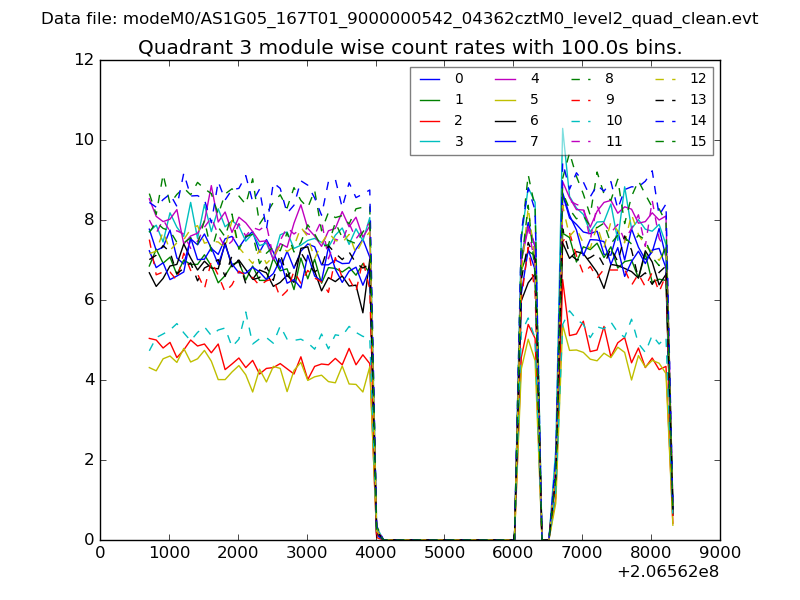
| Module-wise count rates for Quadrant A Data is divided into 100 sec bins |
 |
 |
| Module-wise count rates for Quadrant B Data is divided into 100 sec bins |
 |
 |
| Module-wise count rates for Quadrant C Data is divided into 100 sec bins |
 |
 |
| Module-wise count rates for Quadrant D Data is divided into 100 sec bins |
 |
 |
| Parameter | Plot |
|---|---|
| CZT HV Monitor | 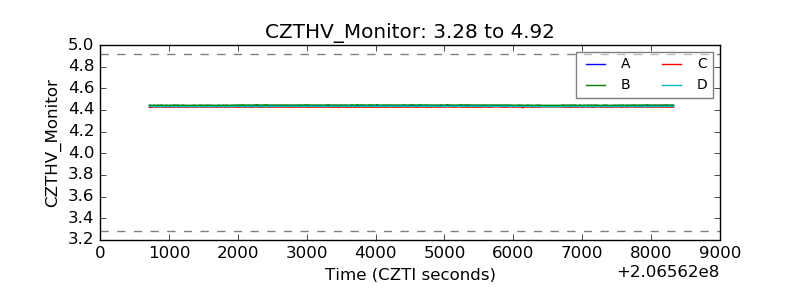 |
| D_VDD | 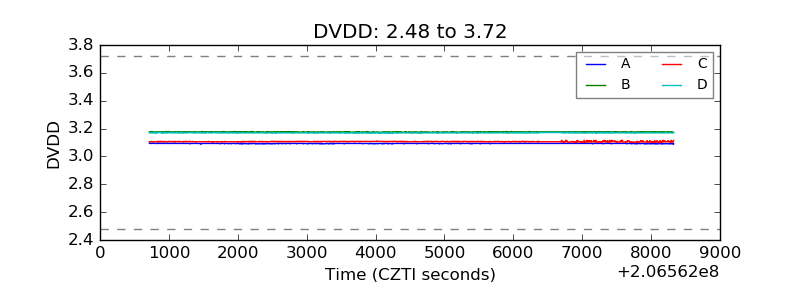 |
| Temperature 1 | 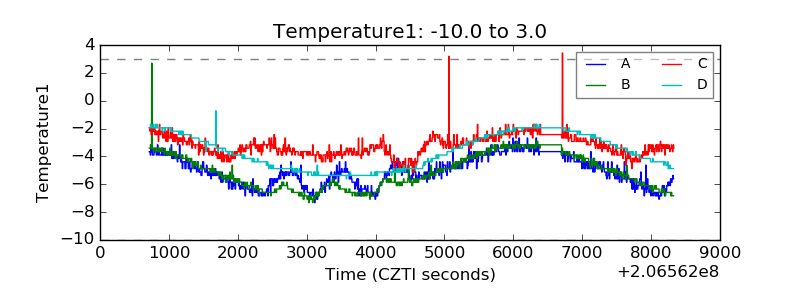 |
| Veto HV Monitor | 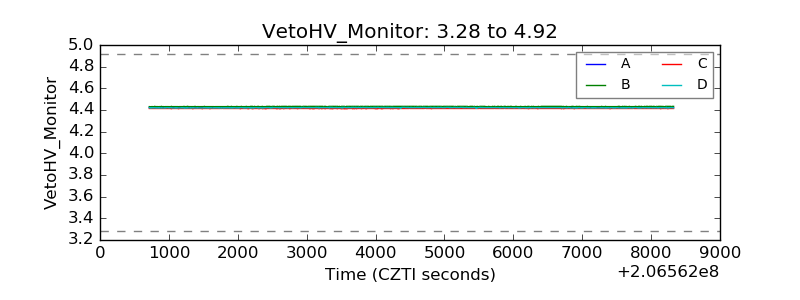 |
| Veto LLD | 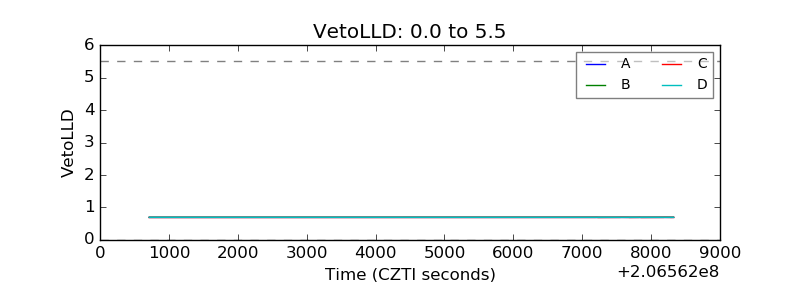 |
| Alpha Counter | 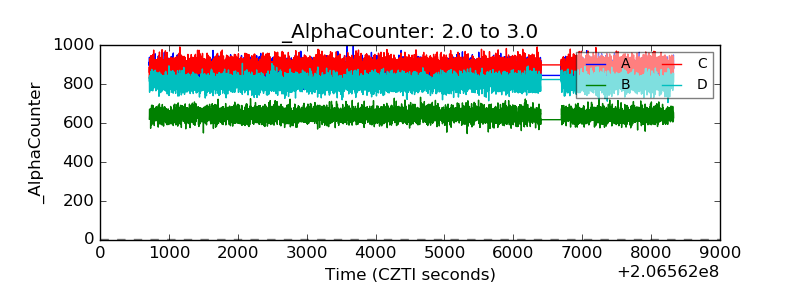 |
| _CPM_Rate | 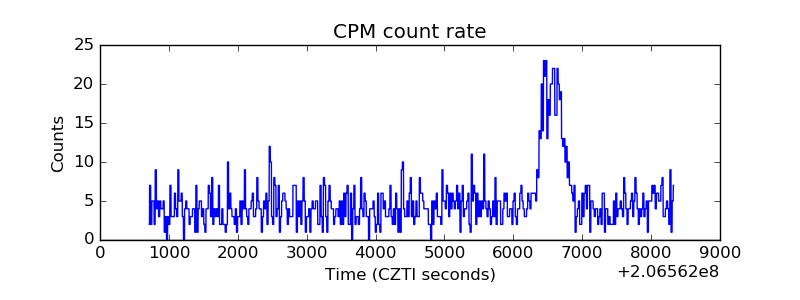 |
| CZT Counter | 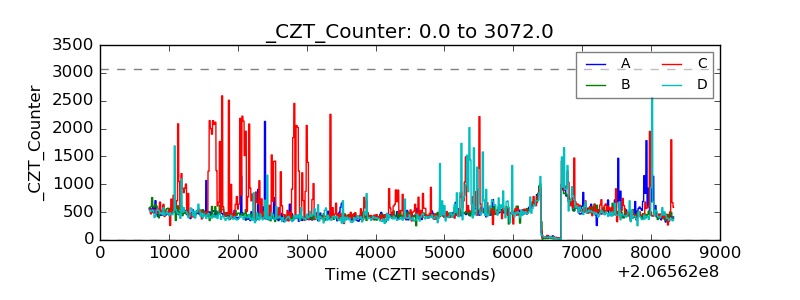 |
| +2.5 Volts monitor |  |
| +5 Volts monitor |  |
| _ROLL_ROT | 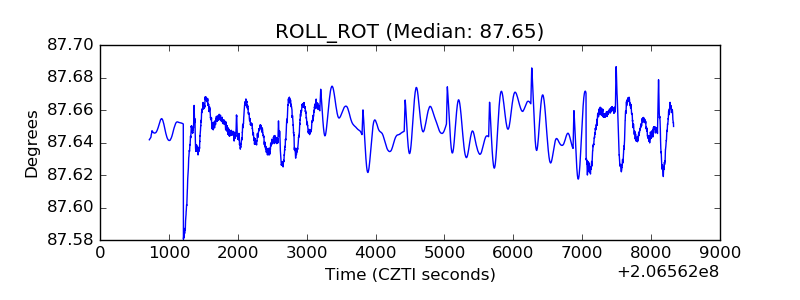 |
| _Roll_DEC | 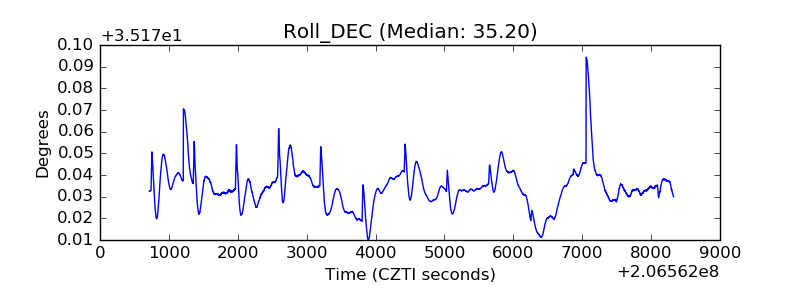 |
| _Roll_RA | 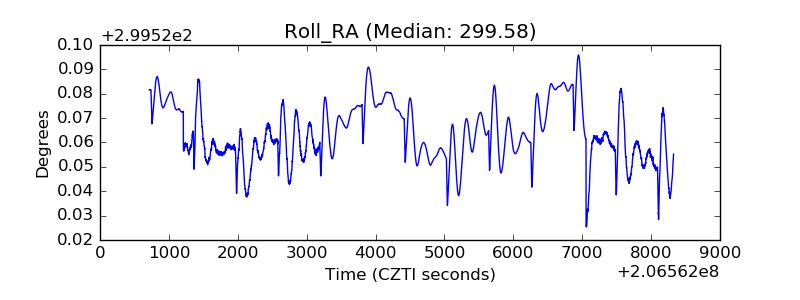 |
| Veto Counter | 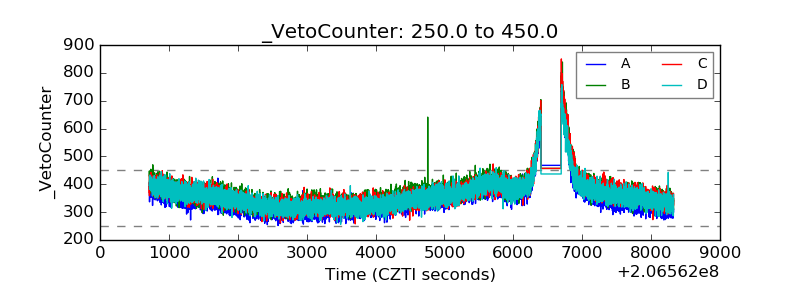 |