| Param | Original file | Final file |
|---|---|---|
| Filename | modeM0/AS1G05_252T01_9000000544_04365cztM0_level2.evt | modeM0/AS1G05_252T01_9000000544_04365cztM0_level2_quad_clean.evt |
| Size (bytes) | 856,546,560 | 113,967,360 |
| Size | 816.9 MB | 108.7 MB |
| Events in quadrant A | 6,002,316 | 673,362 |
| Events in quadrant B | 5,529,192 | 673,495 |
| Events in quadrant C | 7,563,884 | 644,856 |
| Events in quadrant D | 6,042,080 | 638,438 |
| Mode M0 | |||
|---|---|---|---|
| Quadrant | BADHDUFLAG | Total packets | Discarded packets |
| A | 0 | 25851 | 3 |
| B | 0 | 24547 | 2 |
| C | 0 | 30771 | 2 |
| D | 0 | 26599 | 2 |
| Mode SS | |||
|---|---|---|---|
| Quadrant | BADHDUFLAG | Total packets | Discarded packets |
| A | 0 | 244 | 0 |
| B | 0 | 244 | 0 |
| C | 0 | 244 | 0 |
| D | 0 | 244 | 0 |
| Mode M9 | |||
|---|---|---|---|
| Quadrant | BADHDUFLAG | Total packets | Discarded packets |
| A | 0 | 14 | 0 |
| B | 0 | 14 | 0 |
| C | 0 | 14 | 0 |
| D | 0 | 14 | 0 |
| Quadrant | Total seconds | Saturated seconds | Saturation percentage |
|---|---|---|---|
| A | 11858 | 85 | 0.716816% |
| B | 11858 | 52 | 0.438523% |
| C | 11858 | 308 | 2.597403% |
| D | 11858 | 163 | 1.374599% |
Noise dominated data is calculated using 1-second bins in cleaned event files. If a bin has >2000 counts, and if more than 50% of those come from <1% of pixels, then it is considered to be noise-dominated and hence unusable.
| Quadrant | # 1 sec bins | Bins with >0 counts | Bins with >2000 counts | High rate bins dominated by noise | Noise dominated (total time) | Noise dominated (detector-on time) | Marked lightcurve |
|---|---|---|---|---|---|---|---|
| A | 13328 | 11858 | 30 | 30 | 0.23% | 0.25% | 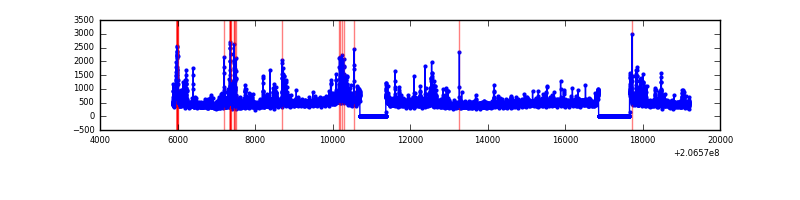 |
| B | 13328 | 11858 | 5 | 5 | 0.04% | 0.04% | 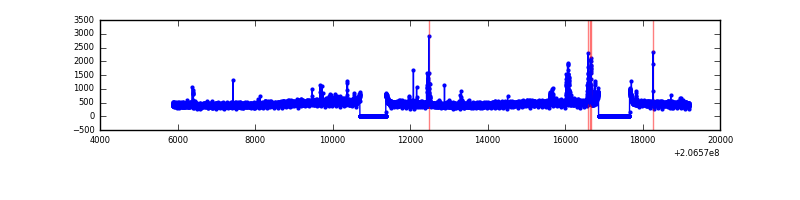 |
| C | 13328 | 11859 | 285 | 285 | 2.14% | 2.40% | 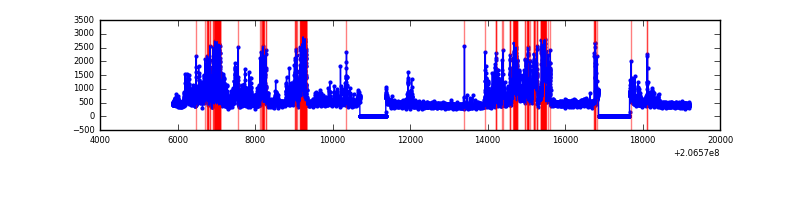 |
| D | 13328 | 11859 | 110 | 110 | 0.83% | 0.93% | 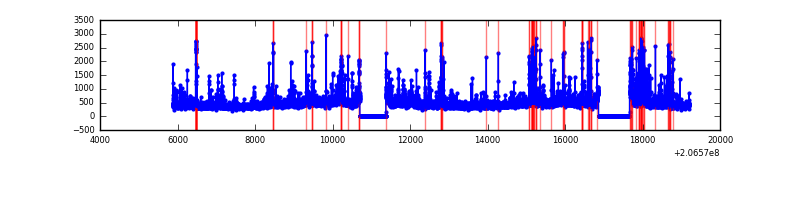 |
Top three noisy pixels from each quadrant. If the there are fewer than three noisy pixels in the level2.evt file, extra rows are filled as -1
| Pixel properties | Quadrant properties | ||||||
|---|---|---|---|---|---|---|---|
| Quadrant | DetID | PixID | Counts | Sigma | Mean | Median | Sigma |
| A | 13 | 251 | 652261 | 2335.47 | 1354 | 1321 | 278.7 |
| A | 8 | 15 | 41840 | 145.38 | 1354 | 1321 | 278.7 |
| A | 15 | 234 | 38975 | 135.1 | 1354 | 1321 | 278.7 |
| B | 14 | 167 | 145382 | 546.91 | 1368 | 1335 | 263.4 |
| B | 0 | 183 | 32487 | 118.28 | 1368 | 1335 | 263.4 |
| B | 12 | 111 | 23020 | 82.33 | 1368 | 1335 | 263.4 |
| C | 9 | 247 | 2332995 | 7641.21 | 1295 | 1299 | 305.1 |
| C | 14 | 48 | 121354 | 393.43 | 1295 | 1299 | 305.1 |
| C | 12 | 4 | 41536 | 131.86 | 1295 | 1299 | 305.1 |
| D | 4 | 95 | 407764 | 1290.92 | 1295 | 1255 | 314.9 |
| D | 2 | 63 | 158291 | 498.69 | 1295 | 1255 | 314.9 |
| D | 2 | 136 | 155242 | 489.01 | 1295 | 1255 | 314.9 |
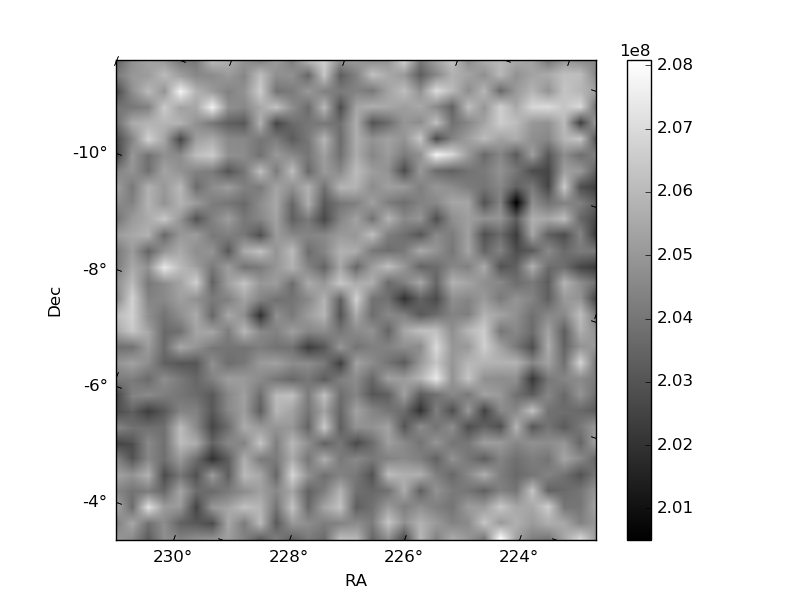
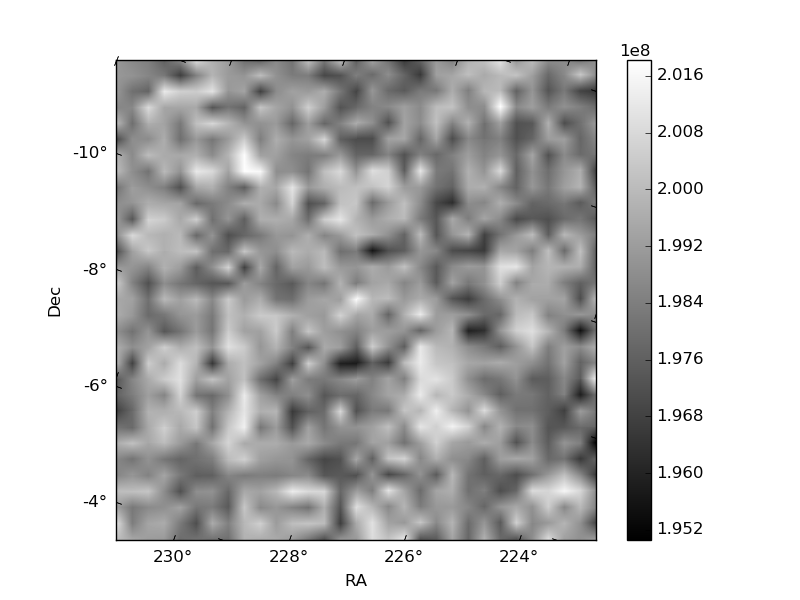
Histogram calculated using DETX and DETY for each event in the final _common_clean file
| Quadrant A |  |
 |
Quadrant B |
|---|---|---|---|
| Quadrant D | 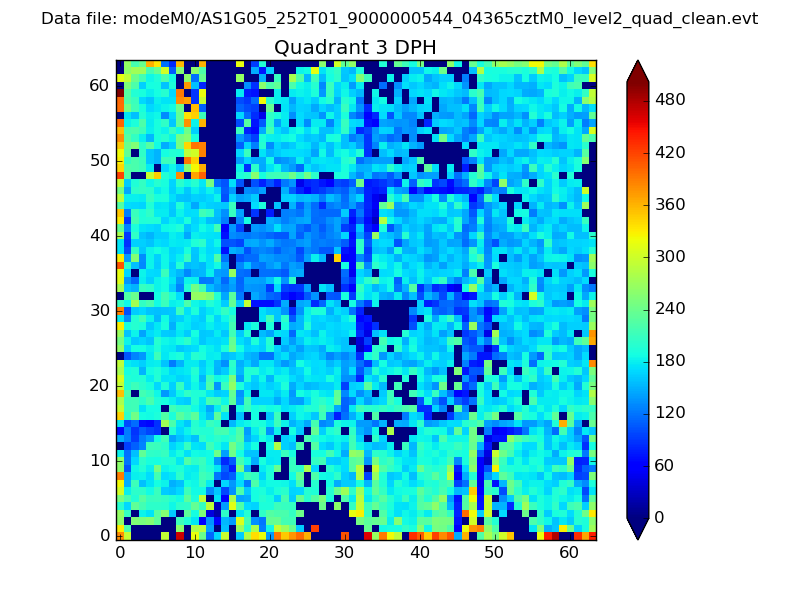 |
 |
Quadrant C |
| Plot type | Count rate plots | Images |
|---|---|---|
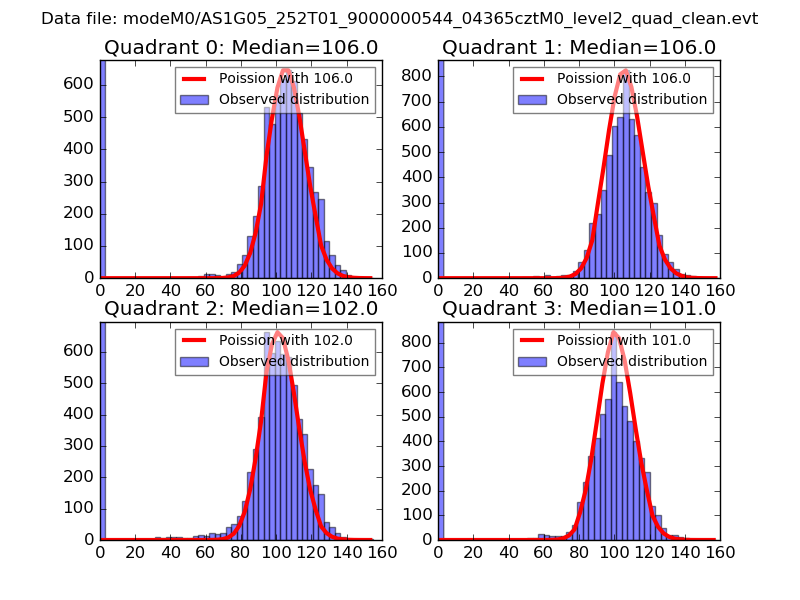
| Comparison with Poisson distribution Blue bars denote a histogram of data divided into 1 sec bins. Red curve is a Poisson curve with rate = median count rate of data. |
 |
 |
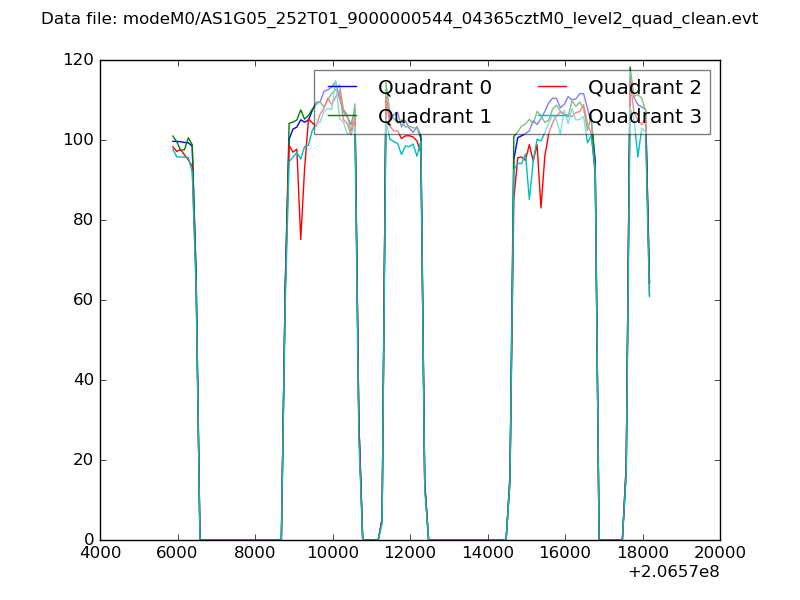
| Quadrant-wise count rates Data is divided into 100 sec bins |
 |
|
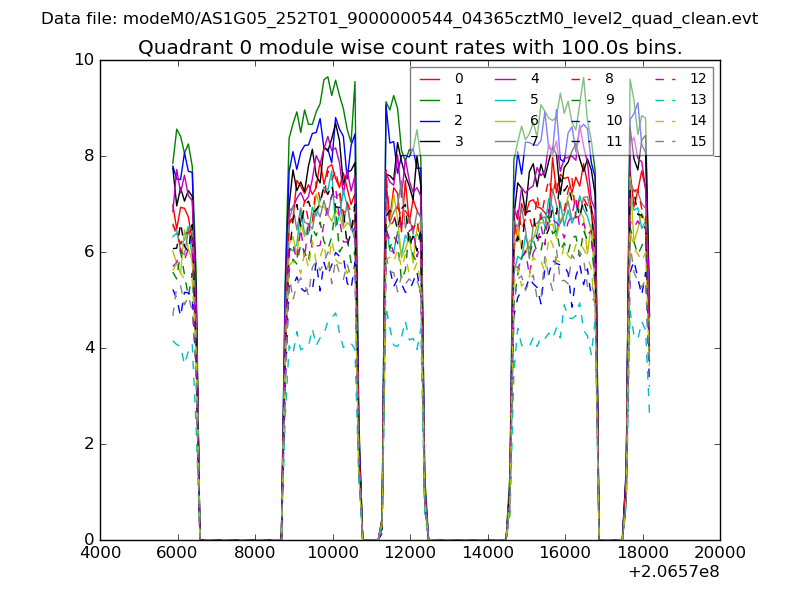
| Module-wise count rates for Quadrant A Data is divided into 100 sec bins |
 |
 |
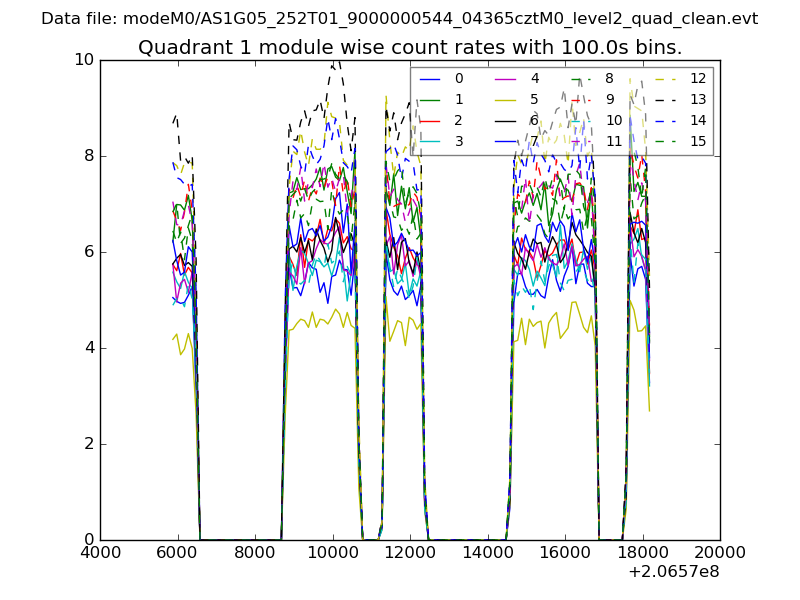
| Module-wise count rates for Quadrant B Data is divided into 100 sec bins |
 |
 |
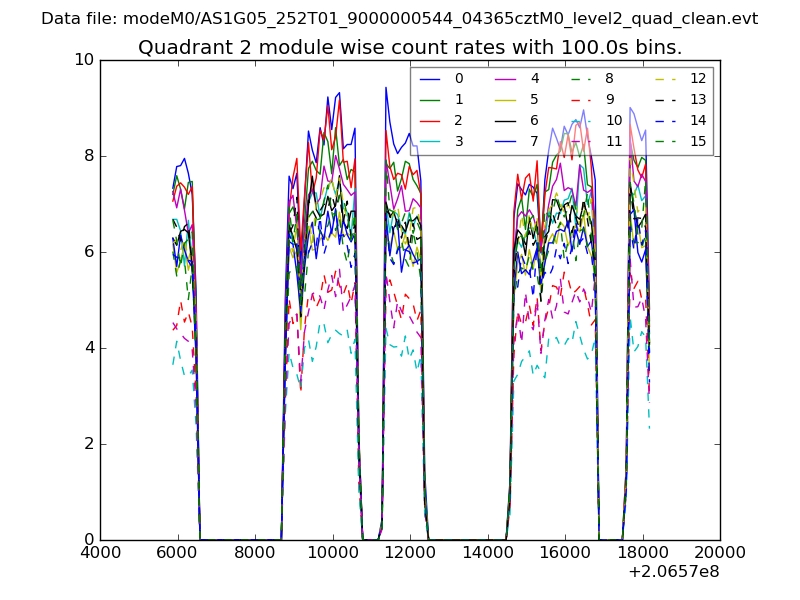
| Module-wise count rates for Quadrant C Data is divided into 100 sec bins |
 |
 |
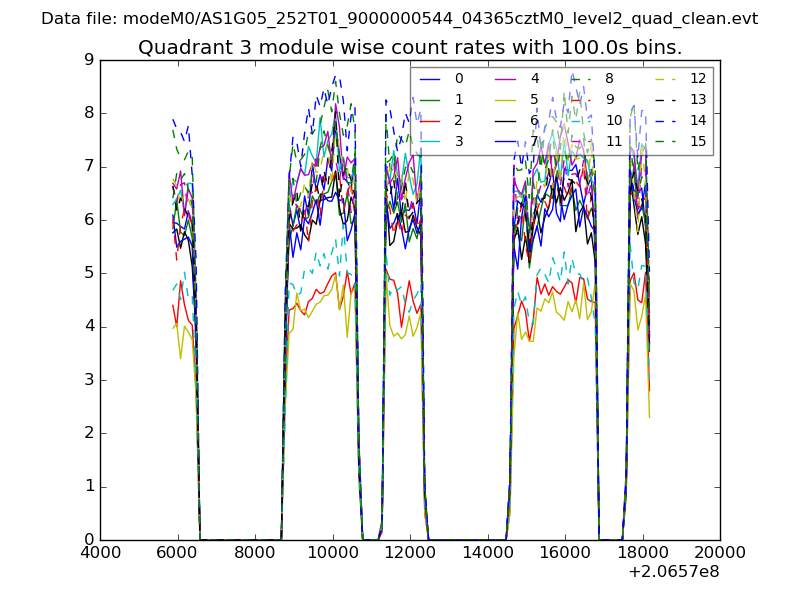
| Module-wise count rates for Quadrant D Data is divided into 100 sec bins |
 |
 |
| Parameter | Plot |
|---|---|
| CZT HV Monitor | 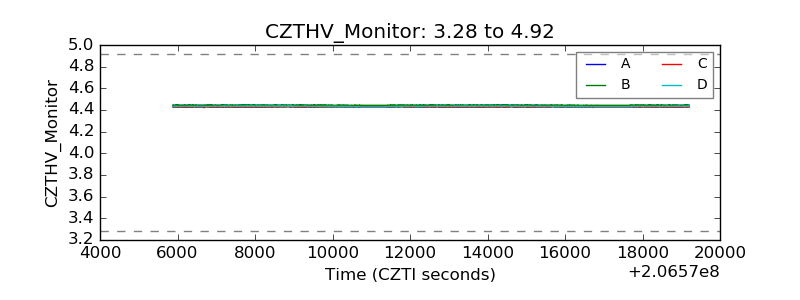 |
| D_VDD | 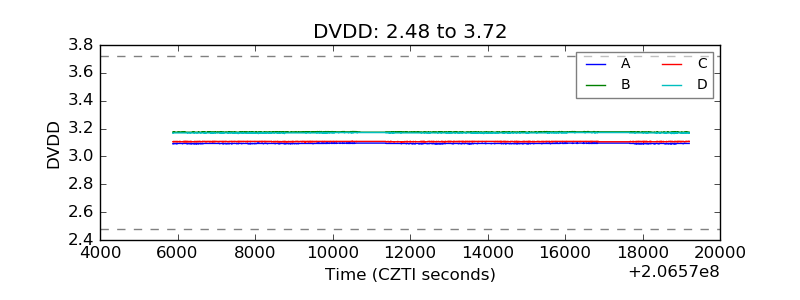 |
| Temperature 1 | 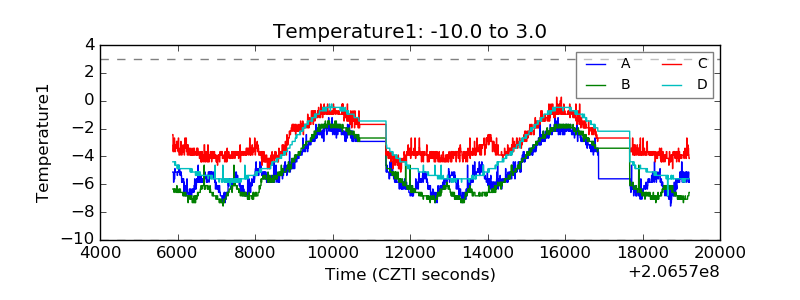 |
| Veto HV Monitor |  |
| Veto LLD | 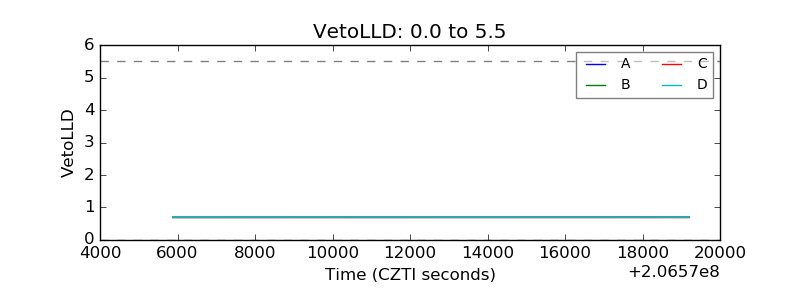 |
| Alpha Counter | 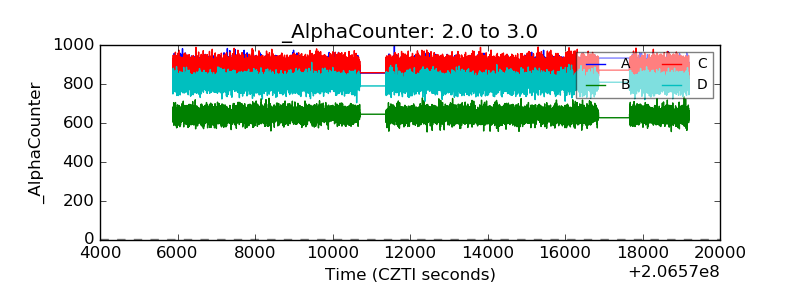 |
| _CPM_Rate | 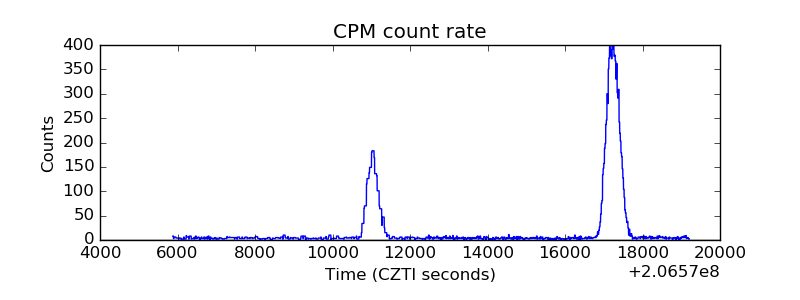 |
| CZT Counter |  |
| +2.5 Volts monitor |  |
| +5 Volts monitor |  |
| _ROLL_ROT | 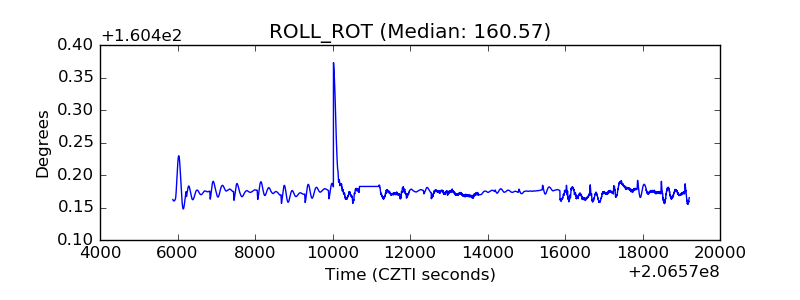 |
| _Roll_DEC | 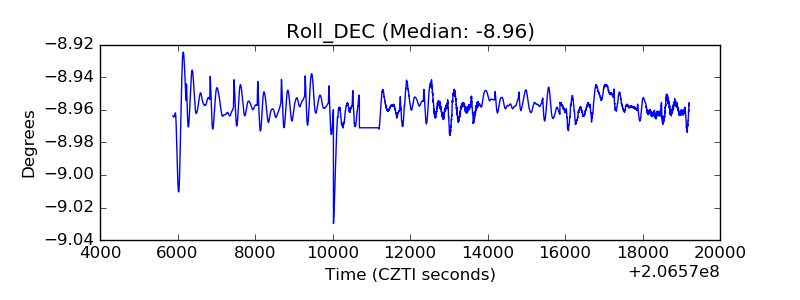 |
| _Roll_RA |  |
| Veto Counter | 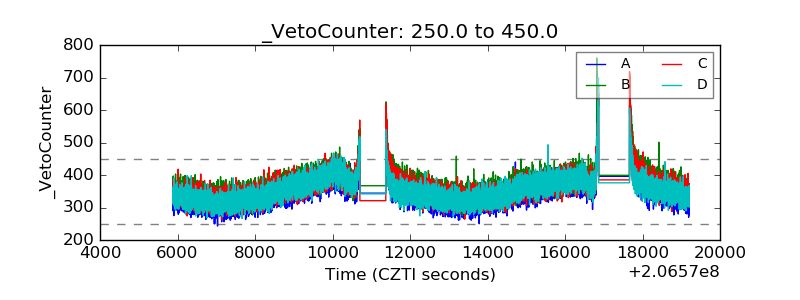 |