| Param | Original file | Final file |
|---|---|---|
| Filename | modeM0/AS1G05_252T01_9000000544_04366cztM0_level2.evt | modeM0/AS1G05_252T01_9000000544_04366cztM0_level2_quad_clean.evt |
| Size (bytes) | 511,035,840 | 62,003,520 |
| Size | 487.4 MB | 59.1 MB |
| Events in quadrant A | 4,654,314 | 349,408 |
| Events in quadrant B | 3,295,900 | 358,139 |
| Events in quadrant C | 3,394,051 | 348,213 |
| Events in quadrant D | 3,663,988 | 340,391 |
| Mode M0 | |||
|---|---|---|---|
| Quadrant | BADHDUFLAG | Total packets | Discarded packets |
| A | 0 | 18503 | 3 |
| B | 0 | 14389 | 2 |
| C | 0 | 14878 | 2 |
| D | 0 | 15878 | 2 |
| Mode SS | |||
|---|---|---|---|
| Quadrant | BADHDUFLAG | Total packets | Discarded packets |
| A | 0 | 142 | 0 |
| B | 0 | 142 | 0 |
| C | 0 | 142 | 0 |
| D | 0 | 142 | 0 |
| Mode M9 | |||
|---|---|---|---|
| Quadrant | BADHDUFLAG | Total packets | Discarded packets |
| A | 0 | 17 | 0 |
| B | 0 | 17 | 0 |
| C | 0 | 17 | 0 |
| D | 0 | 17 | 0 |
| Quadrant | Total seconds | Saturated seconds | Saturation percentage |
|---|---|---|---|
| A | 6903 | 254 | 3.679560% |
| B | 6903 | 71 | 1.028538% |
| C | 6903 | 70 | 1.014052% |
| D | 6903 | 127 | 1.839780% |
Noise dominated data is calculated using 1-second bins in cleaned event files. If a bin has >2000 counts, and if more than 50% of those come from <1% of pixels, then it is considered to be noise-dominated and hence unusable.
| Quadrant | # 1 sec bins | Bins with >0 counts | Bins with >2000 counts | High rate bins dominated by noise | Noise dominated (total time) | Noise dominated (detector-on time) | Marked lightcurve |
|---|---|---|---|---|---|---|---|
| A | 8683 | 6903 | 130 | 130 | 1.50% | 1.88% | 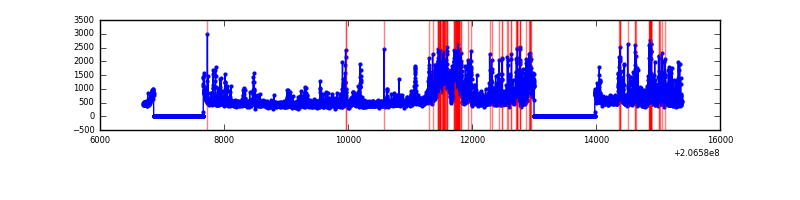 |
| B | 8683 | 6903 | 4 | 4 | 0.05% | 0.06% | 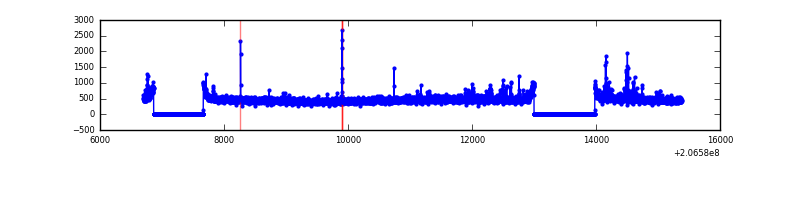 |
| C | 8683 | 6903 | 33 | 33 | 0.38% | 0.48% |  |
| D | 8683 | 6903 | 89 | 89 | 1.02% | 1.29% | 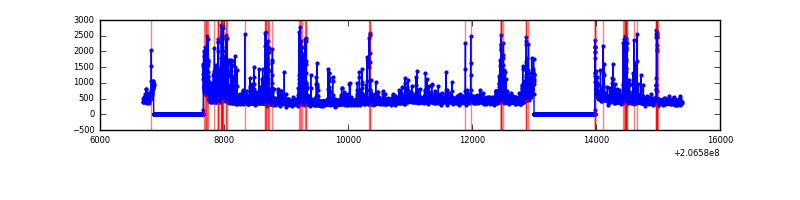 |
Top three noisy pixels from each quadrant. If the there are fewer than three noisy pixels in the level2.evt file, extra rows are filled as -1
| Pixel properties | Quadrant properties | ||||||
|---|---|---|---|---|---|---|---|
| Quadrant | DetID | PixID | Counts | Sigma | Mean | Median | Sigma |
| A | 13 | 251 | 1512215 | 9157.53 | 803 | 785 | 165.0 |
| A | 8 | 15 | 19521 | 113.52 | 803 | 785 | 165.0 |
| A | 0 | 50 | 18285 | 106.03 | 803 | 785 | 165.0 |
| B | 14 | 167 | 69645 | 432.83 | 818 | 799 | 159.1 |
| B | 5 | 200 | 26547 | 161.88 | 818 | 799 | 159.1 |
| B | 0 | 183 | 19595 | 118.17 | 818 | 799 | 159.1 |
| C | 9 | 247 | 307652 | 1681.57 | 778 | 781 | 182.5 |
| C | 10 | 65 | 27635 | 147.15 | 778 | 781 | 182.5 |
| C | 14 | 48 | 8290 | 41.15 | 778 | 781 | 182.5 |
| D | 4 | 95 | 366516 | 1928.63 | 773 | 750 | 189.7 |
| D | 2 | 136 | 133804 | 701.57 | 773 | 750 | 189.7 |
| D | 13 | 223 | 74277 | 387.7 | 773 | 750 | 189.7 |
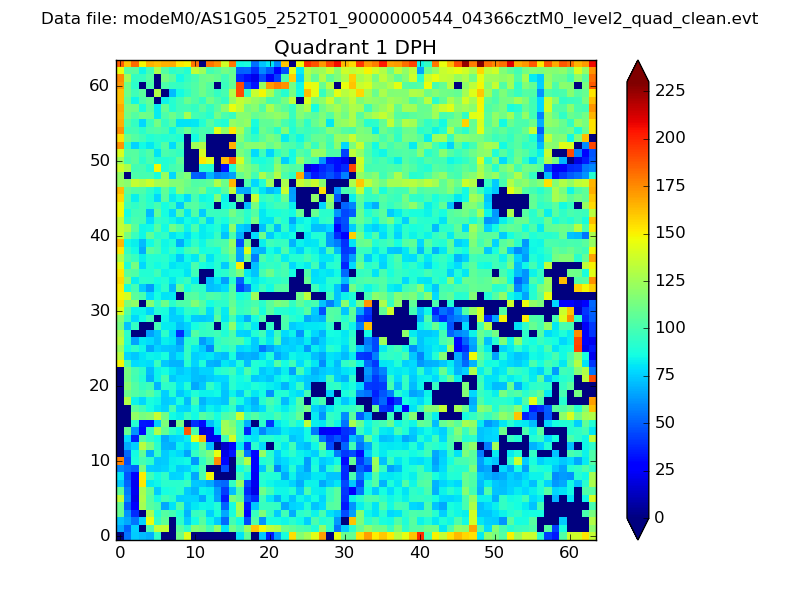
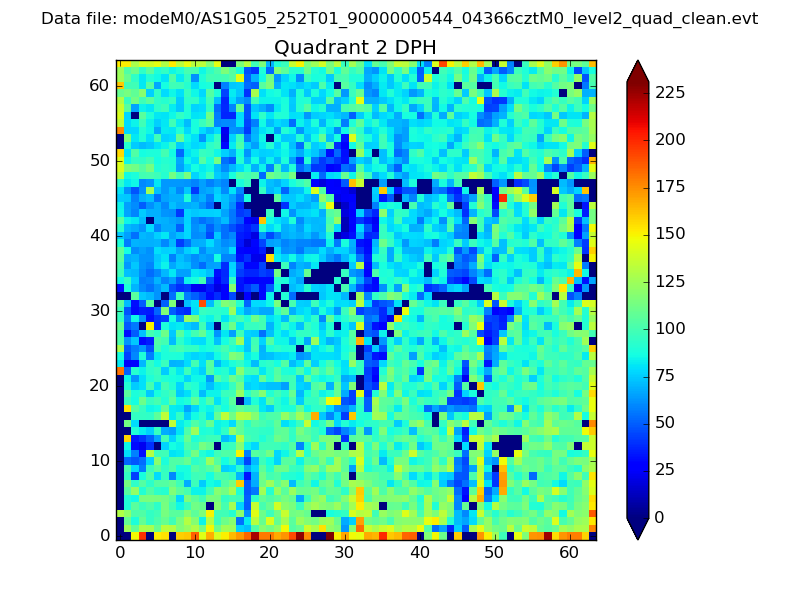
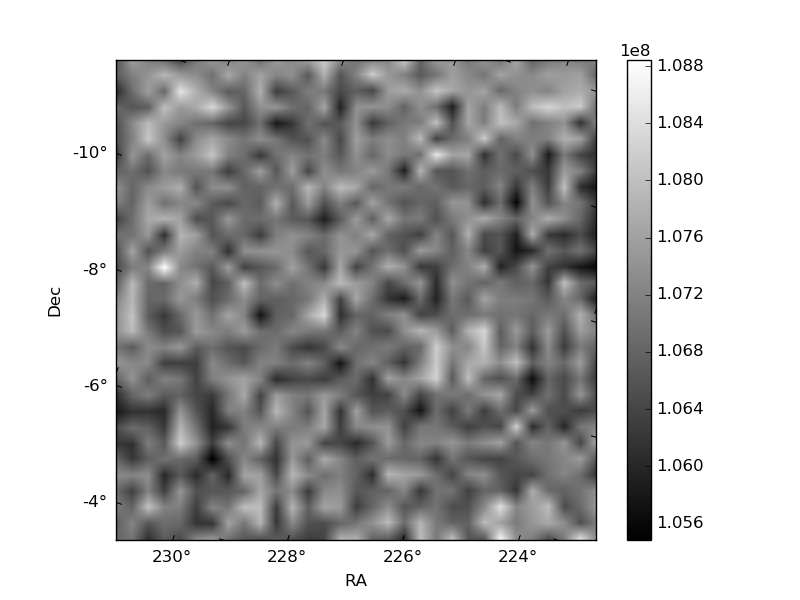
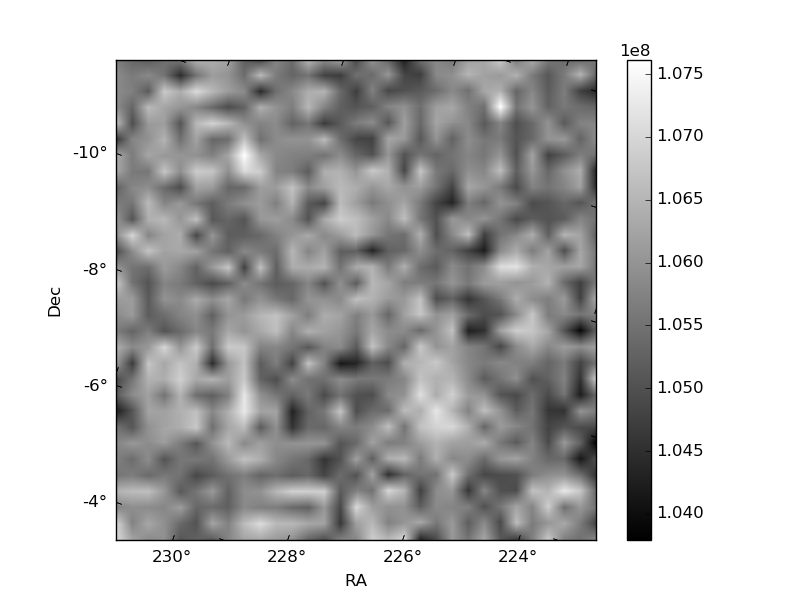
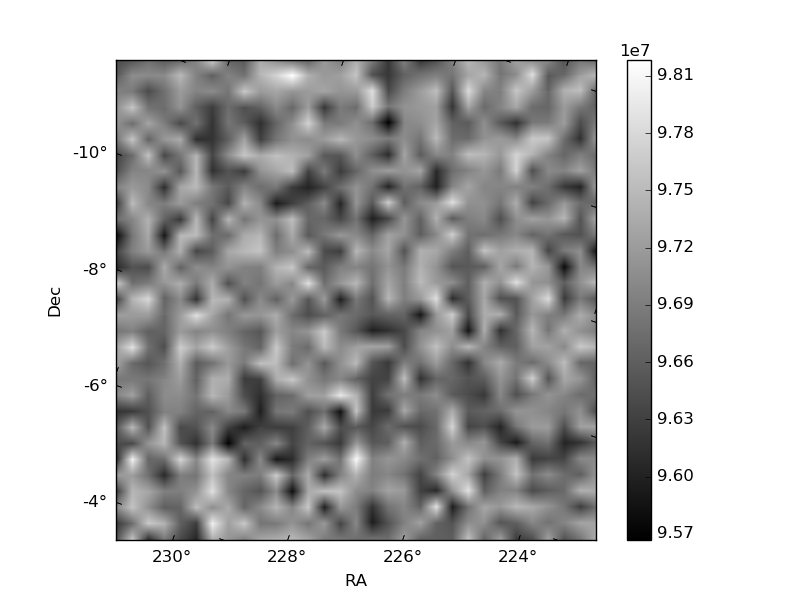
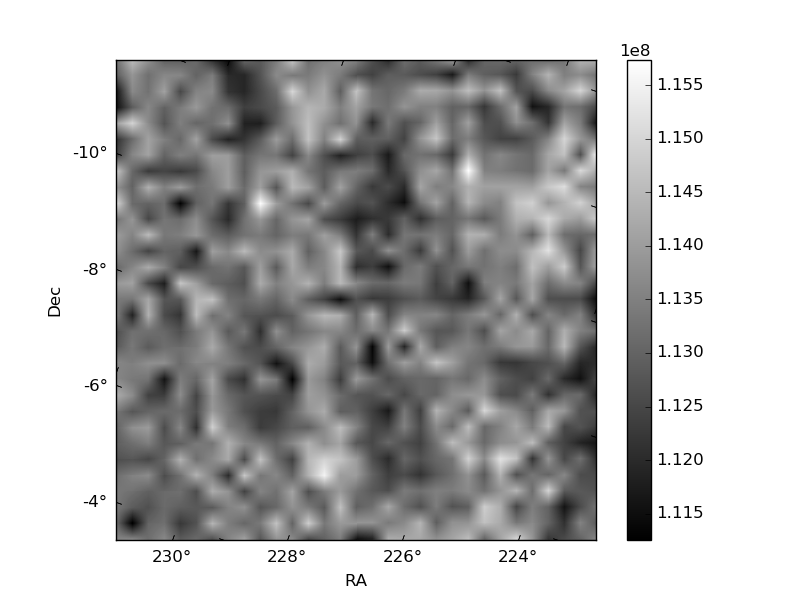
Histogram calculated using DETX and DETY for each event in the final _common_clean file
| Quadrant A | 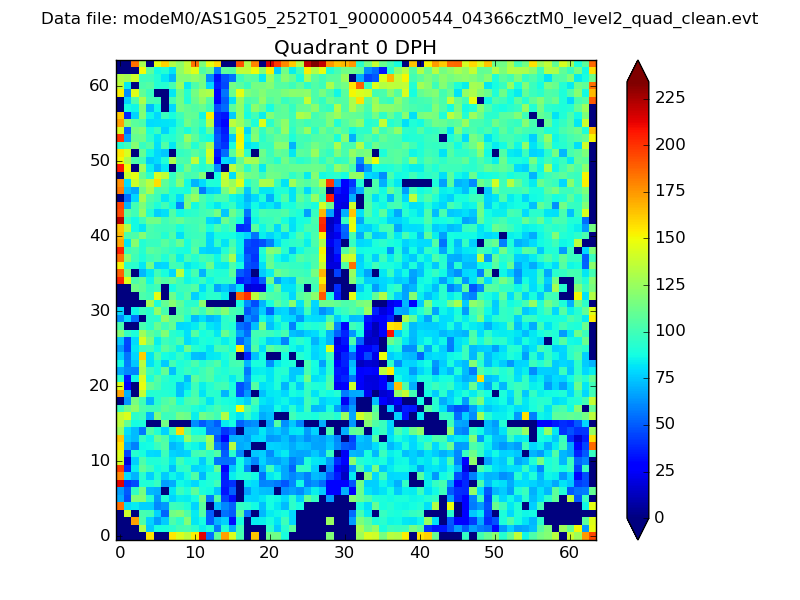 |
 |
Quadrant B |
|---|---|---|---|
| Quadrant D |  |
 |
Quadrant C |
| Plot type | Count rate plots | Images |
|---|---|---|
| Comparison with Poisson distribution Blue bars denote a histogram of data divided into 1 sec bins. Red curve is a Poisson curve with rate = median count rate of data. |
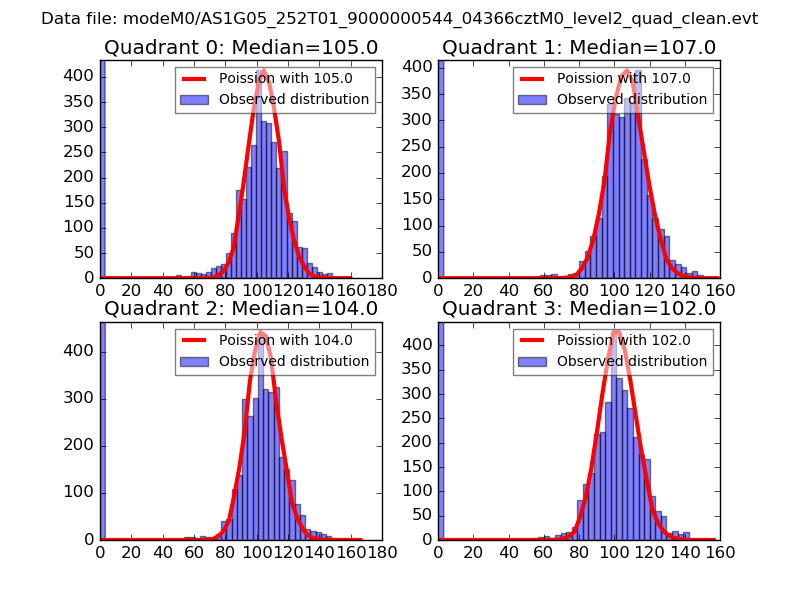 |
 |
| Quadrant-wise count rates Data is divided into 100 sec bins |
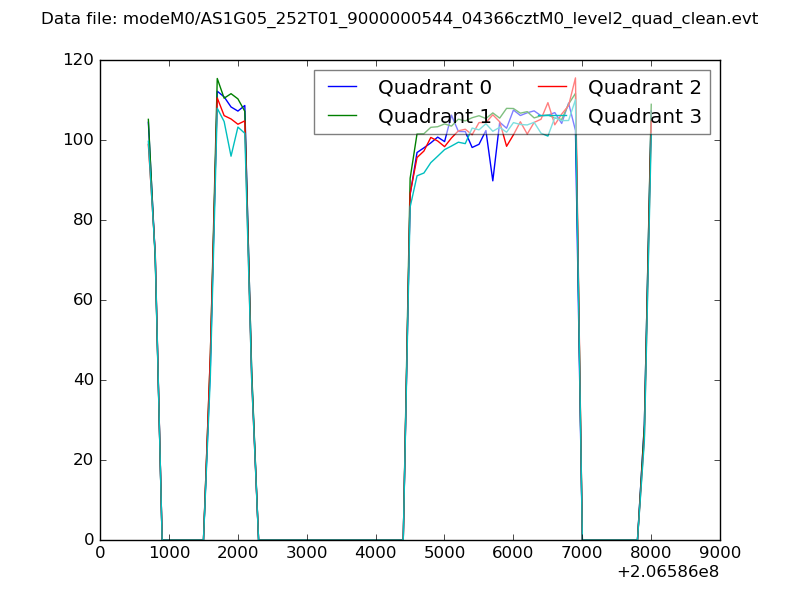 |
|
| Module-wise count rates for Quadrant A Data is divided into 100 sec bins |
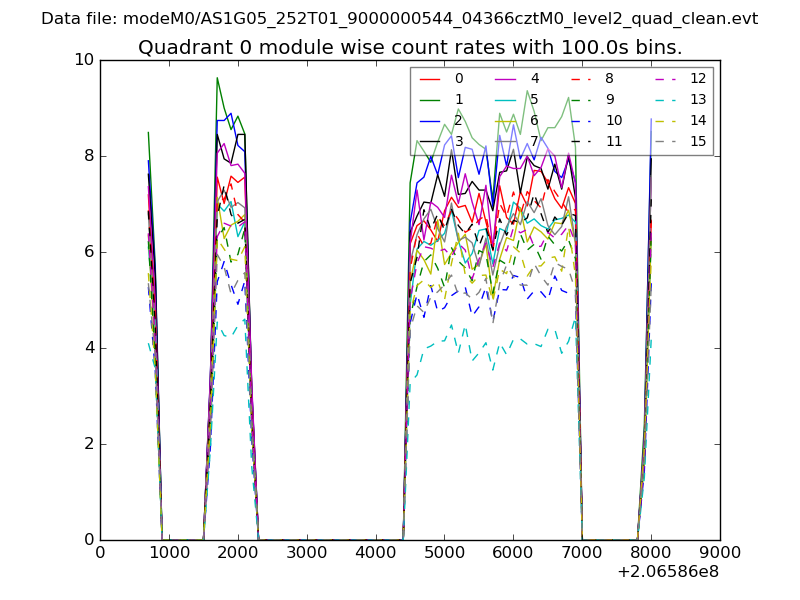 |
 |
| Module-wise count rates for Quadrant B Data is divided into 100 sec bins |
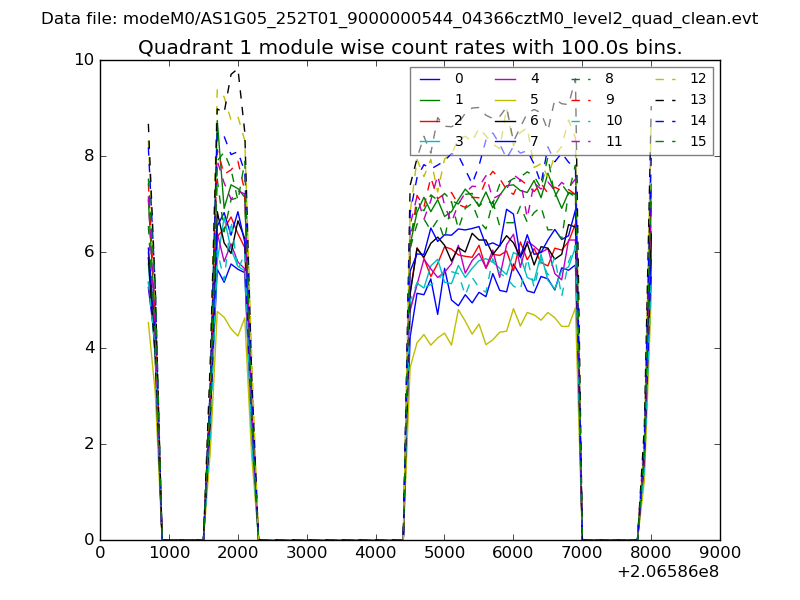 |
 |
| Module-wise count rates for Quadrant C Data is divided into 100 sec bins |
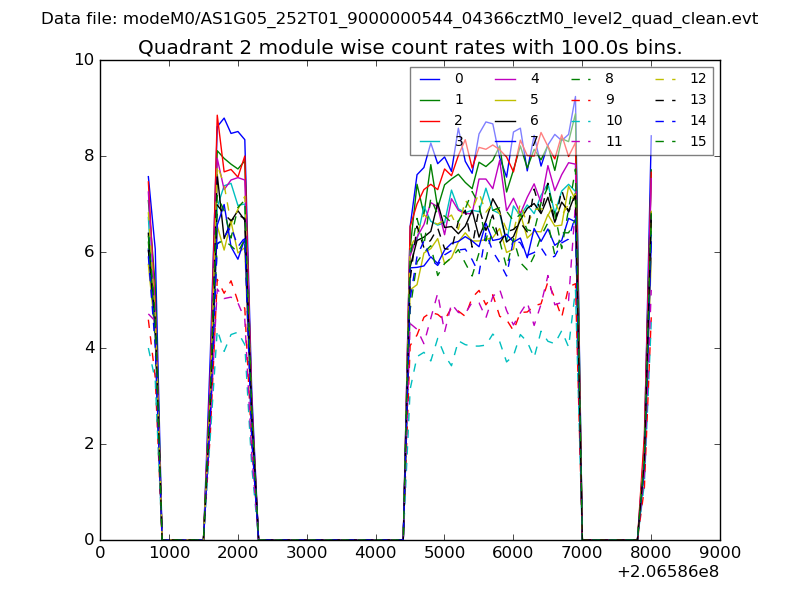 |
 |
| Module-wise count rates for Quadrant D Data is divided into 100 sec bins |
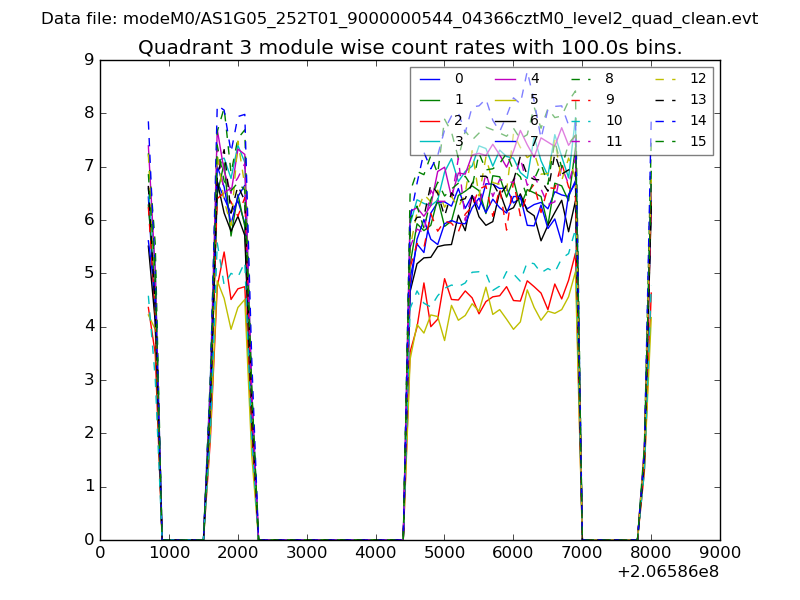 |
 |
| Parameter | Plot |
|---|---|
| CZT HV Monitor | 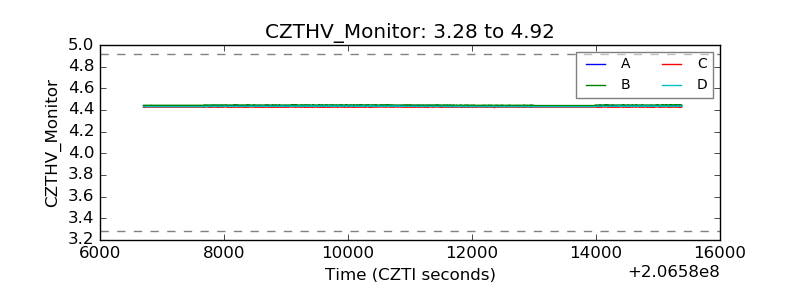 |
| D_VDD | 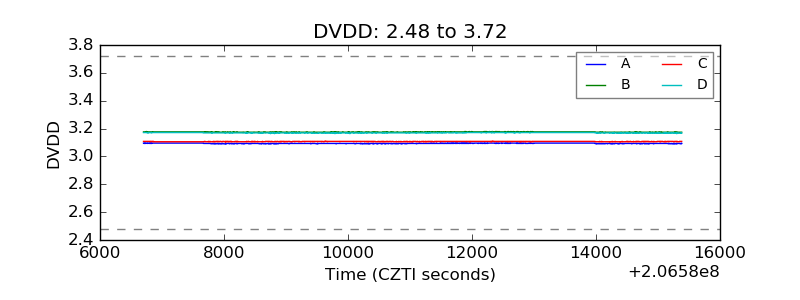 |
| Temperature 1 | 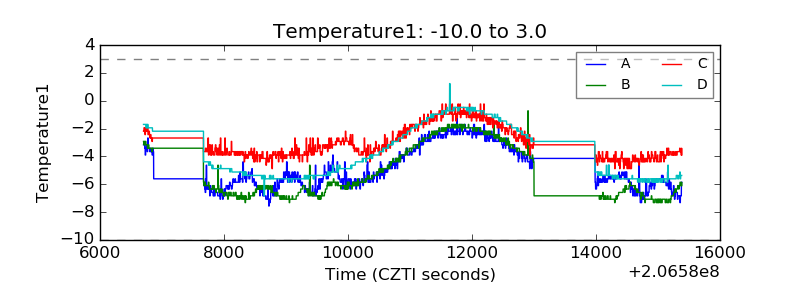 |
| Veto HV Monitor | 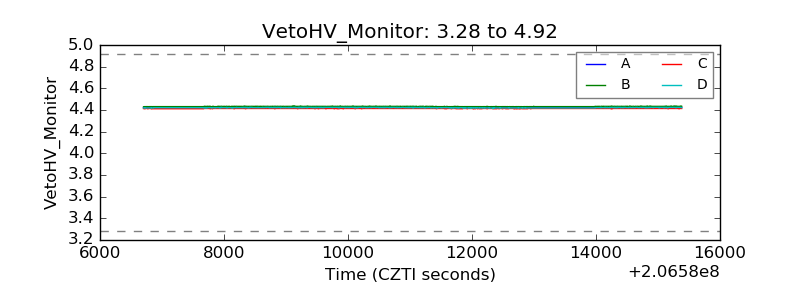 |
| Veto LLD | 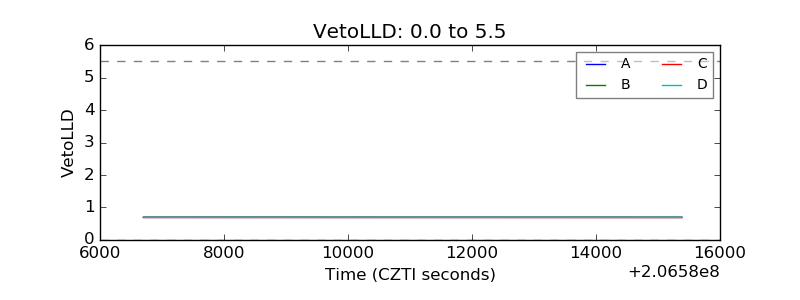 |
| Alpha Counter | 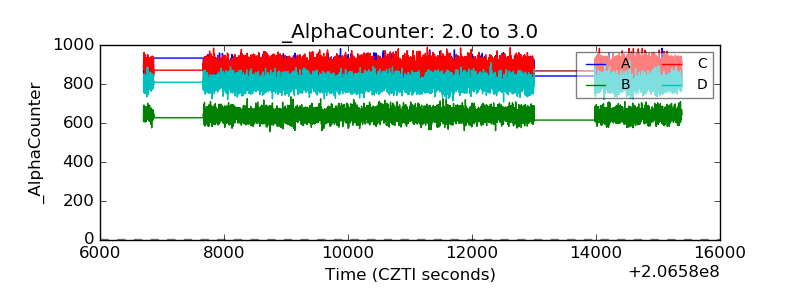 |
| _CPM_Rate | 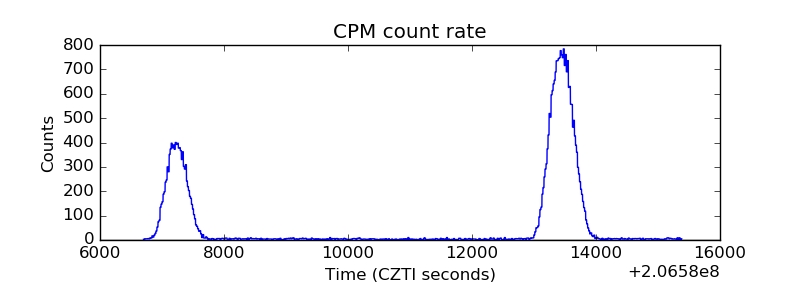 |
| CZT Counter |  |
| +2.5 Volts monitor |  |
| +5 Volts monitor |  |
| _ROLL_ROT | 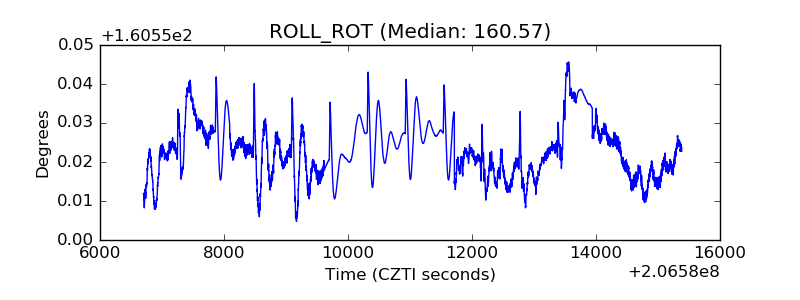 |
| _Roll_DEC | 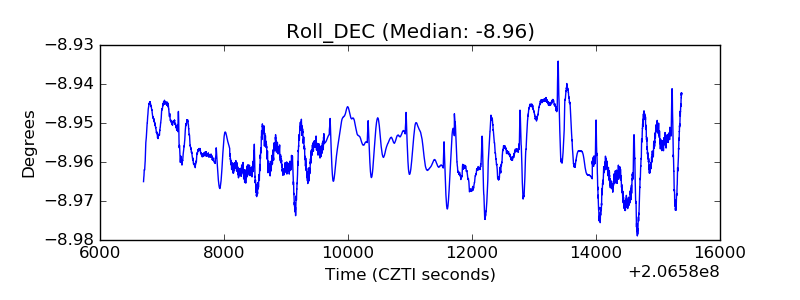 |
| _Roll_RA | 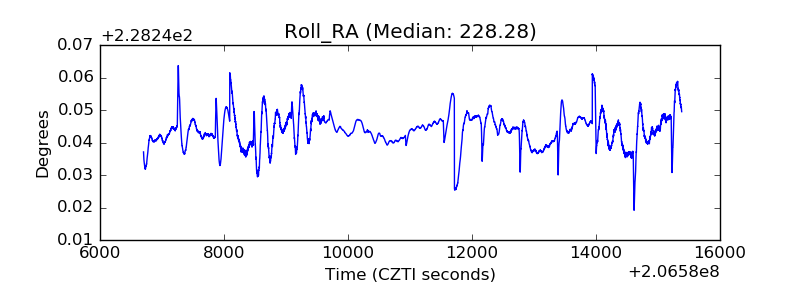 |
| Veto Counter | 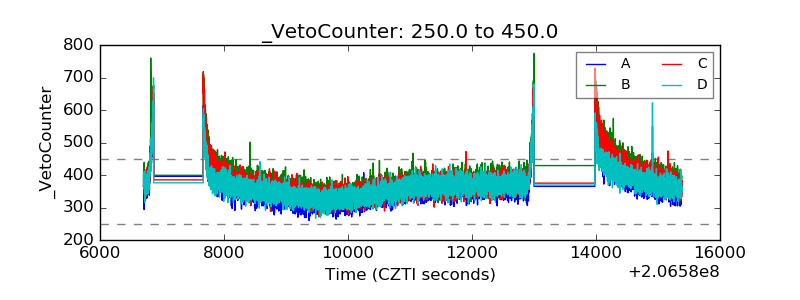 |