| Param | Original file | Final file |
|---|---|---|
| Filename | modeM0/AS1G05_252T01_9000000544_04369cztM0_level2.evt | modeM0/AS1G05_252T01_9000000544_04369cztM0_level2_quad_clean.evt |
| Size (bytes) | 456,333,120 | 57,222,720 |
| Size | 435.2 MB | 54.6 MB |
| Events in quadrant A | 4,687,878 | 320,501 |
| Events in quadrant B | 2,946,863 | 337,617 |
| Events in quadrant C | 2,904,065 | 328,783 |
| Events in quadrant D | 2,868,757 | 321,315 |
| Mode M0 | |||
|---|---|---|---|
| Quadrant | BADHDUFLAG | Total packets | Discarded packets |
| A | 0 | 17911 | 2 |
| B | 0 | 12519 | 1 |
| C | 0 | 12614 | 1 |
| D | 0 | 12666 | 1 |
| Mode SS | |||
|---|---|---|---|
| Quadrant | BADHDUFLAG | Total packets | Discarded packets |
| A | 0 | 124 | 0 |
| B | 0 | 124 | 0 |
| C | 0 | 124 | 0 |
| D | 0 | 124 | 0 |
| Mode M9 | |||
|---|---|---|---|
| Quadrant | BADHDUFLAG | Total packets | Discarded packets |
| A | 0 | 12 | 0 |
| B | 0 | 12 | 0 |
| C | 0 | 12 | 0 |
| D | 0 | 12 | 0 |
| Quadrant | Total seconds | Saturated seconds | Saturation percentage |
|---|---|---|---|
| A | 6070 | 345 | 5.683690% |
| B | 6070 | 48 | 0.790774% |
| C | 6070 | 45 | 0.741351% |
| D | 6070 | 42 | 0.691928% |
Noise dominated data is calculated using 1-second bins in cleaned event files. If a bin has >2000 counts, and if more than 50% of those come from <1% of pixels, then it is considered to be noise-dominated and hence unusable.
| Quadrant | # 1 sec bins | Bins with >0 counts | Bins with >2000 counts | High rate bins dominated by noise | Noise dominated (total time) | Noise dominated (detector-on time) | Marked lightcurve |
|---|---|---|---|---|---|---|---|
| A | 7280 | 6070 | 278 | 278 | 3.82% | 4.58% | 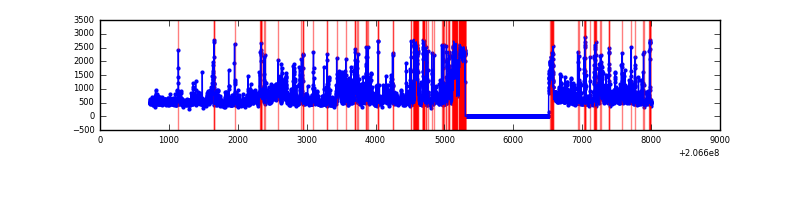 |
| B | 7280 | 6070 | 0 | 0 | 0.00% | 0.00% | 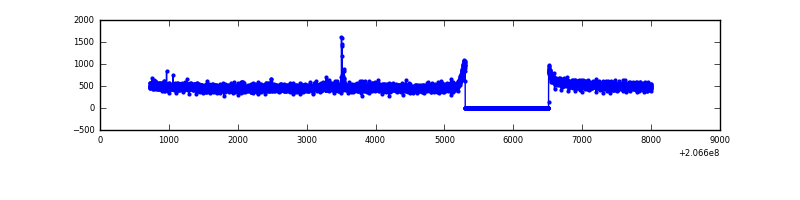 |
| C | 7280 | 6070 | 0 | 0 | 0.00% | 0.00% | 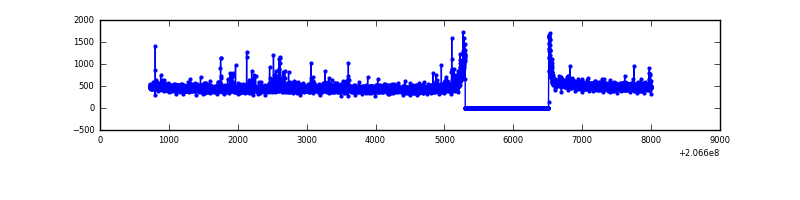 |
| D | 7280 | 6070 | 17 | 17 | 0.23% | 0.28% |  |
Top three noisy pixels from each quadrant. If the there are fewer than three noisy pixels in the level2.evt file, extra rows are filled as -1
| Pixel properties | Quadrant properties | ||||||
|---|---|---|---|---|---|---|---|
| Quadrant | DetID | PixID | Counts | Sigma | Mean | Median | Sigma |
| A | 13 | 251 | 1780992 | 12082.83 | 725 | 712 | 147.3 |
| A | 15 | 234 | 87010 | 585.71 | 725 | 712 | 147.3 |
| A | 0 | 50 | 16339 | 106.06 | 725 | 712 | 147.3 |
| B | 15 | 204 | 21170 | 141.8 | 754 | 738 | 144.1 |
| B | 12 | 111 | 12200 | 79.55 | 754 | 738 | 144.1 |
| B | 15 | 54 | 9994 | 64.24 | 754 | 738 | 144.1 |
| C | 12 | 4 | 42864 | 254.66 | 715 | 721 | 165.5 |
| C | 9 | 16 | 22848 | 133.71 | 715 | 721 | 165.5 |
| C | 5 | 175 | 21880 | 127.86 | 715 | 721 | 165.5 |
| D | 2 | 136 | 47216 | 268.37 | 714 | 693 | 173.4 |
| D | 4 | 95 | 22404 | 125.24 | 714 | 693 | 173.4 |
| D | 2 | 63 | 22062 | 123.27 | 714 | 693 | 173.4 |
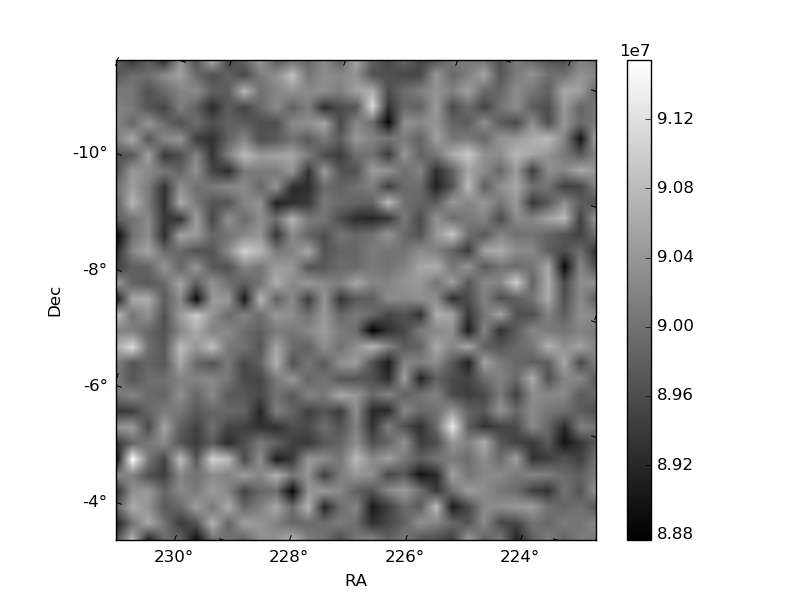
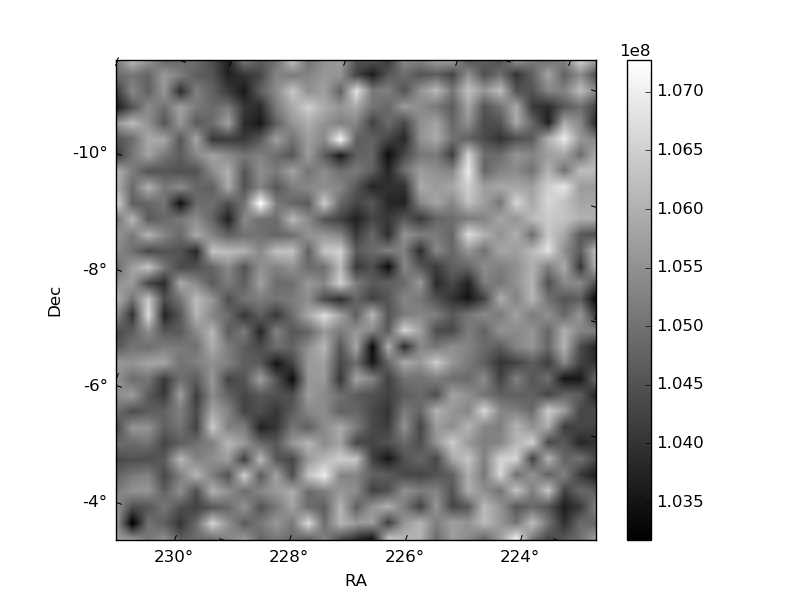
Histogram calculated using DETX and DETY for each event in the final _common_clean file
| Quadrant A | 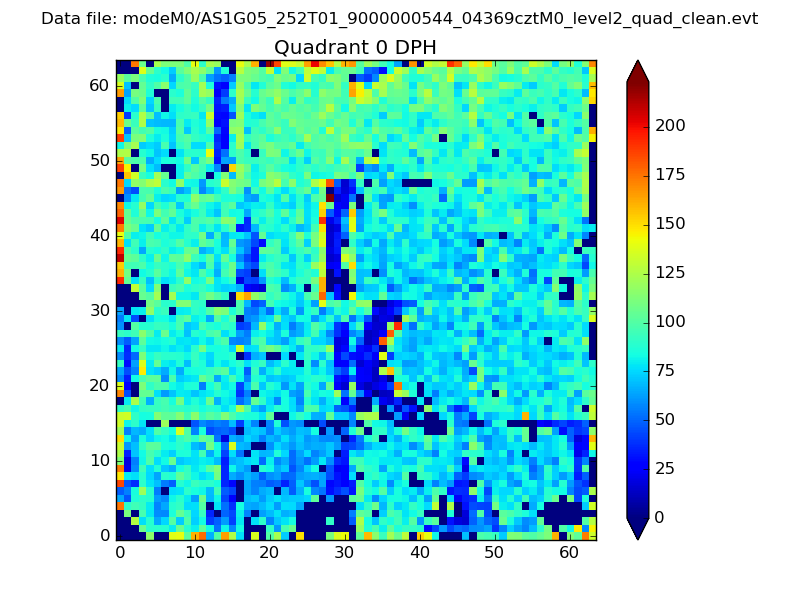 |
 |
Quadrant B |
|---|---|---|---|
| Quadrant D |  |
 |
Quadrant C |
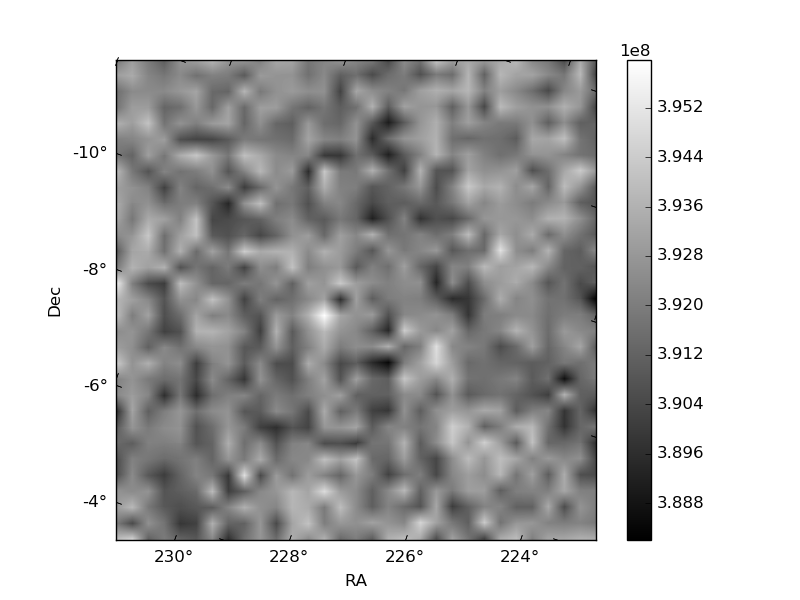
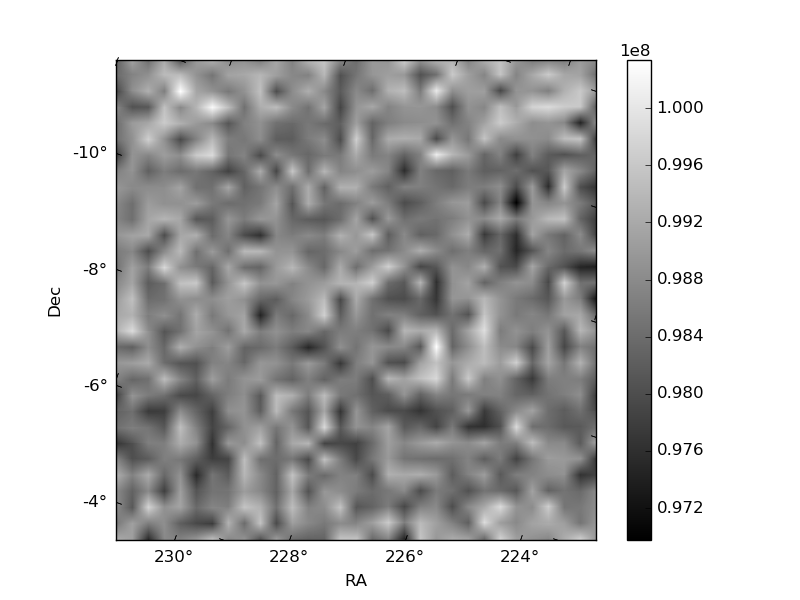
| Plot type | Count rate plots | Images |
|---|---|---|
| Comparison with Poisson distribution Blue bars denote a histogram of data divided into 1 sec bins. Red curve is a Poisson curve with rate = median count rate of data. |
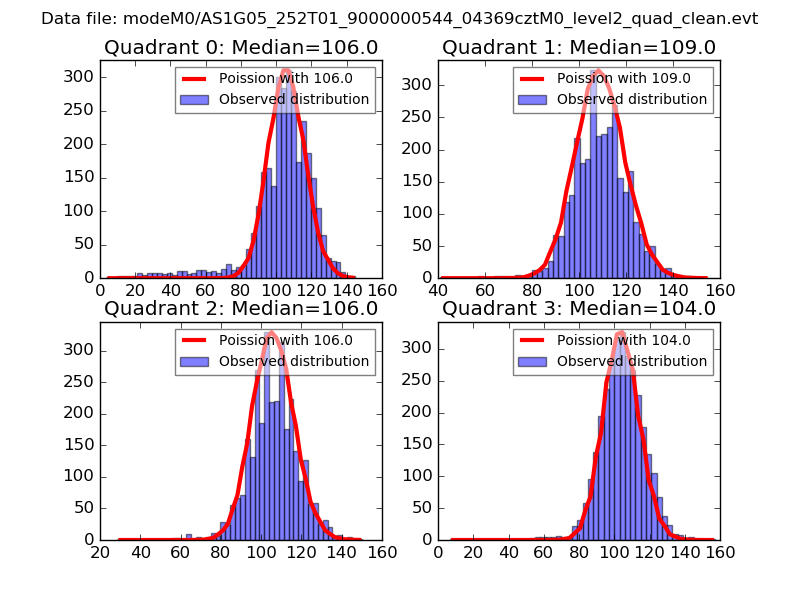 |
 |
| Quadrant-wise count rates Data is divided into 100 sec bins |
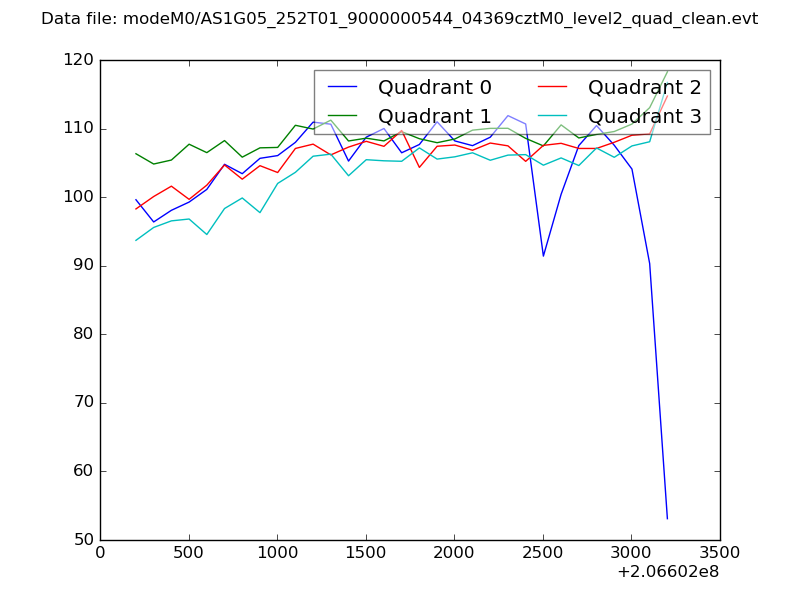 |
|
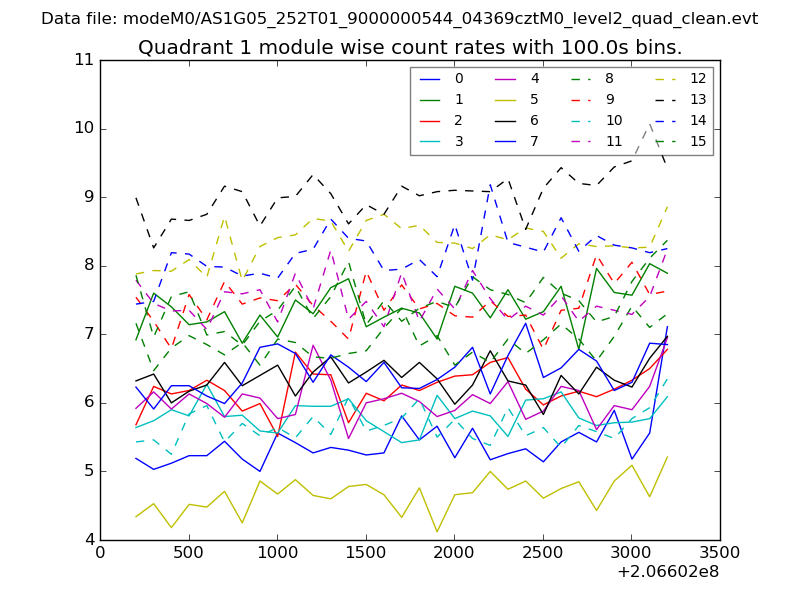
| Module-wise count rates for Quadrant A Data is divided into 100 sec bins |
 |
 |
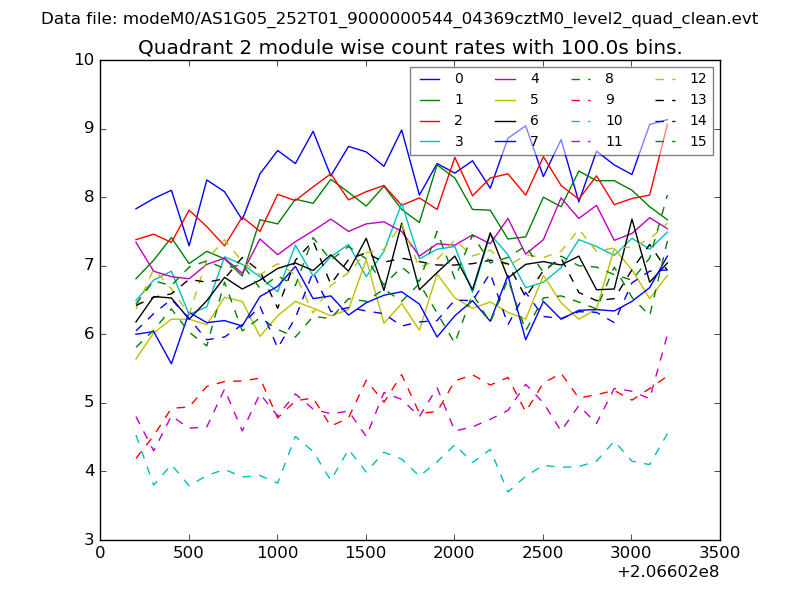
| Module-wise count rates for Quadrant B Data is divided into 100 sec bins |
 |
 |
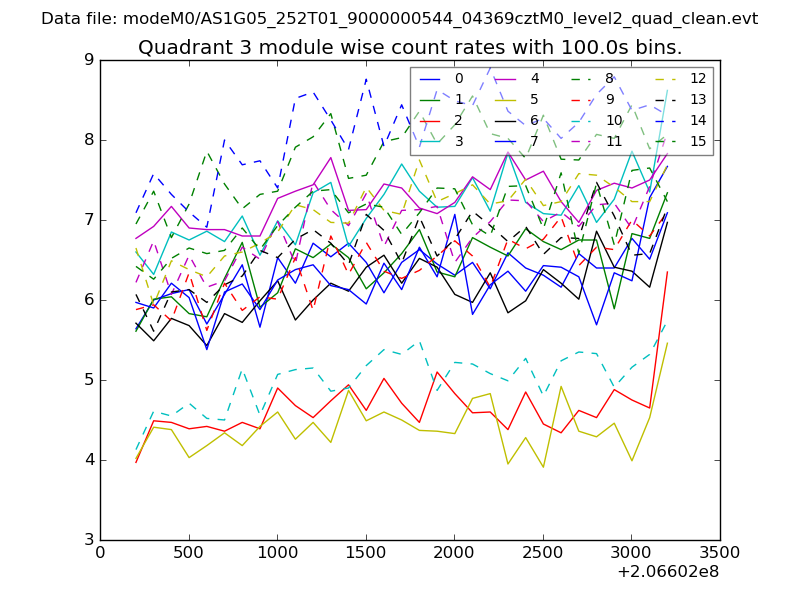
| Module-wise count rates for Quadrant C Data is divided into 100 sec bins |
 |
 |
| Module-wise count rates for Quadrant D Data is divided into 100 sec bins |
 |
 |
| Parameter | Plot |
|---|---|
| CZT HV Monitor | 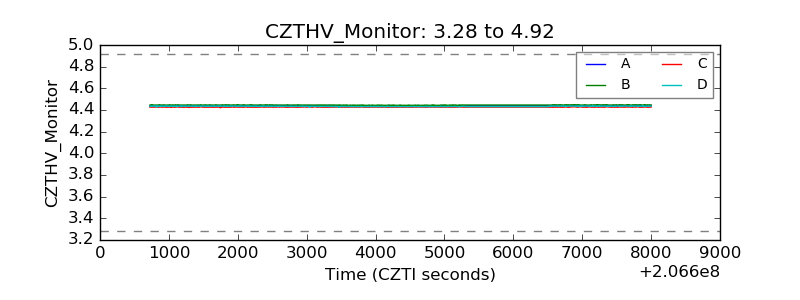 |
| D_VDD | 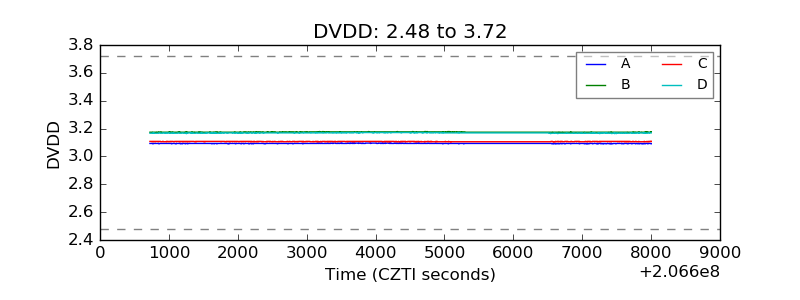 |
| Temperature 1 | 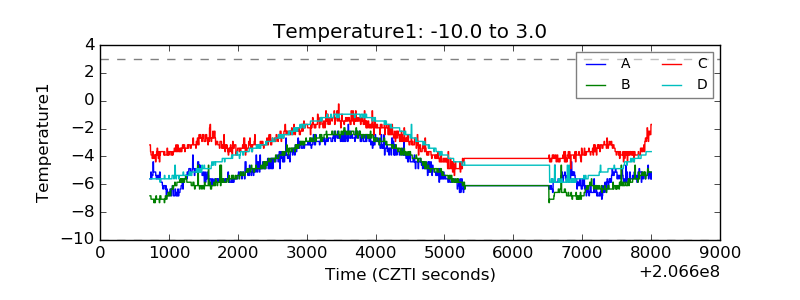 |
| Veto HV Monitor | 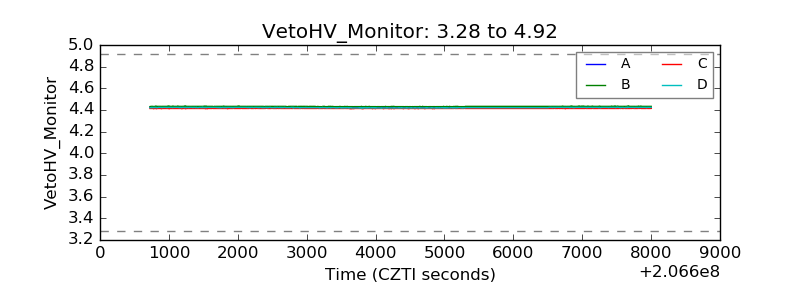 |
| Veto LLD | 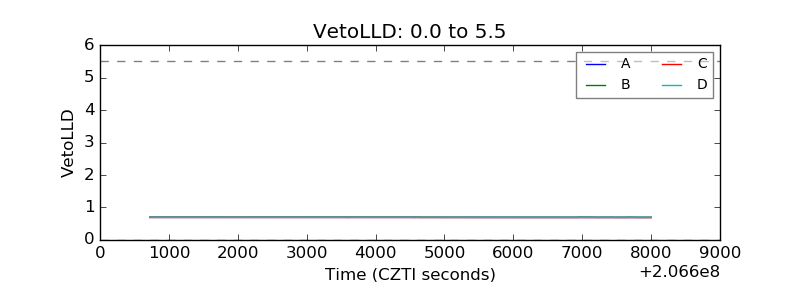 |
| Alpha Counter | 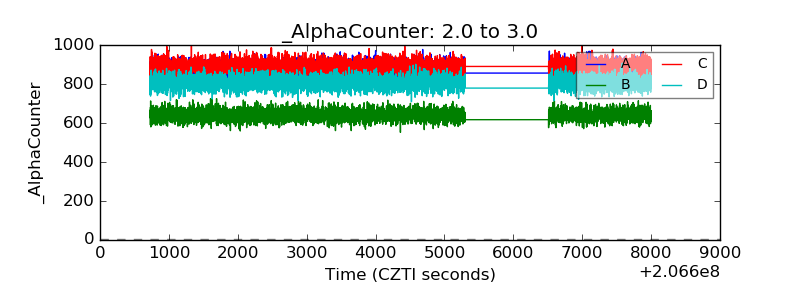 |
| _CPM_Rate | 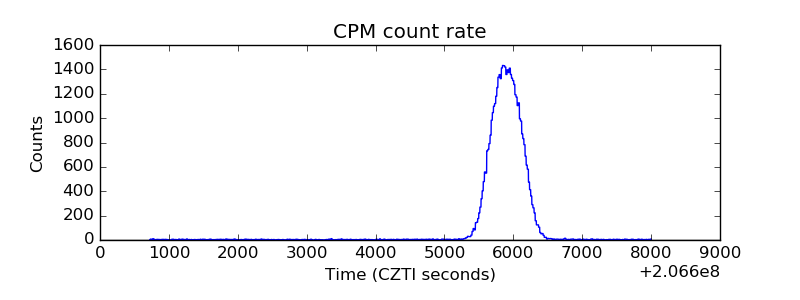 |
| CZT Counter | 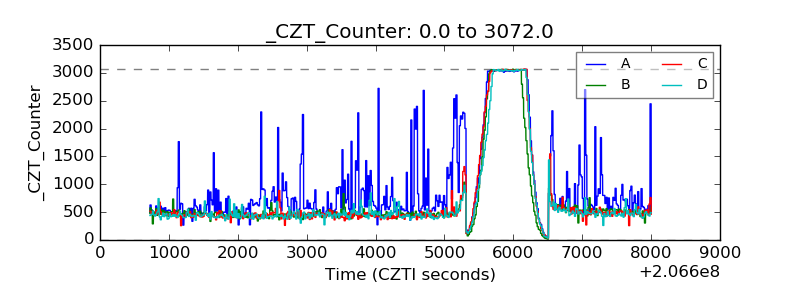 |
| +2.5 Volts monitor |  |
| +5 Volts monitor |  |
| _ROLL_ROT | 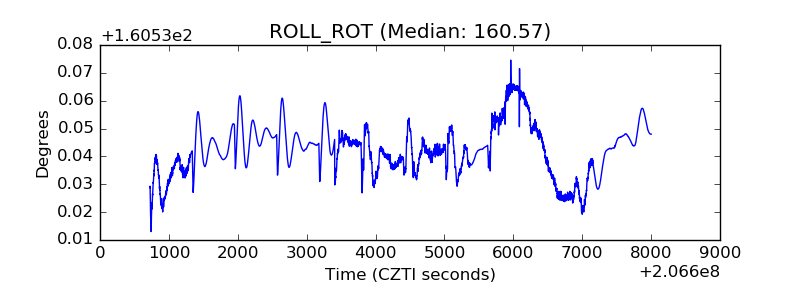 |
| _Roll_DEC | 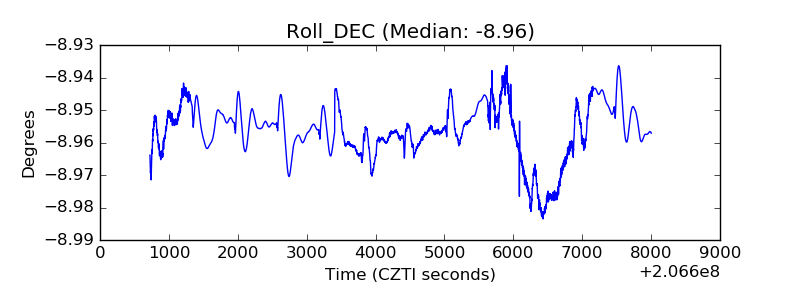 |
| _Roll_RA | 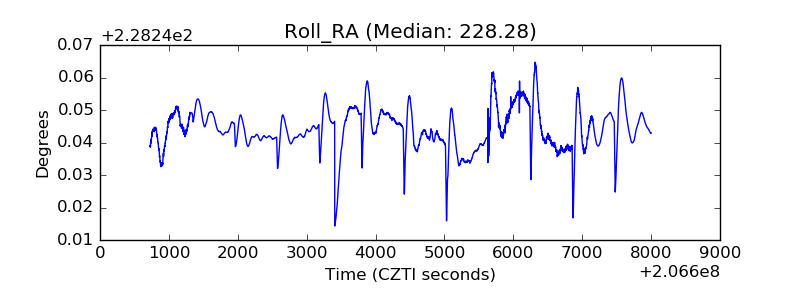 |
| Veto Counter | 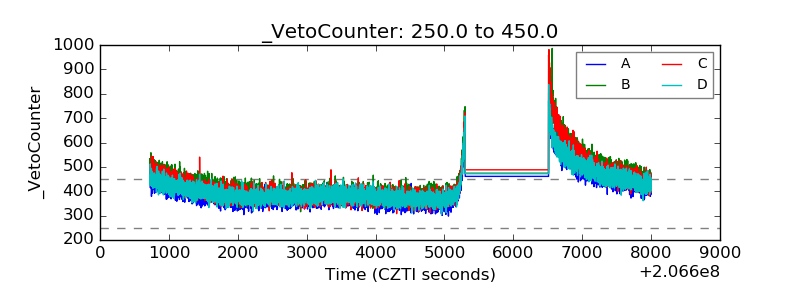 |