| Param | Original file | Final file |
|---|---|---|
| Filename | modeM0/AS1G05_252T01_9000000544_04370cztM0_level2.evt | modeM0/AS1G05_252T01_9000000544_04370cztM0_level2_quad_clean.evt |
| Size (bytes) | 502,750,080 | 66,395,520 |
| Size | 479.5 MB | 63.3 MB |
| Events in quadrant A | 5,803,823 | 384,054 |
| Events in quadrant B | 3,027,451 | 415,841 |
| Events in quadrant C | 2,972,762 | 400,831 |
| Events in quadrant D | 3,016,033 | 391,612 |
| Mode M0 | |||
|---|---|---|---|
| Quadrant | BADHDUFLAG | Total packets | Discarded packets |
| A | 0 | 21340 | 2 |
| B | 0 | 12456 | 1 |
| C | 0 | 12592 | 1 |
| D | 0 | 12910 | 1 |
| Mode SS | |||
|---|---|---|---|
| Quadrant | BADHDUFLAG | Total packets | Discarded packets |
| A | 0 | 122 | 0 |
| B | 0 | 122 | 0 |
| C | 0 | 122 | 0 |
| D | 0 | 122 | 0 |
| Mode M9 | |||
|---|---|---|---|
| Quadrant | BADHDUFLAG | Total packets | Discarded packets |
| A | 0 | 13 | 0 |
| B | 0 | 13 | 0 |
| C | 0 | 13 | 0 |
| D | 0 | 13 | 0 |
| Quadrant | Total seconds | Saturated seconds | Saturation percentage |
|---|---|---|---|
| A | 5980 | 723 | 12.090301% |
| B | 5980 | 40 | 0.668896% |
| C | 5980 | 58 | 0.969900% |
| D | 5980 | 60 | 1.003344% |
Noise dominated data is calculated using 1-second bins in cleaned event files. If a bin has >2000 counts, and if more than 50% of those come from <1% of pixels, then it is considered to be noise-dominated and hence unusable.
| Quadrant | # 1 sec bins | Bins with >0 counts | Bins with >2000 counts | High rate bins dominated by noise | Noise dominated (total time) | Noise dominated (detector-on time) | Marked lightcurve |
|---|---|---|---|---|---|---|---|
| A | 7260 | 5980 | 567 | 567 | 7.81% | 9.48% | 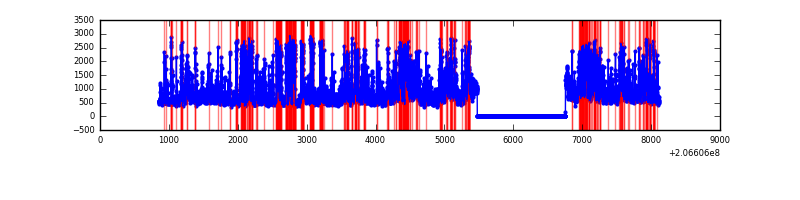 |
| B | 7259 | 5979 | 0 | 0 | 0.00% | 0.00% | 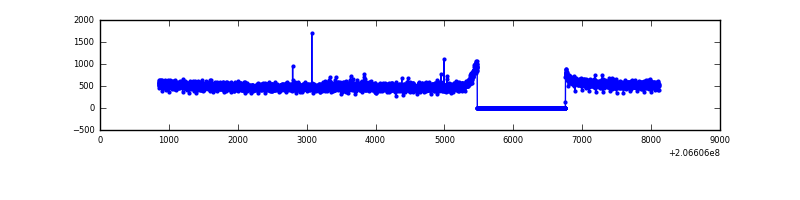 |
| C | 7259 | 5979 | 4 | 4 | 0.06% | 0.07% | 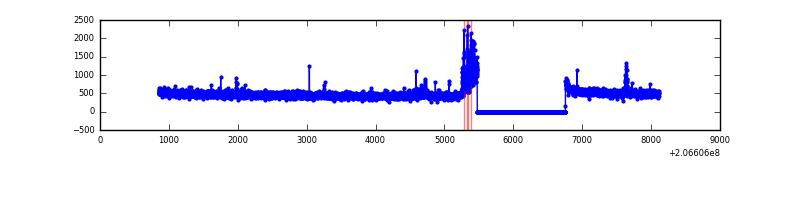 |
| D | 7260 | 5980 | 27 | 27 | 0.37% | 0.45% | 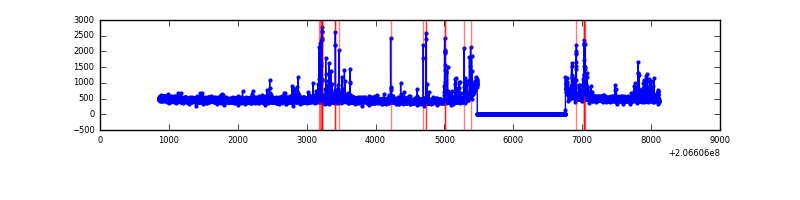 |
Top three noisy pixels from each quadrant. If the there are fewer than three noisy pixels in the level2.evt file, extra rows are filled as -1
| Pixel properties | Quadrant properties | ||||||
|---|---|---|---|---|---|---|---|
| Quadrant | DetID | PixID | Counts | Sigma | Mean | Median | Sigma |
| A | 13 | 251 | 2925956 | 20005.23 | 726 | 713 | 146.2 |
| A | 15 | 234 | 46895 | 315.83 | 726 | 713 | 146.2 |
| A | 0 | 50 | 34572 | 231.55 | 726 | 713 | 146.2 |
| B | 15 | 204 | 44741 | 304.78 | 763 | 747 | 144.3 |
| B | 0 | 183 | 25671 | 172.67 | 763 | 747 | 144.3 |
| B | 12 | 111 | 12223 | 79.5 | 763 | 747 | 144.3 |
| C | 9 | 247 | 98182 | 575.79 | 727 | 731 | 169.2 |
| C | 9 | 16 | 27011 | 155.27 | 727 | 731 | 169.2 |
| C | 12 | 4 | 6643 | 34.93 | 727 | 731 | 169.2 |
| D | 4 | 95 | 119775 | 681.72 | 728 | 708 | 174.7 |
| D | 2 | 136 | 40437 | 227.47 | 728 | 708 | 174.7 |
| D | 2 | 37 | 32623 | 182.73 | 728 | 708 | 174.7 |
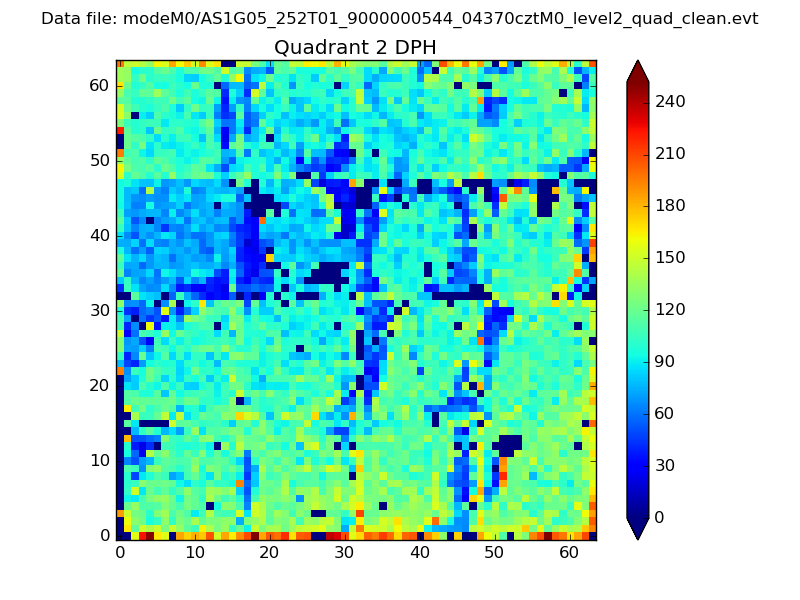
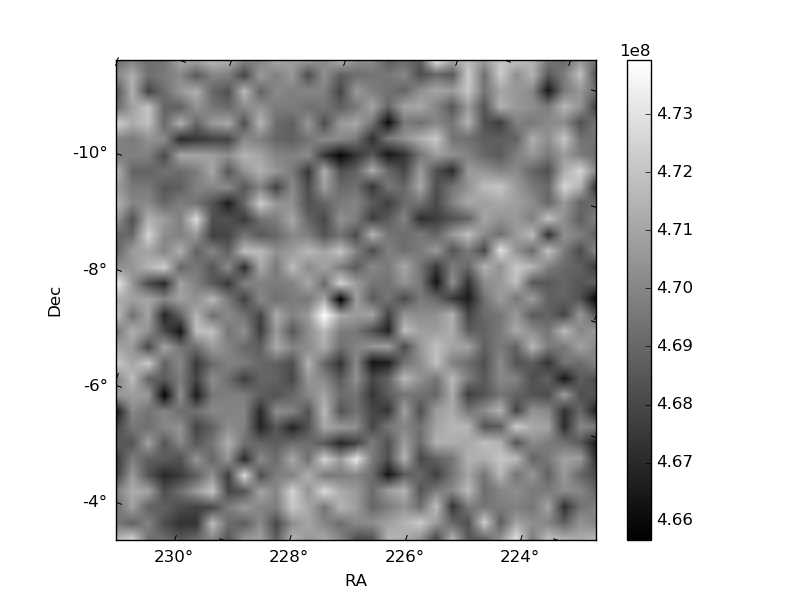
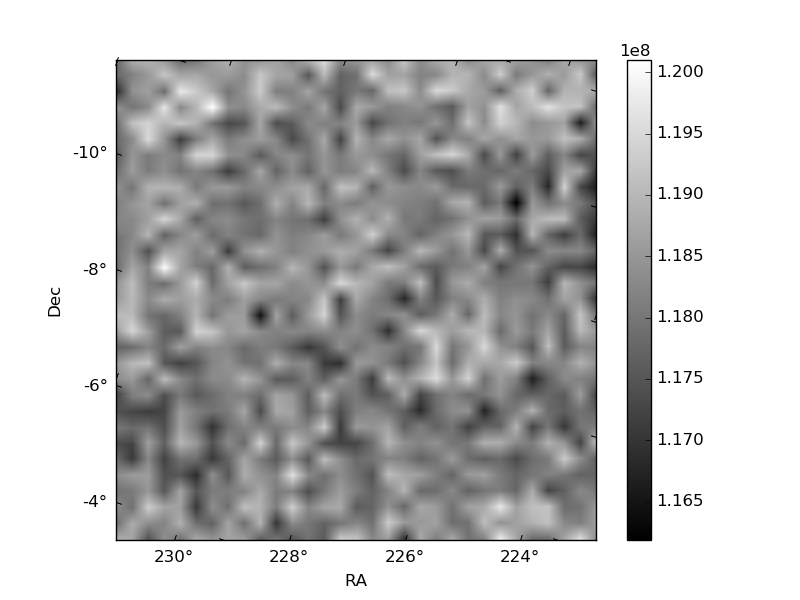
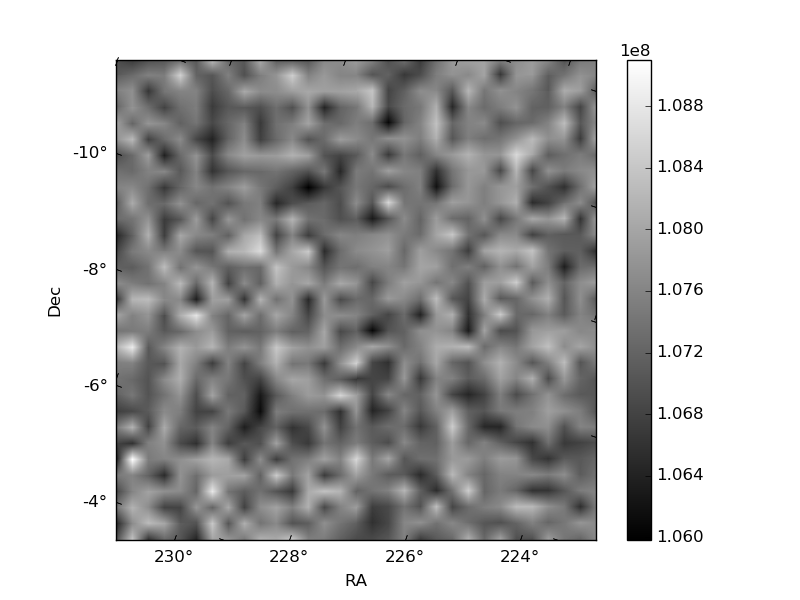
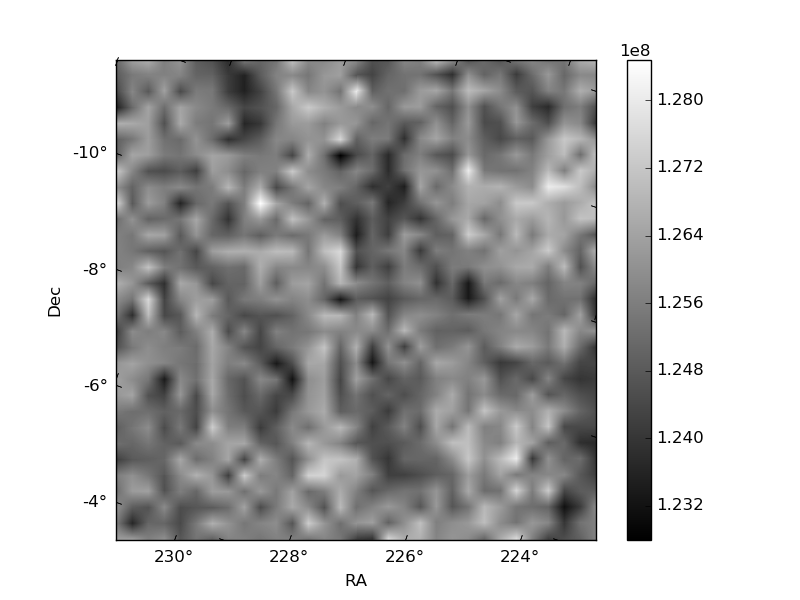
Histogram calculated using DETX and DETY for each event in the final _common_clean file
| Quadrant A | 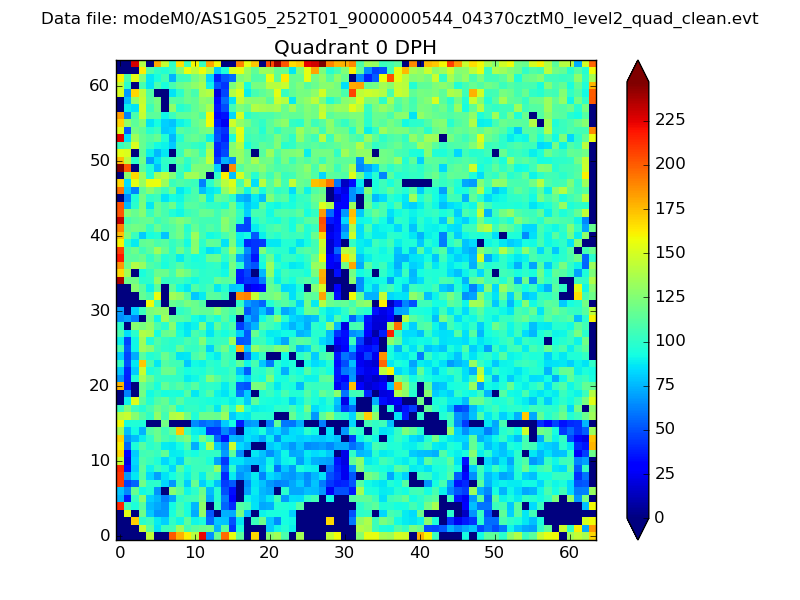 |
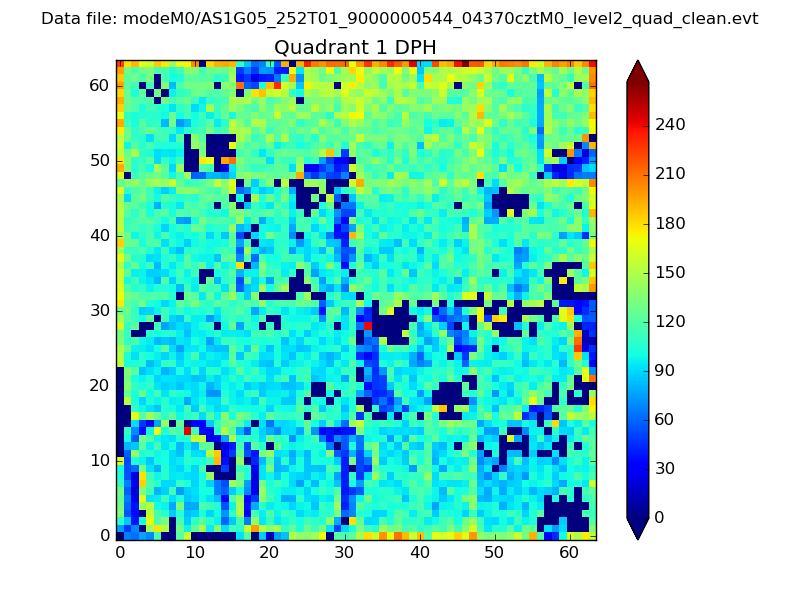 |
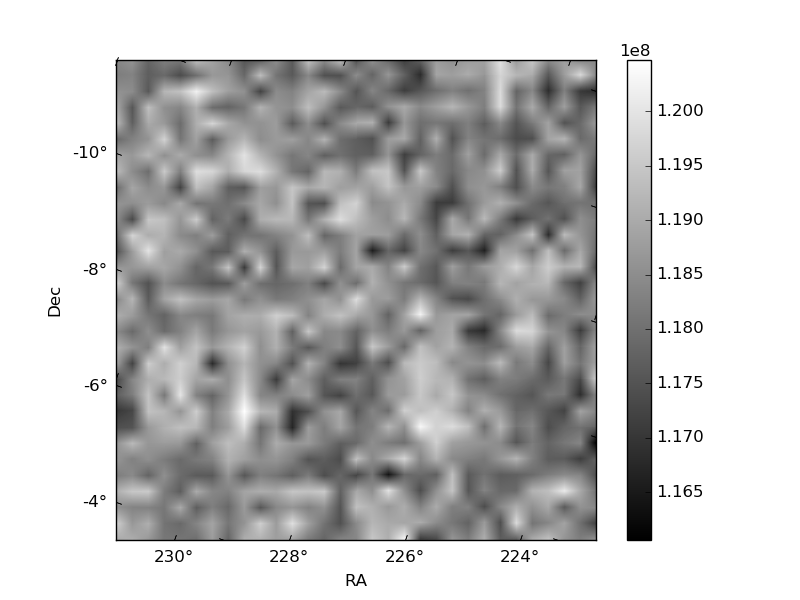
Quadrant B |
|---|---|---|---|
| Quadrant D | 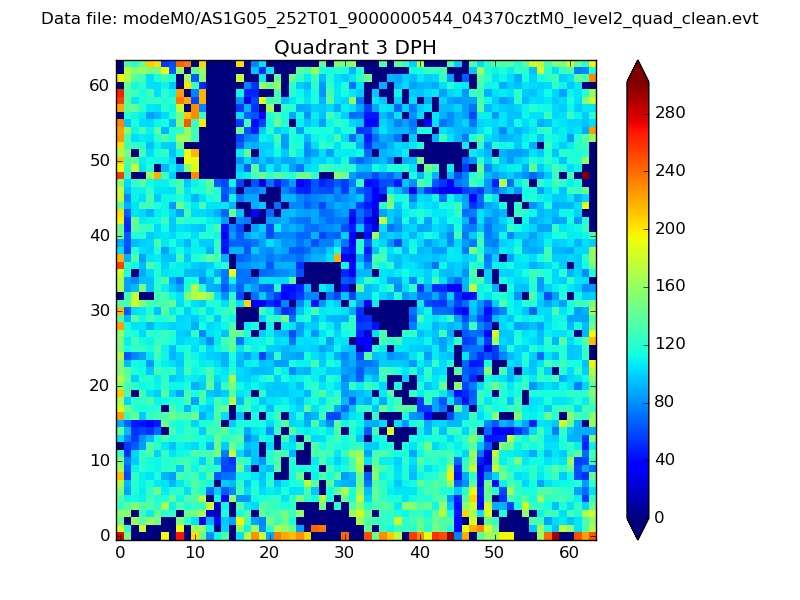 |
 |
Quadrant C |
| Plot type | Count rate plots | Images |
|---|---|---|
| Comparison with Poisson distribution Blue bars denote a histogram of data divided into 1 sec bins. Red curve is a Poisson curve with rate = median count rate of data. |
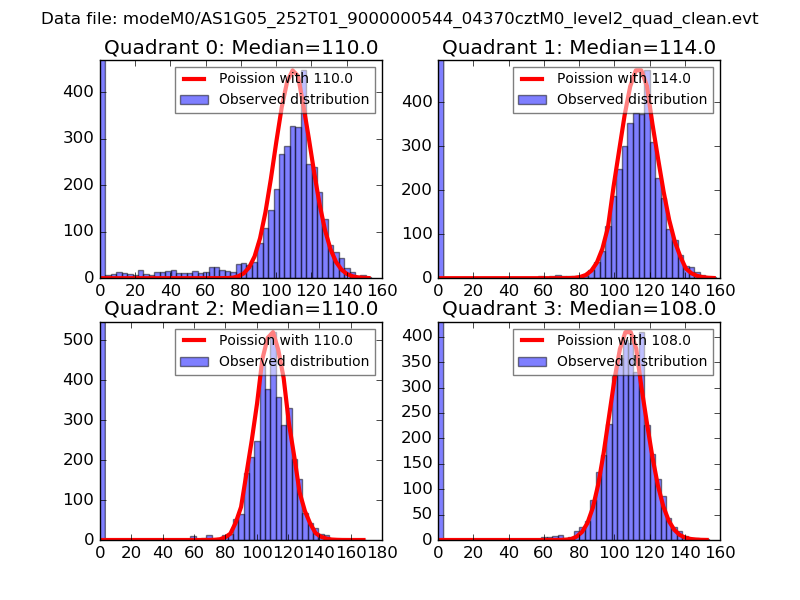 |
 |
| Quadrant-wise count rates Data is divided into 100 sec bins |
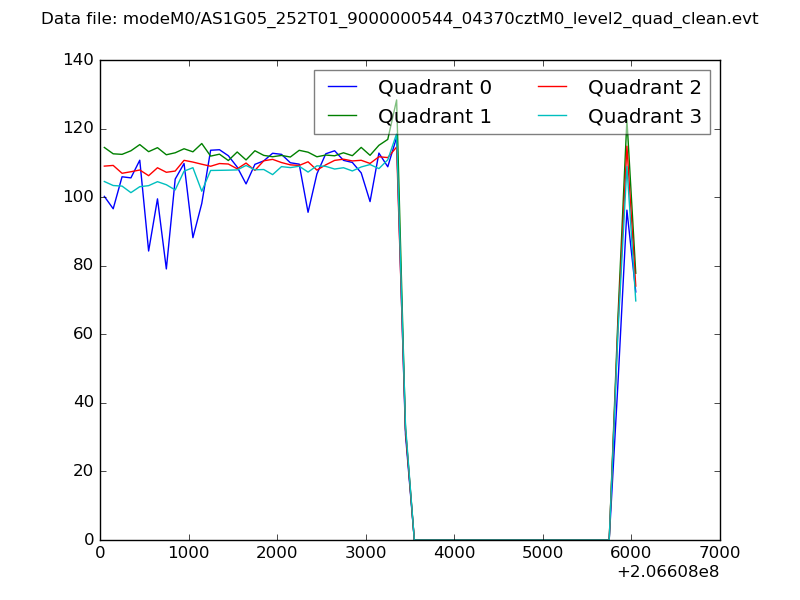 |
|
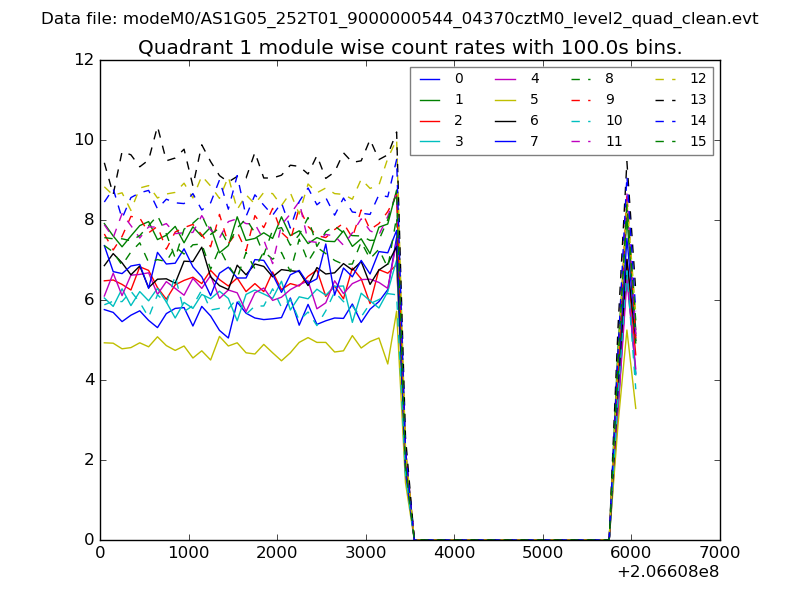
| Module-wise count rates for Quadrant A Data is divided into 100 sec bins |
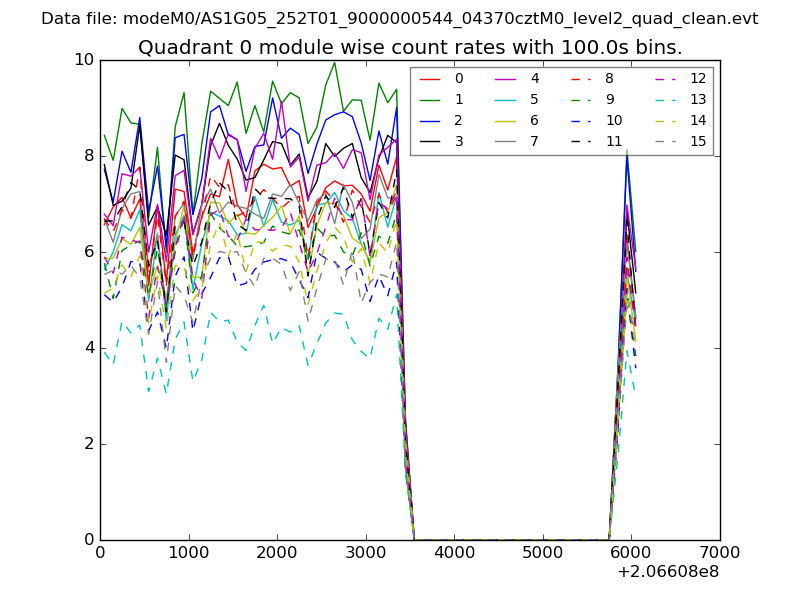 |
 |
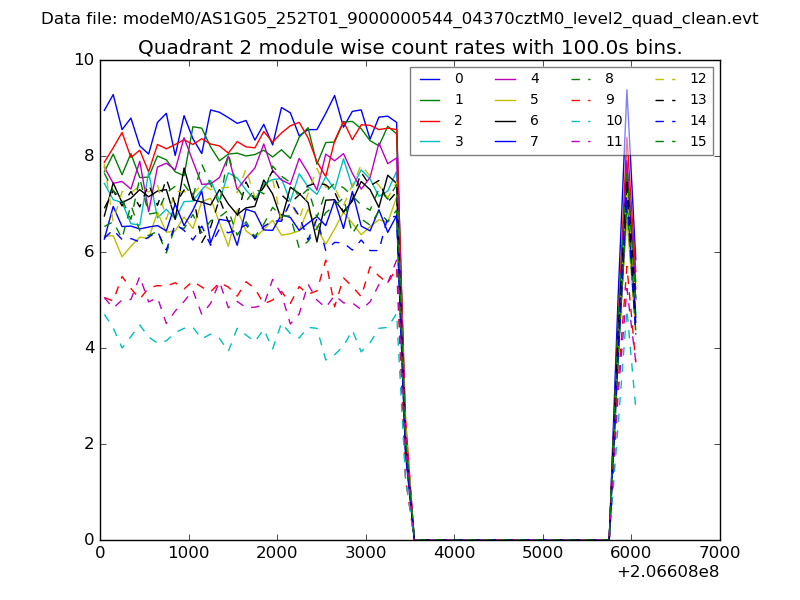
| Module-wise count rates for Quadrant B Data is divided into 100 sec bins |
 |
 |
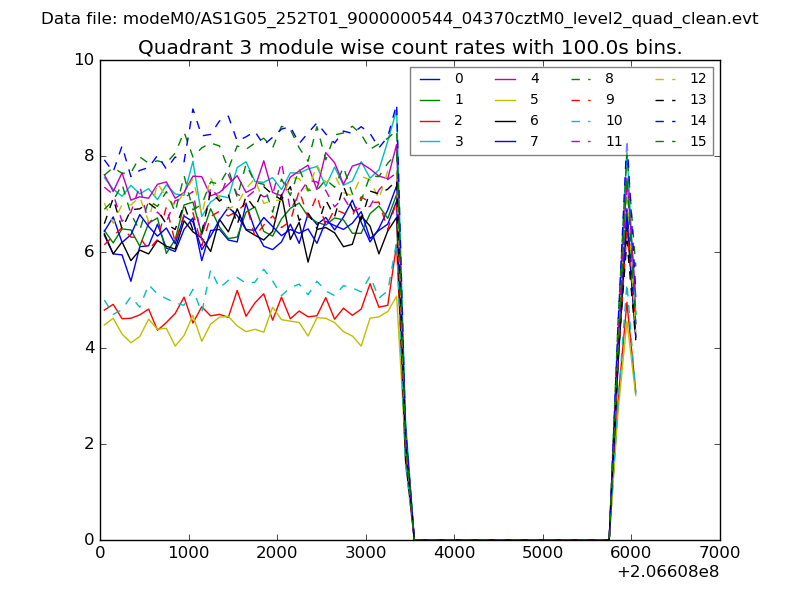
| Module-wise count rates for Quadrant C Data is divided into 100 sec bins |
 |
 |
| Module-wise count rates for Quadrant D Data is divided into 100 sec bins |
 |
 |
| Parameter | Plot |
|---|---|
| CZT HV Monitor | 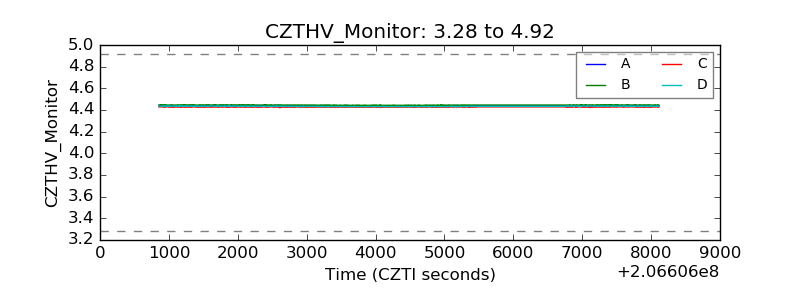 |
| D_VDD | 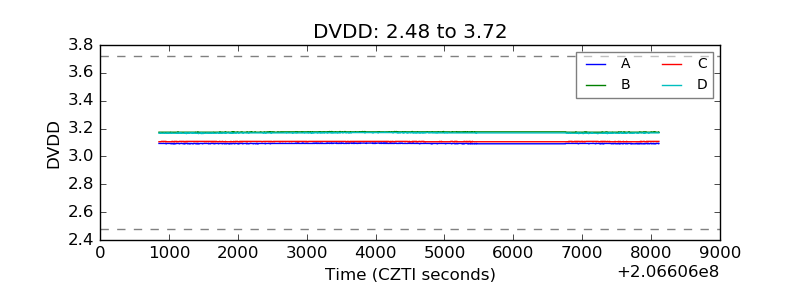 |
| Temperature 1 | 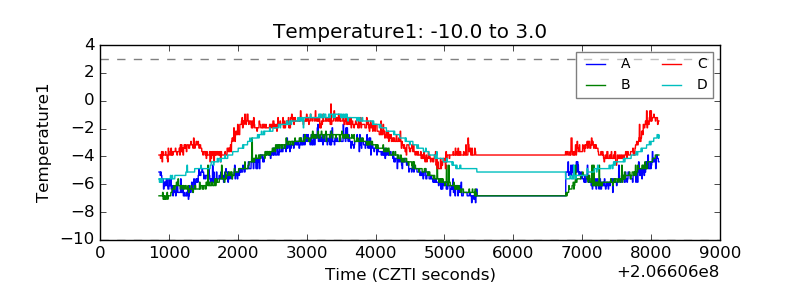 |
| Veto HV Monitor | 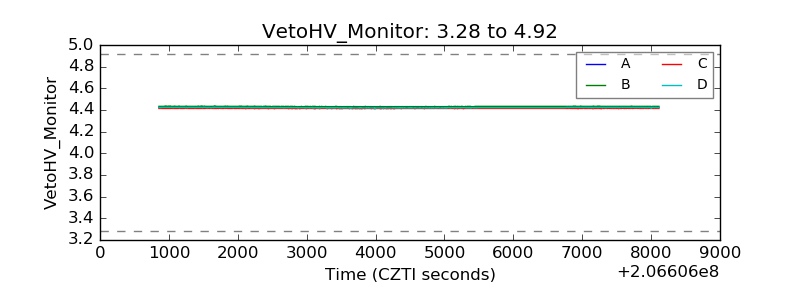 |
| Veto LLD | 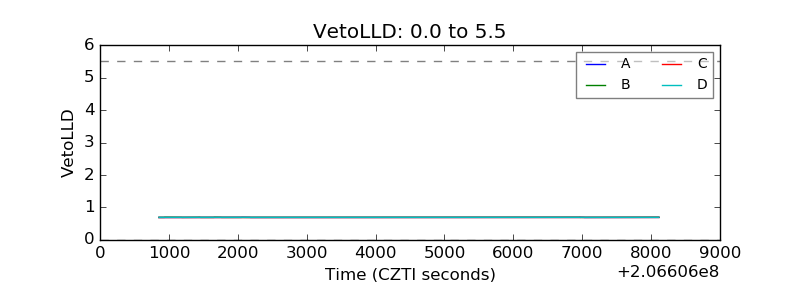 |
| Alpha Counter | 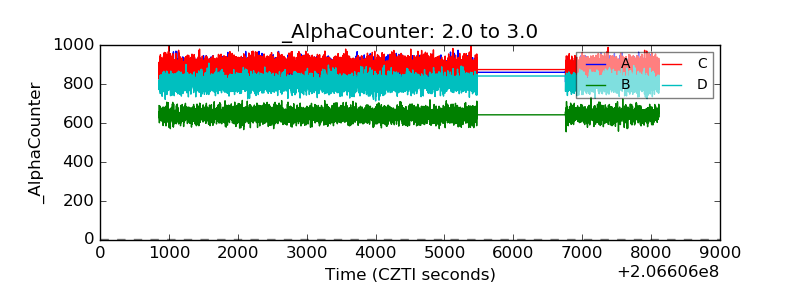 |
| _CPM_Rate | 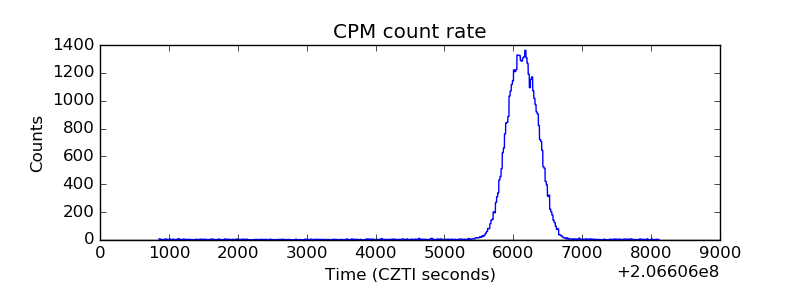 |
| CZT Counter | 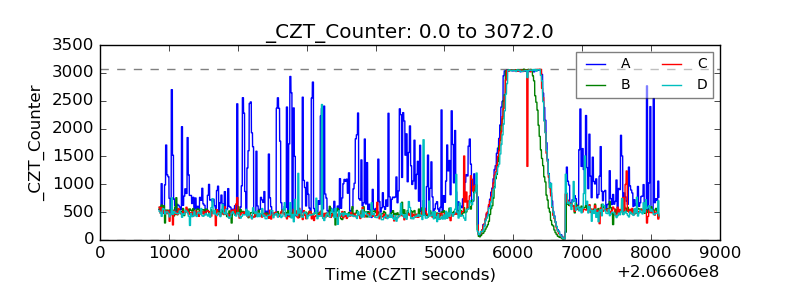 |
| +2.5 Volts monitor |  |
| +5 Volts monitor |  |
| _ROLL_ROT | 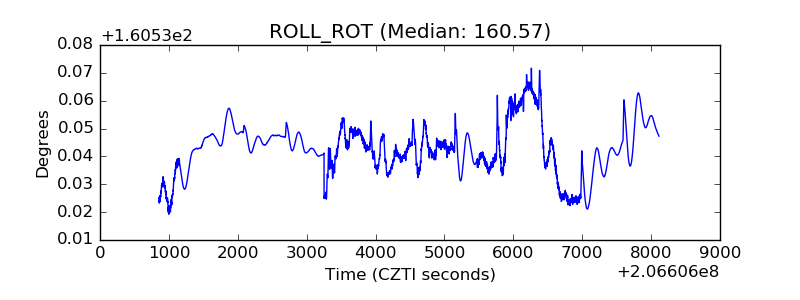 |
| _Roll_DEC | 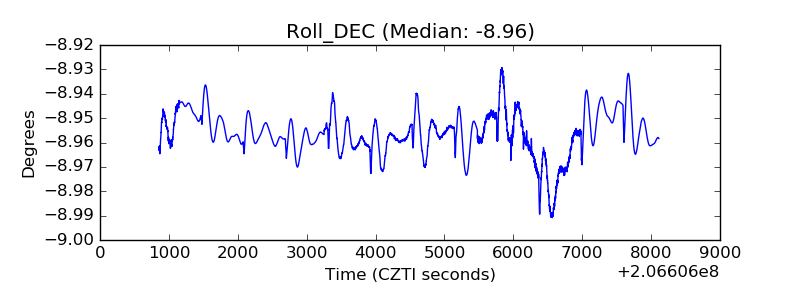 |
| _Roll_RA | 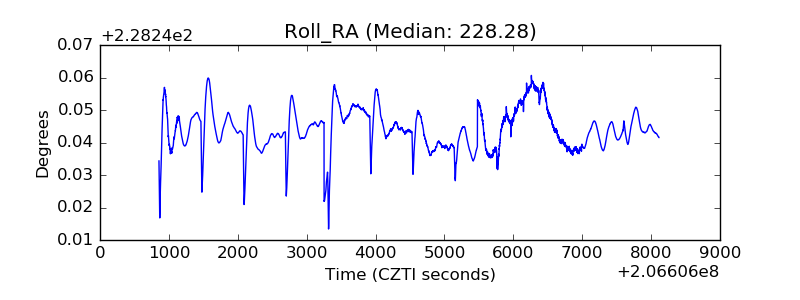 |
| Veto Counter | 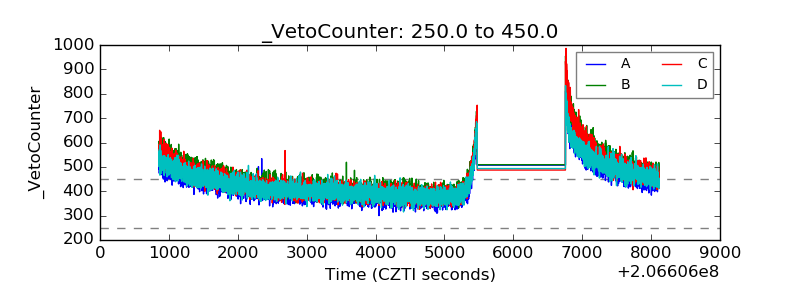 |