| Param | Original file | Final file |
|---|---|---|
| Filename | modeM0/AS1G05_252T01_9000000544_04372cztM0_level2.evt | modeM0/AS1G05_252T01_9000000544_04372cztM0_level2_quad_clean.evt |
| Size (bytes) | 594,627,840 | 80,444,160 |
| Size | 567.1 MB | 76.7 MB |
| Events in quadrant A | 6,444,055 | 483,601 |
| Events in quadrant B | 3,241,292 | 521,873 |
| Events in quadrant C | 2,989,858 | 506,847 |
| Events in quadrant D | 4,908,642 | 485,769 |
| Mode M0 | |||
|---|---|---|---|
| Quadrant | BADHDUFLAG | Total packets | Discarded packets |
| A | 0 | 23399 | 2 |
| B | 0 | 13370 | 1 |
| C | 0 | 12958 | 1 |
| D | 0 | 18859 | 1 |
| Mode SS | |||
|---|---|---|---|
| Quadrant | BADHDUFLAG | Total packets | Discarded packets |
| A | 0 | 128 | 0 |
| B | 0 | 128 | 0 |
| C | 0 | 128 | 0 |
| D | 0 | 128 | 0 |
| Mode M9 | |||
|---|---|---|---|
| Quadrant | BADHDUFLAG | Total packets | Discarded packets |
| A | 0 | 12 | 0 |
| B | 0 | 12 | 0 |
| C | 0 | 12 | 0 |
| D | 0 | 12 | 0 |
| Quadrant | Total seconds | Saturated seconds | Saturation percentage |
|---|---|---|---|
| A | 6265 | 956 | 15.259377% |
| B | 6265 | 127 | 2.027135% |
| C | 6265 | 110 | 1.755786% |
| D | 6265 | 566 | 9.034318% |
Noise dominated data is calculated using 1-second bins in cleaned event files. If a bin has >2000 counts, and if more than 50% of those come from <1% of pixels, then it is considered to be noise-dominated and hence unusable.
| Quadrant | # 1 sec bins | Bins with >0 counts | Bins with >2000 counts | High rate bins dominated by noise | Noise dominated (total time) | Noise dominated (detector-on time) | Marked lightcurve |
|---|---|---|---|---|---|---|---|
| A | 7464 | 6264 | 726 | 726 | 9.73% | 11.59% | 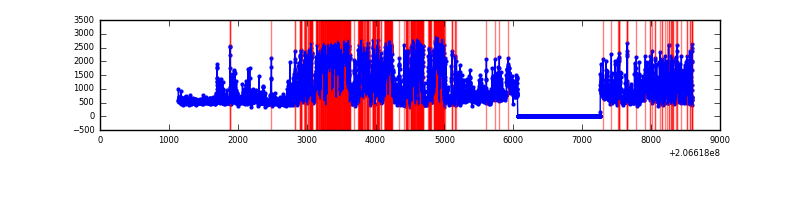 |
| B | 7464 | 6264 | 4 | 4 | 0.05% | 0.06% | 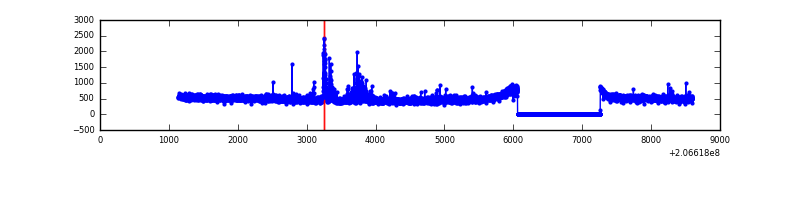 |
| C | 7464 | 6264 | 0 | 0 | 0.00% | 0.00% |  |
| D | 7464 | 6264 | 350 | 350 | 4.69% | 5.59% | 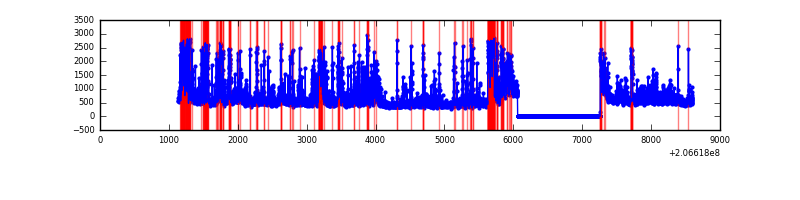 |
Top three noisy pixels from each quadrant. If the there are fewer than three noisy pixels in the level2.evt file, extra rows are filled as -1
| Pixel properties | Quadrant properties | ||||||
|---|---|---|---|---|---|---|---|
| Quadrant | DetID | PixID | Counts | Sigma | Mean | Median | Sigma |
| A | 13 | 251 | 3486048 | 22361.51 | 761 | 746 | 155.9 |
| A | 15 | 234 | 13778 | 83.61 | 761 | 746 | 155.9 |
| A | 13 | 248 | 9692 | 57.4 | 761 | 746 | 155.9 |
| B | 4 | 48 | 71643 | 464.35 | 793 | 775 | 152.6 |
| B | 15 | 54 | 67345 | 436.18 | 793 | 775 | 152.6 |
| B | 15 | 204 | 19860 | 125.05 | 793 | 775 | 152.6 |
| C | 9 | 16 | 6692 | 33.44 | 760 | 764 | 177.3 |
| C | 13 | 61 | 6400 | 31.79 | 760 | 764 | 177.3 |
| C | 9 | 247 | 4482 | 20.97 | 760 | 764 | 177.3 |
| D | 12 | 233 | 727965 | 4068.24 | 742 | 721 | 178.8 |
| D | 2 | 63 | 422211 | 2357.83 | 742 | 721 | 178.8 |
| D | 13 | 53 | 227452 | 1268.34 | 742 | 721 | 178.8 |
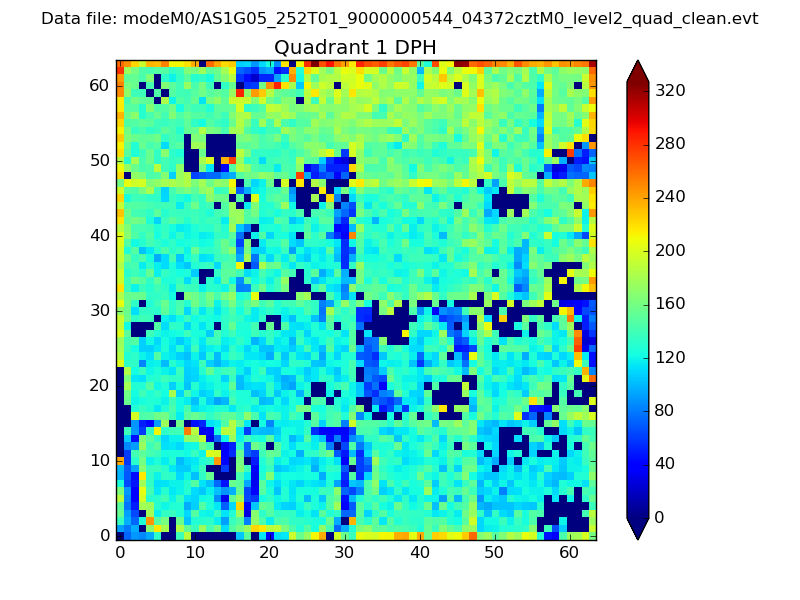
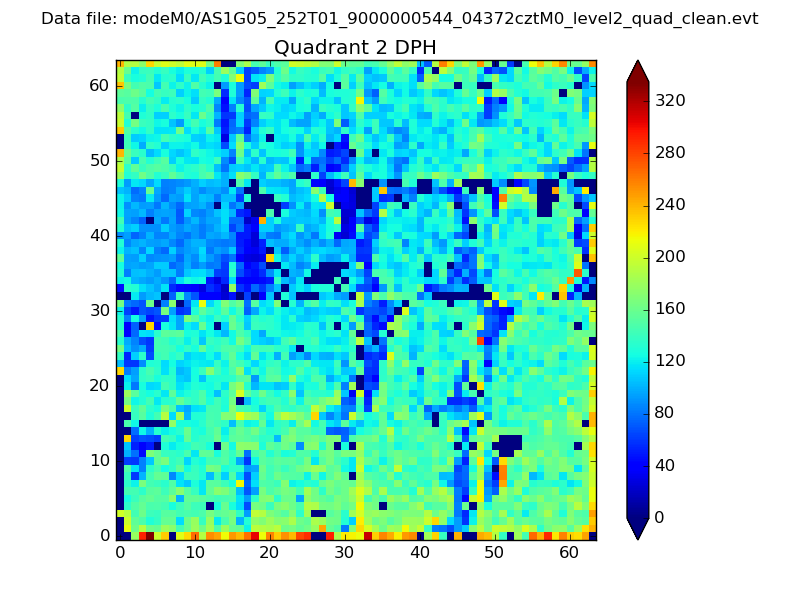
Histogram calculated using DETX and DETY for each event in the final _common_clean file
| Quadrant A |  |
 |
Quadrant B |
|---|---|---|---|
| Quadrant D | 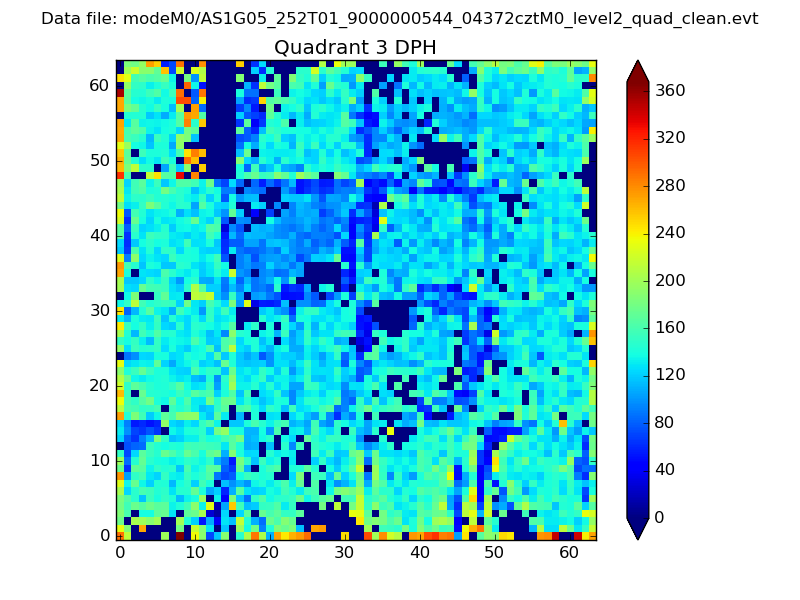 |
 |
Quadrant C |
| Plot type | Count rate plots | Images |
|---|---|---|
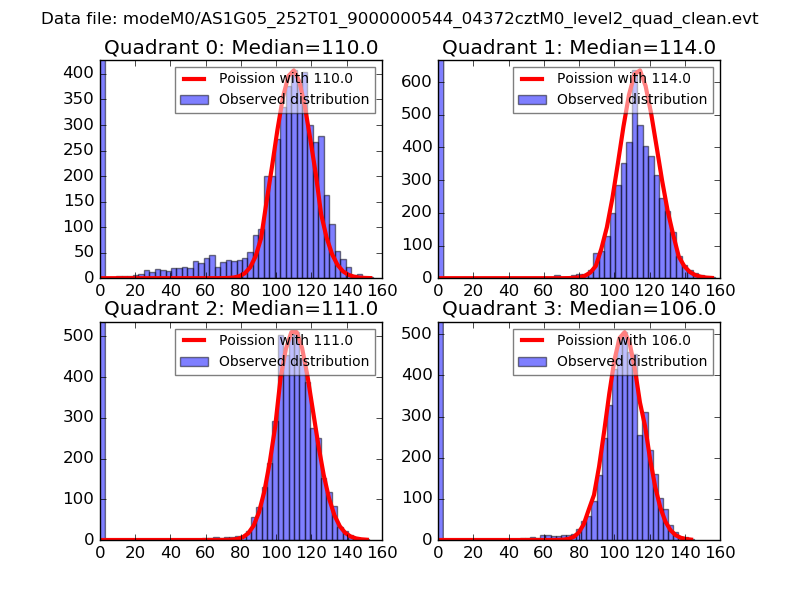
| Comparison with Poisson distribution Blue bars denote a histogram of data divided into 1 sec bins. Red curve is a Poisson curve with rate = median count rate of data. |
 |
 |
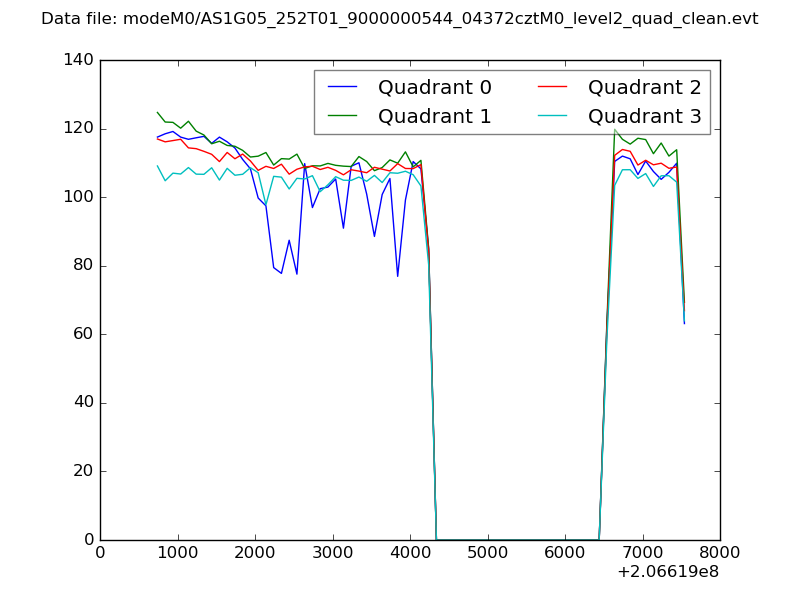
| Quadrant-wise count rates Data is divided into 100 sec bins |
 |
|
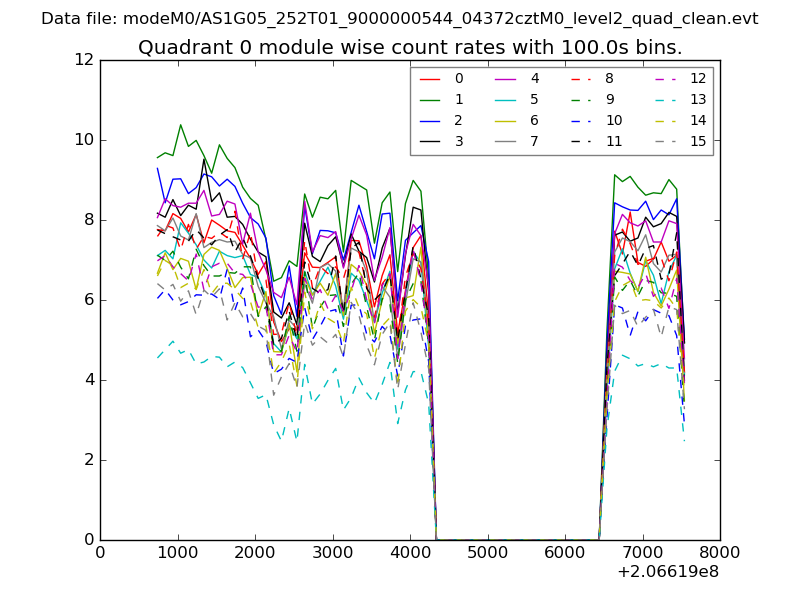
| Module-wise count rates for Quadrant A Data is divided into 100 sec bins |
 |
 |
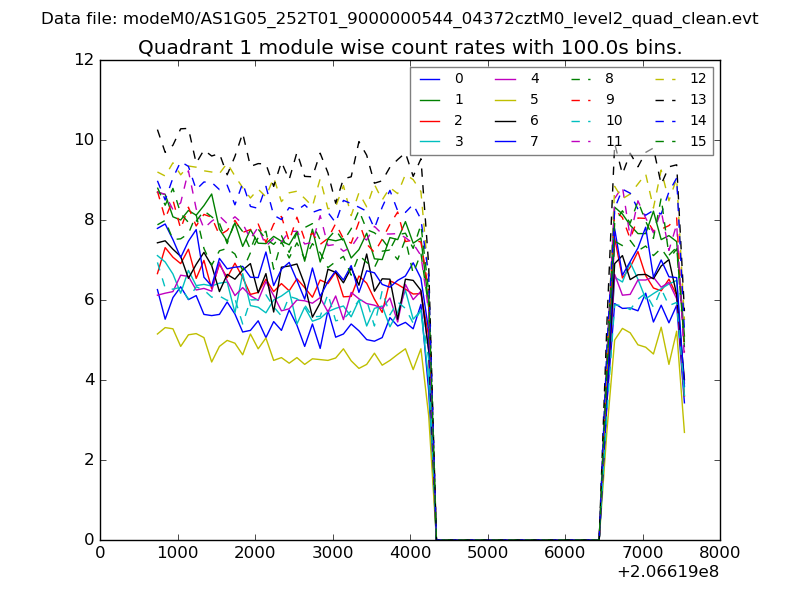
| Module-wise count rates for Quadrant B Data is divided into 100 sec bins |
 |
 |
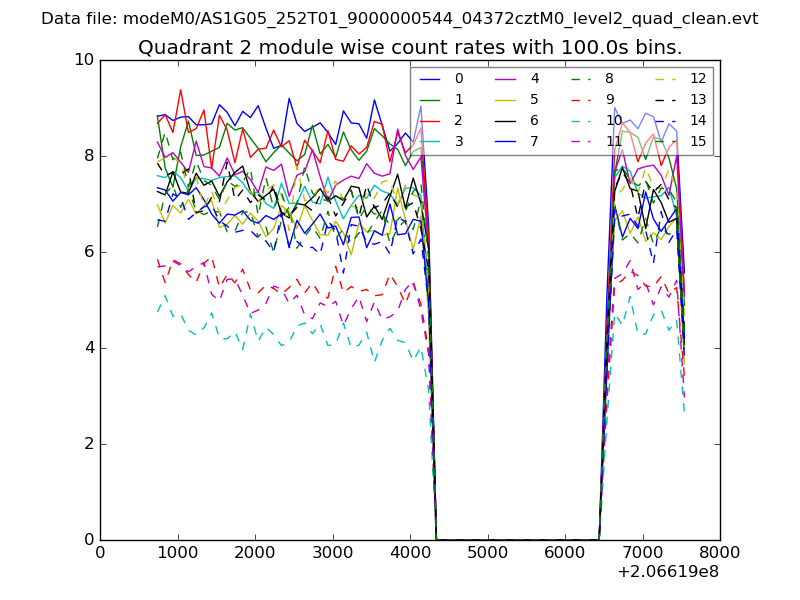
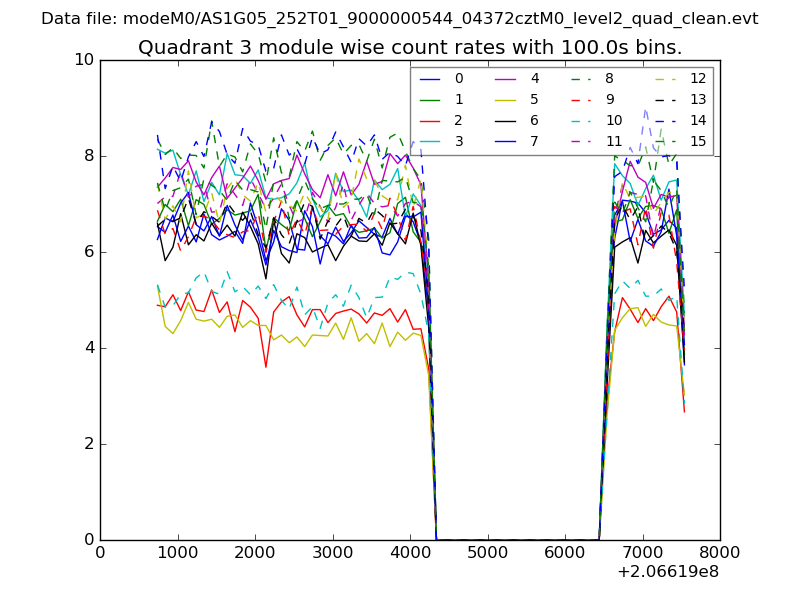
| Module-wise count rates for Quadrant C Data is divided into 100 sec bins |
 |
 |
| Module-wise count rates for Quadrant D Data is divided into 100 sec bins |
 |
 |
| Parameter | Plot |
|---|---|
| CZT HV Monitor | 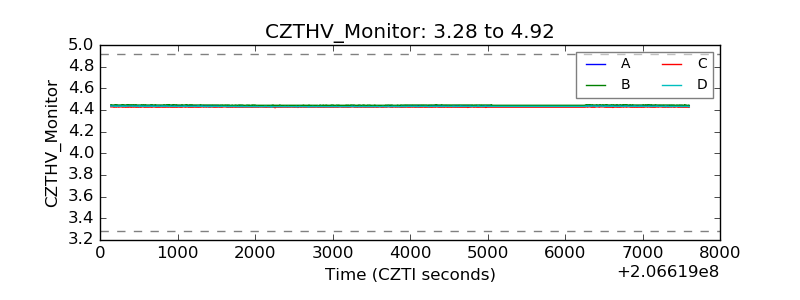 |
| D_VDD | 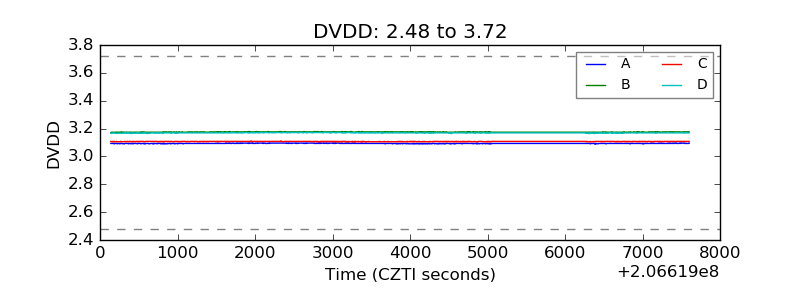 |
| Temperature 1 | 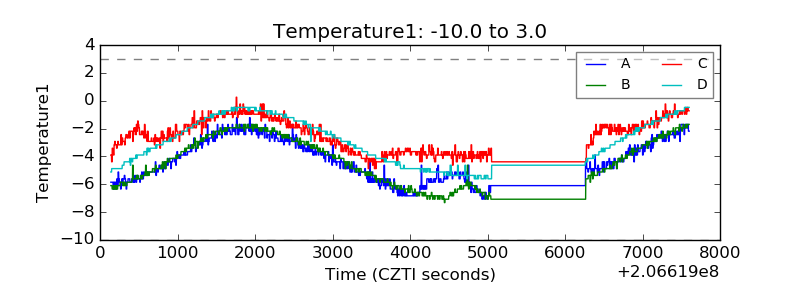 |
| Veto HV Monitor | 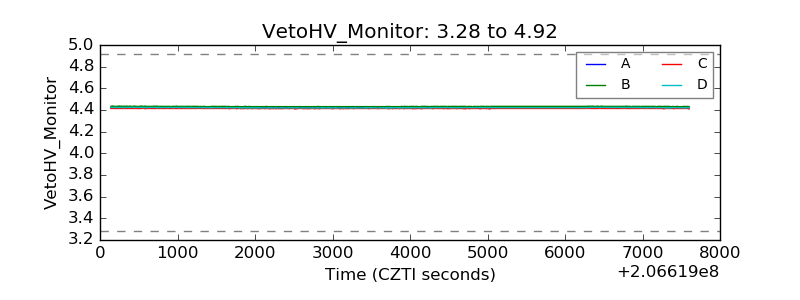 |
| Veto LLD | 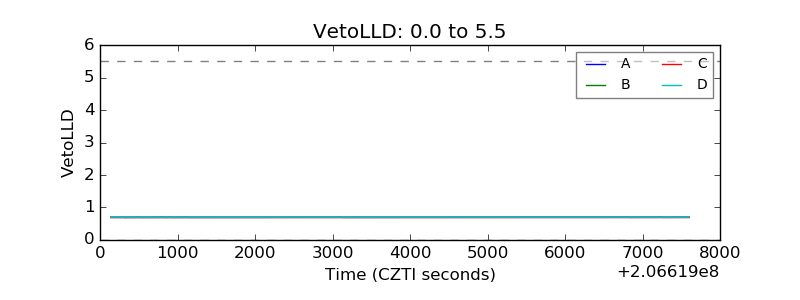 |
| Alpha Counter | 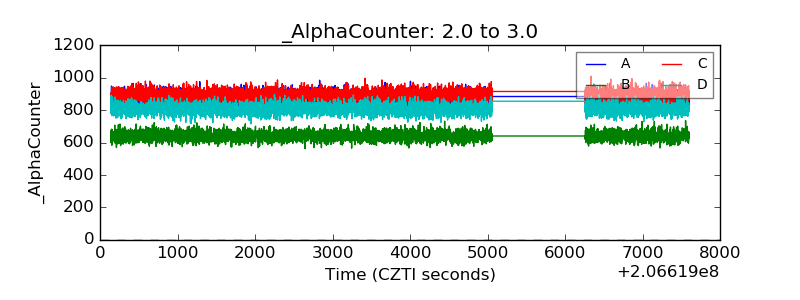 |
| _CPM_Rate | 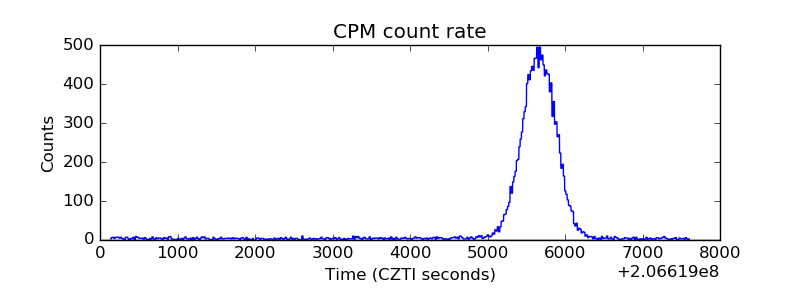 |
| CZT Counter | 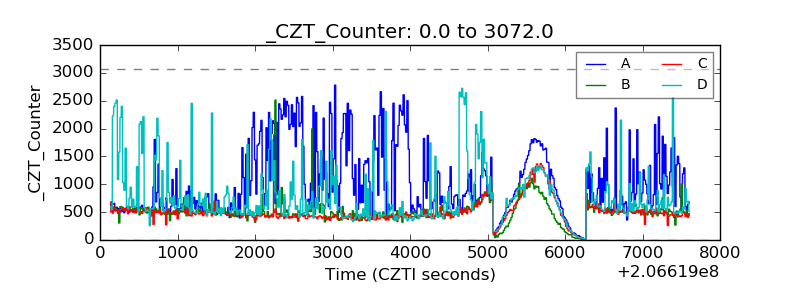 |
| +2.5 Volts monitor |  |
| +5 Volts monitor |  |
| _ROLL_ROT | 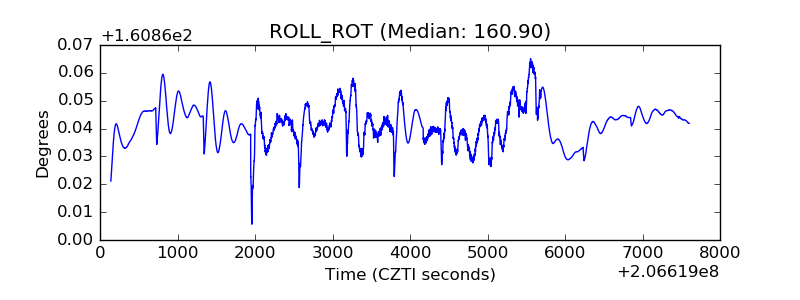 |
| _Roll_DEC | 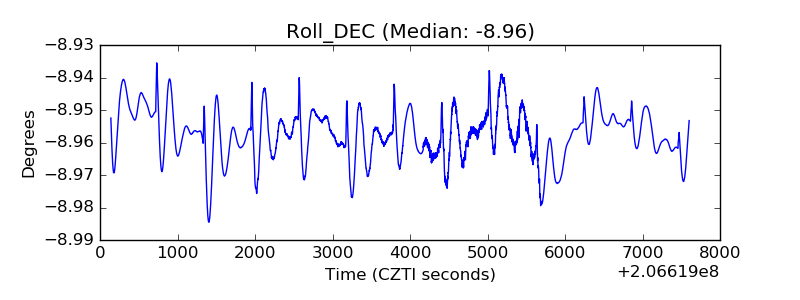 |
| _Roll_RA | 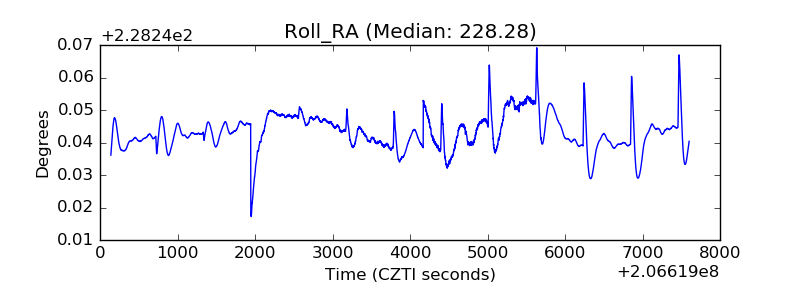 |
| Veto Counter | 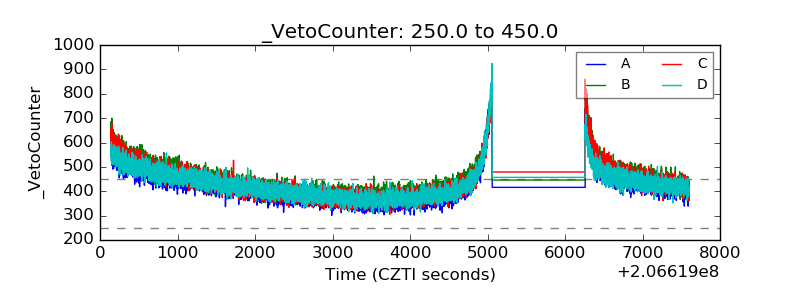 |