| Param | Original file | Final file |
|---|---|---|
| Filename | modeM0/AS1G05_252T01_9000000544_04373cztM0_level2.evt | modeM0/AS1G05_252T01_9000000544_04373cztM0_level2_quad_clean.evt |
| Size (bytes) | 385,945,920 | 56,583,360 |
| Size | 368.1 MB | 54.0 MB |
| Events in quadrant A | 4,644,163 | 339,840 |
| Events in quadrant B | 2,178,545 | 355,688 |
| Events in quadrant C | 2,083,763 | 349,646 |
| Events in quadrant D | 2,467,027 | 342,664 |
| Mode M0 | |||
|---|---|---|---|
| Quadrant | BADHDUFLAG | Total packets | Discarded packets |
| A | 0 | 17024 | 0 |
| B | 0 | 9554 | 0 |
| C | 0 | 9492 | 0 |
| D | 0 | 10592 | 0 |
| Mode SS | |||
|---|---|---|---|
| Quadrant | BADHDUFLAG | Total packets | Discarded packets |
| A | 0 | 94 | 0 |
| B | 0 | 94 | 0 |
| C | 0 | 94 | 0 |
| D | 0 | 94 | 0 |
| Mode M9 | |||
|---|---|---|---|
| Quadrant | BADHDUFLAG | Total packets | Discarded packets |
| A | 0 | 7 | 0 |
| B | 0 | 7 | 0 |
| C | 0 | 7 | 0 |
| D | 0 | 7 | 0 |
| Quadrant | Total seconds | Saturated seconds | Saturation percentage |
|---|---|---|---|
| A | 4628 | 618 | 13.353500% |
| B | 4628 | 84 | 1.815039% |
| C | 4628 | 65 | 1.404494% |
| D | 4628 | 106 | 2.290406% |
Noise dominated data is calculated using 1-second bins in cleaned event files. If a bin has >2000 counts, and if more than 50% of those come from <1% of pixels, then it is considered to be noise-dominated and hence unusable.
| Quadrant | # 1 sec bins | Bins with >0 counts | Bins with >2000 counts | High rate bins dominated by noise | Noise dominated (total time) | Noise dominated (detector-on time) | Marked lightcurve |
|---|---|---|---|---|---|---|---|
| A | 4628 | 4628 | 406 | 406 | 8.77% | 8.77% | 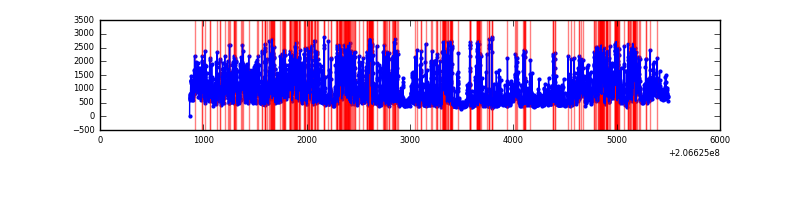 |
| B | 4628 | 4628 | 2 | 2 | 0.04% | 0.04% |  |
| C | 4627 | 4627 | 0 | 0 | 0.00% | 0.00% |  |
| D | 4627 | 4627 | 24 | 24 | 0.52% | 0.52% | 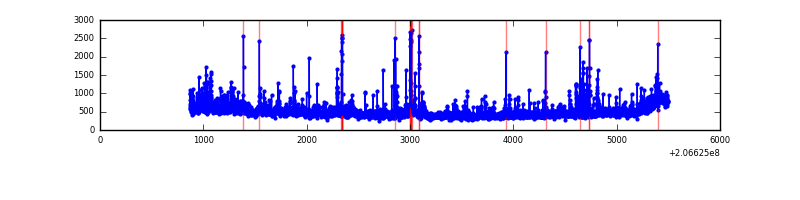 |
Top three noisy pixels from each quadrant. If the there are fewer than three noisy pixels in the level2.evt file, extra rows are filled as -1
| Pixel properties | Quadrant properties | ||||||
|---|---|---|---|---|---|---|---|
| Quadrant | DetID | PixID | Counts | Sigma | Mean | Median | Sigma |
| A | 13 | 251 | 2587302 | 24079.19 | 522 | 510 | 107.4 |
| A | 0 | 50 | 40557 | 372.78 | 522 | 510 | 107.4 |
| A | 13 | 14 | 6226 | 53.21 | 522 | 510 | 107.4 |
| B | 4 | 48 | 22601 | 209.72 | 545 | 534 | 105.2 |
| B | 15 | 204 | 13295 | 121.28 | 545 | 534 | 105.2 |
| B | 0 | 183 | 8526 | 75.95 | 545 | 534 | 105.2 |
| C | 9 | 16 | 22347 | 177.72 | 523 | 525 | 122.8 |
| C | 9 | 247 | 8517 | 65.08 | 523 | 525 | 122.8 |
| C | 12 | 4 | 6442 | 48.18 | 523 | 525 | 122.8 |
| D | 2 | 63 | 198251 | 1547.44 | 525 | 510 | 127.8 |
| D | 2 | 136 | 99358 | 773.55 | 525 | 510 | 127.8 |
| D | 2 | 14 | 34650 | 267.17 | 525 | 510 | 127.8 |
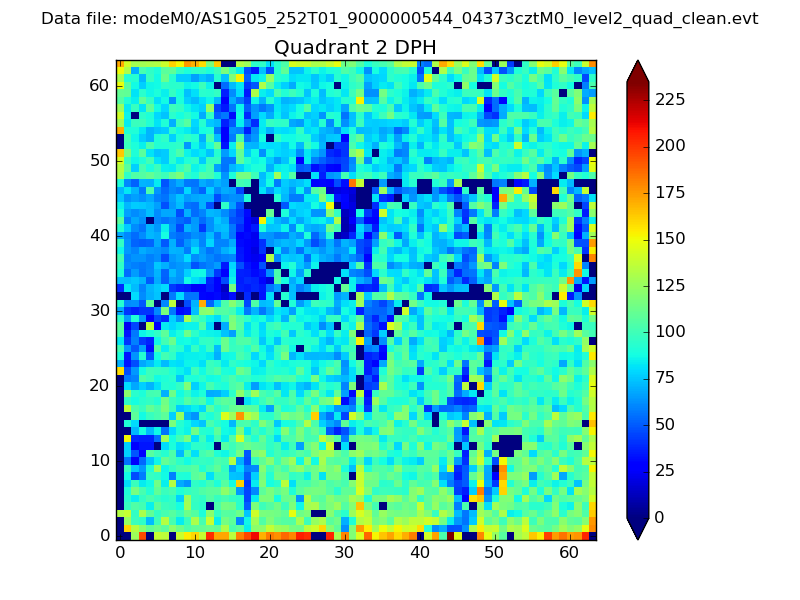
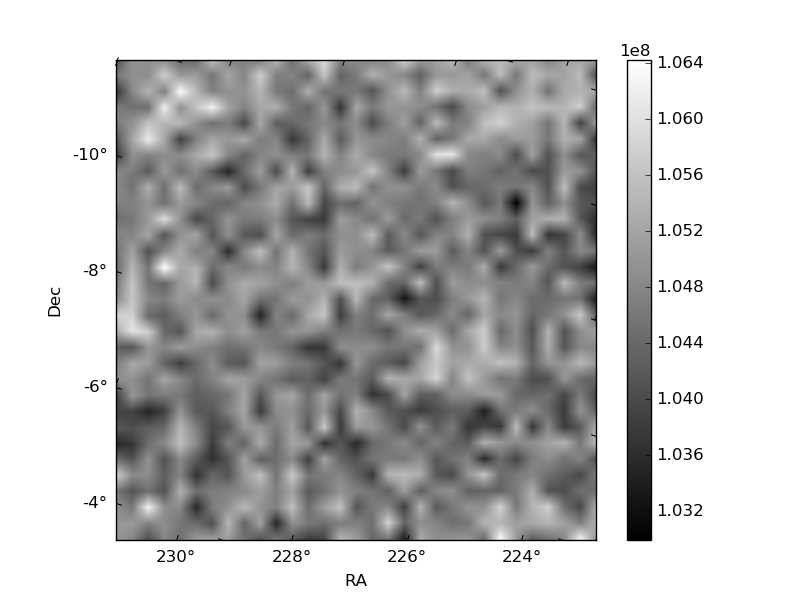
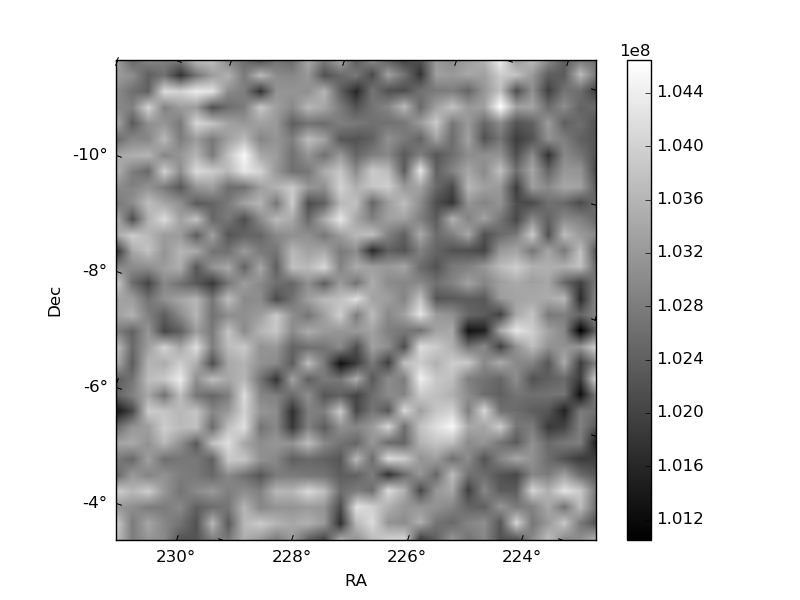
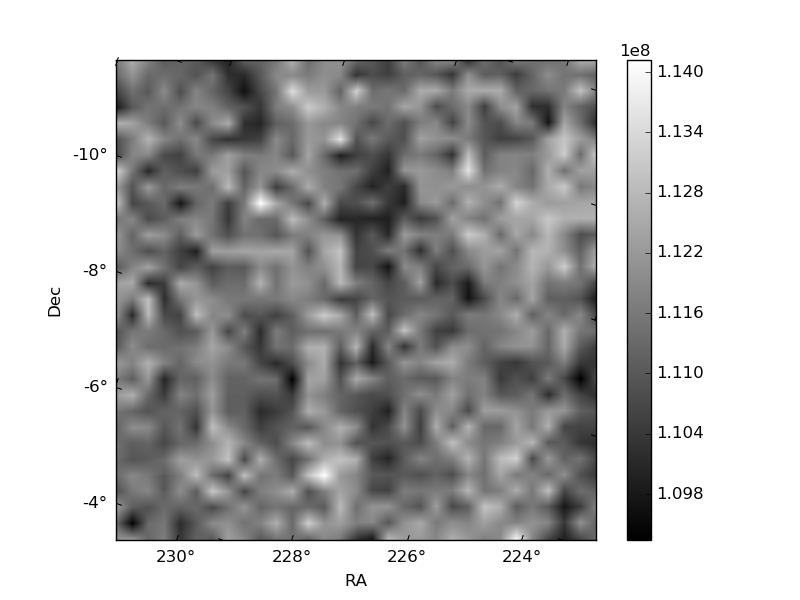
Histogram calculated using DETX and DETY for each event in the final _common_clean file
| Quadrant A | 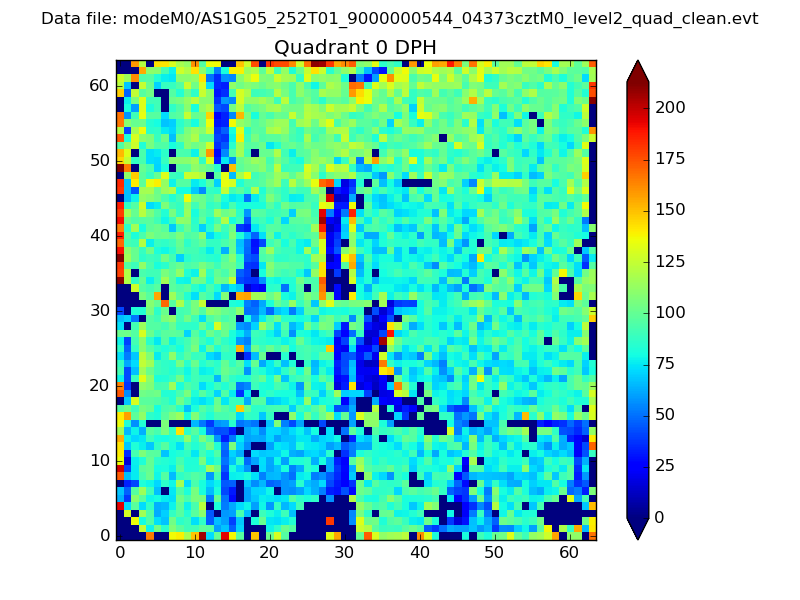 |
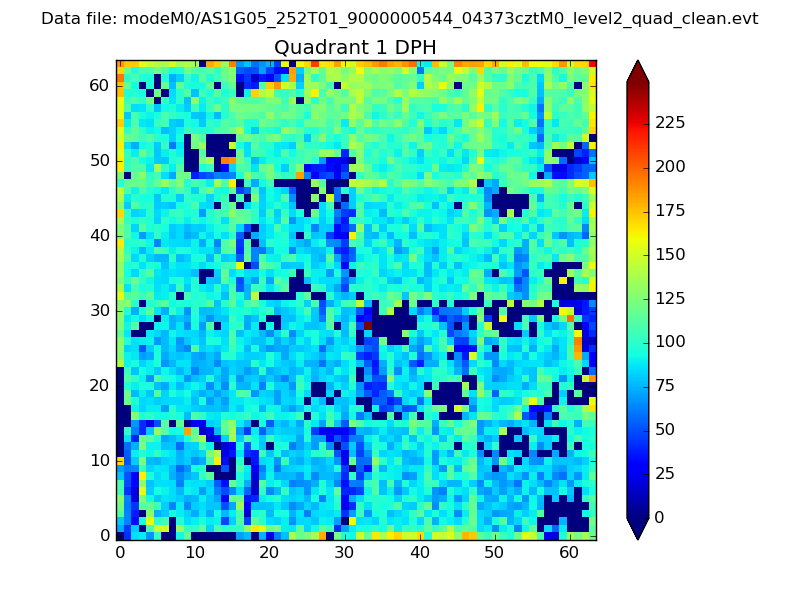 |
Quadrant B |
|---|---|---|---|
| Quadrant D | 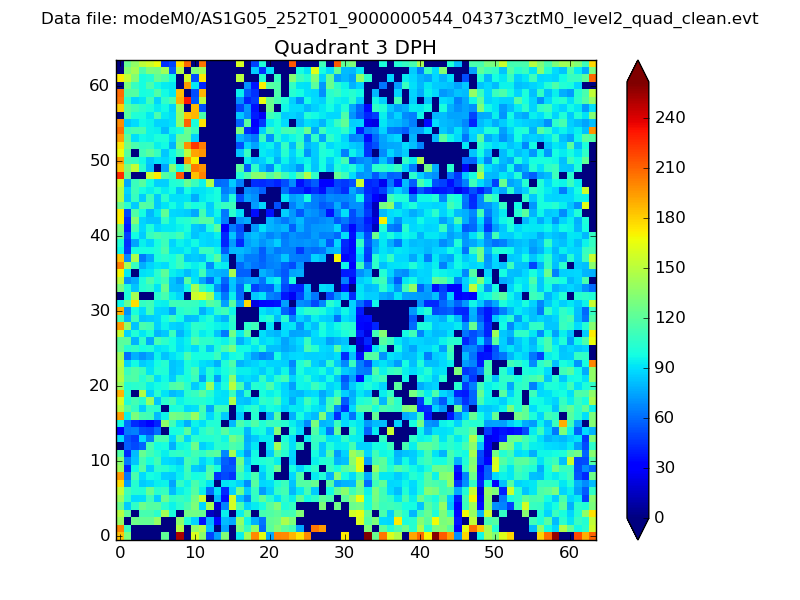 |
 |
Quadrant C |
| Plot type | Count rate plots | Images |
|---|---|---|
| Comparison with Poisson distribution Blue bars denote a histogram of data divided into 1 sec bins. Red curve is a Poisson curve with rate = median count rate of data. |
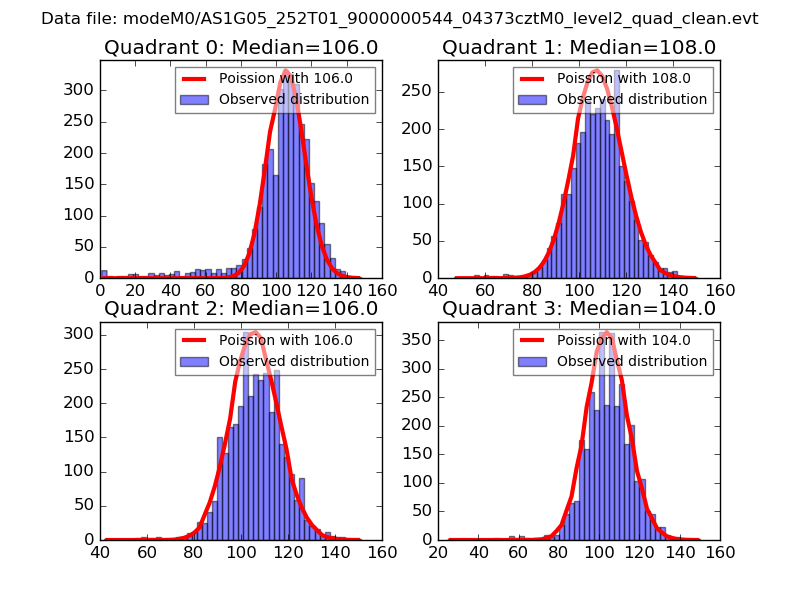 |
 |
| Quadrant-wise count rates Data is divided into 100 sec bins |
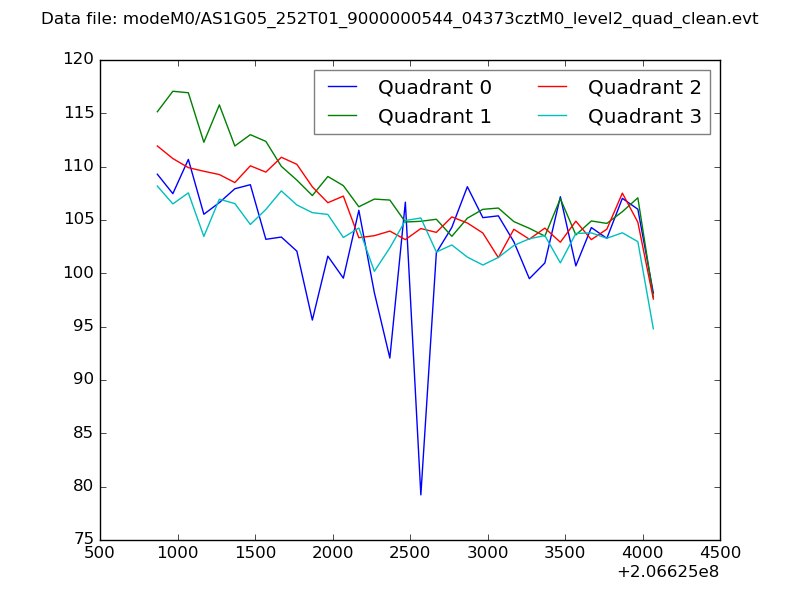 |
|
| Module-wise count rates for Quadrant A Data is divided into 100 sec bins |
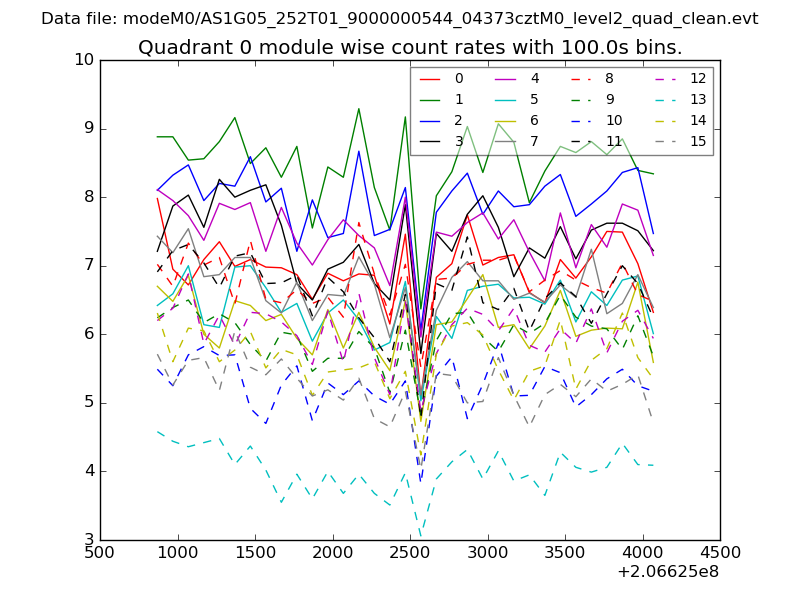 |
 |
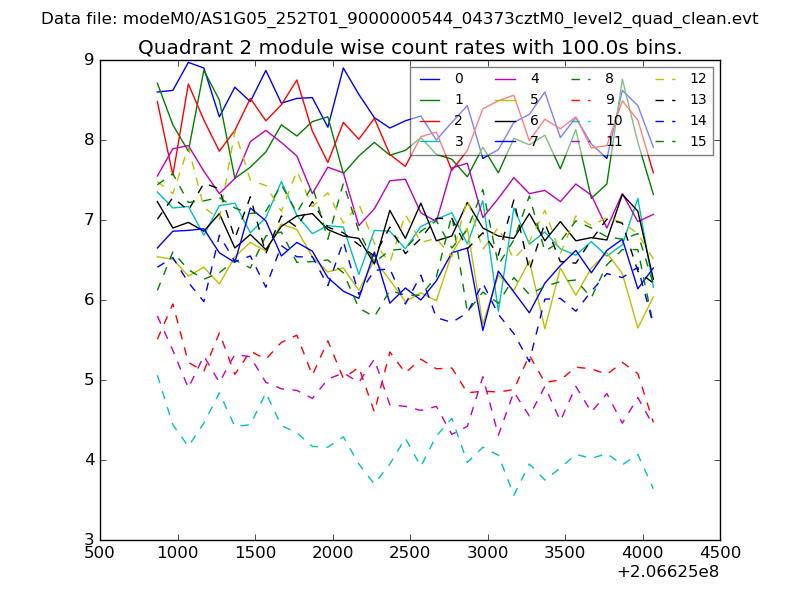
| Module-wise count rates for Quadrant B Data is divided into 100 sec bins |
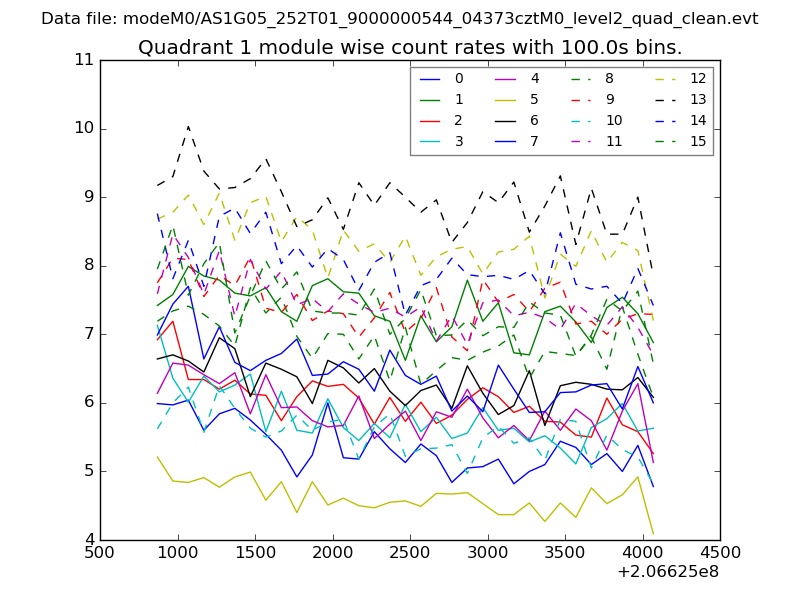 |
 |
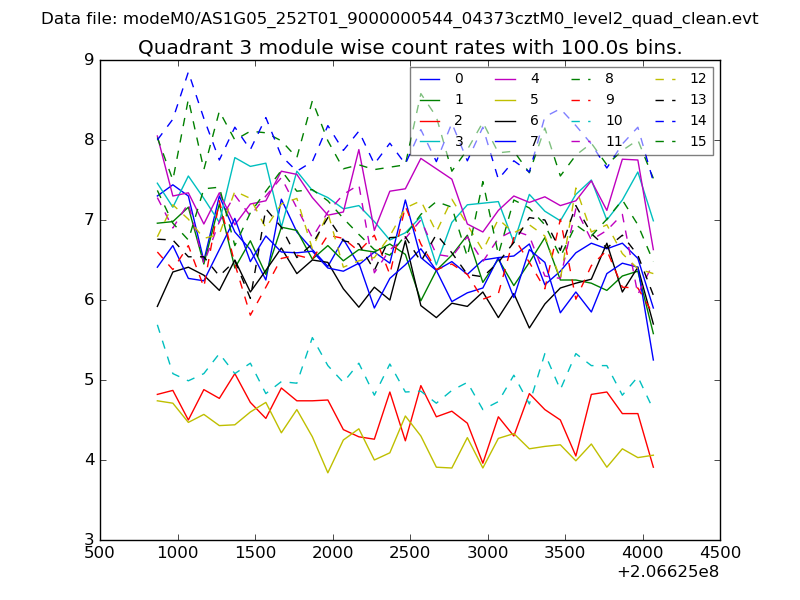
| Module-wise count rates for Quadrant C Data is divided into 100 sec bins |
 |
 |
| Module-wise count rates for Quadrant D Data is divided into 100 sec bins |
 |
 |
| Parameter | Plot |
|---|---|
| CZT HV Monitor | 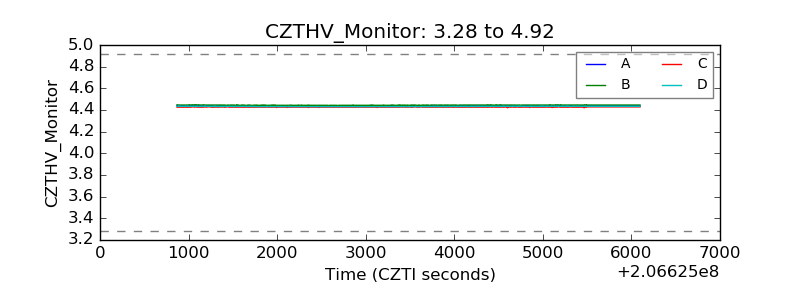 |
| D_VDD | 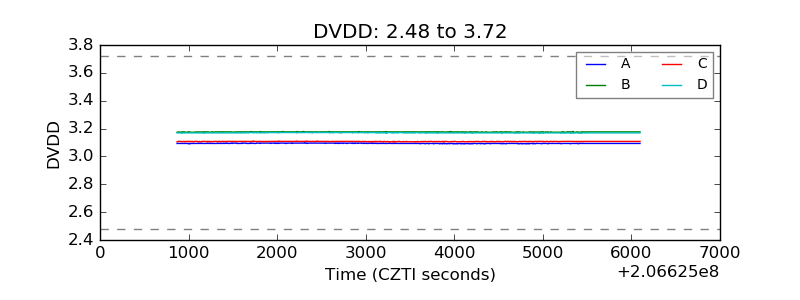 |
| Temperature 1 | 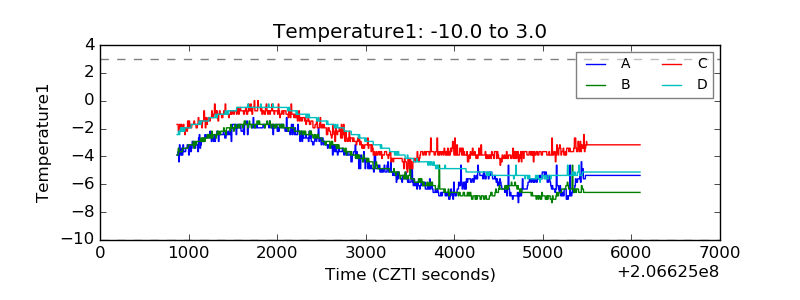 |
| Veto HV Monitor | 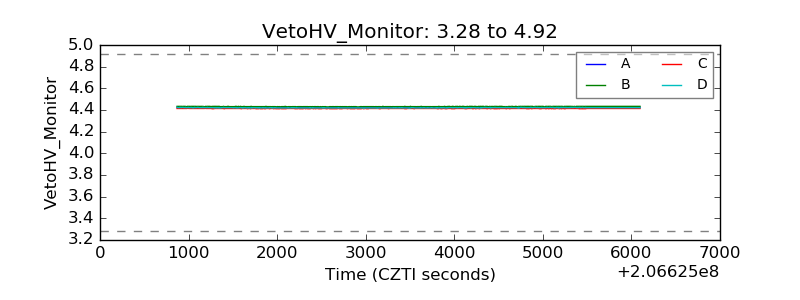 |
| Veto LLD | 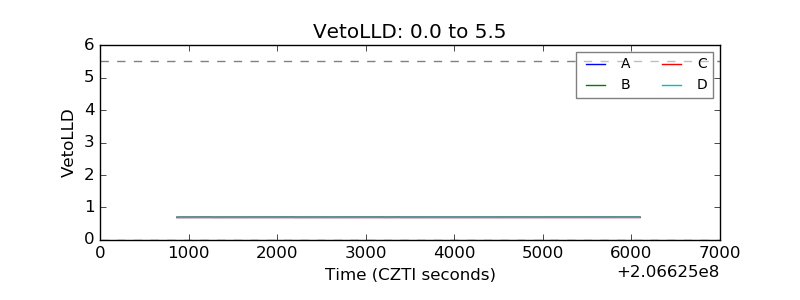 |
| Alpha Counter | 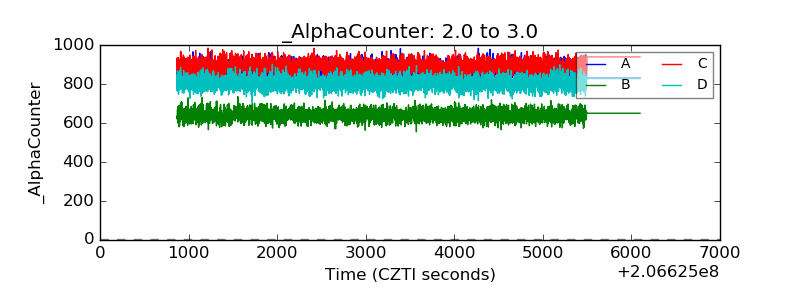 |
| _CPM_Rate | 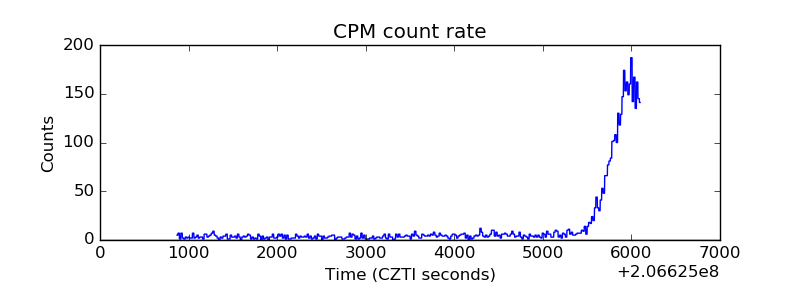 |
| CZT Counter | 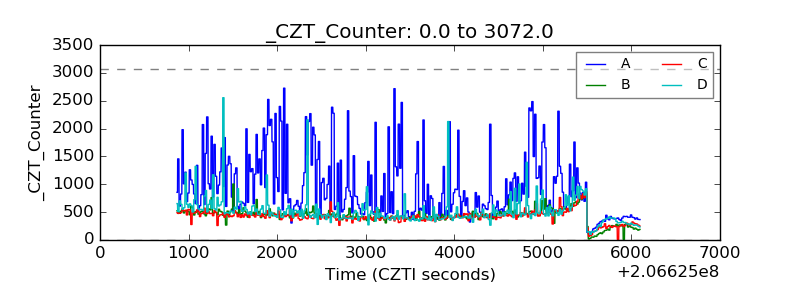 |
| +2.5 Volts monitor |  |
| +5 Volts monitor |  |
| _ROLL_ROT | 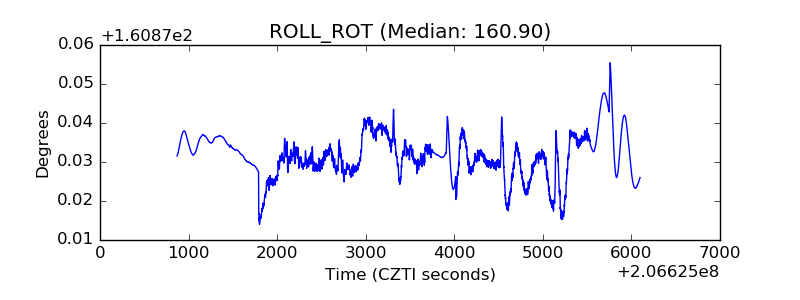 |
| _Roll_DEC | 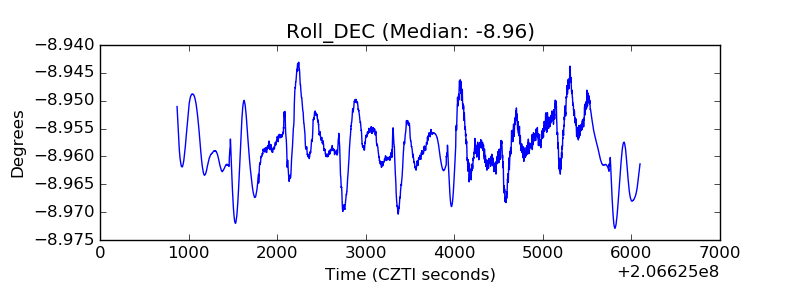 |
| _Roll_RA | 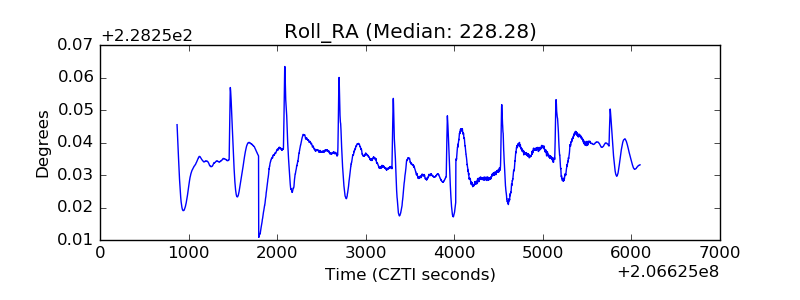 |
| Veto Counter | 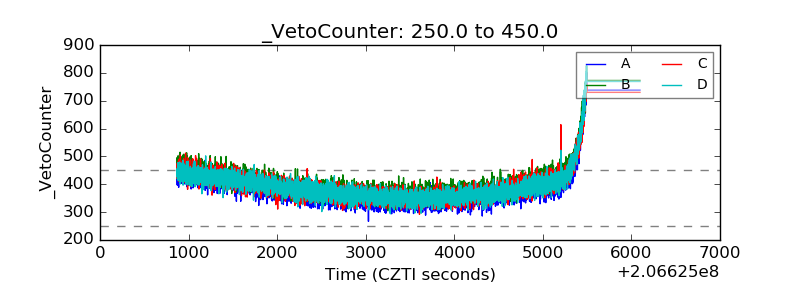 |