| Param | Original file | Final file |
|---|---|---|
| Filename | modeM0/AS1G05_252T01_9000000544_04374cztM0_level2.evt | modeM0/AS1G05_252T01_9000000544_04374cztM0_level2_quad_clean.evt |
| Size (bytes) | 541,840,320 | 78,747,840 |
| Size | 516.7 MB | 75.1 MB |
| Events in quadrant A | 5,694,362 | 476,153 |
| Events in quadrant B | 3,204,722 | 495,131 |
| Events in quadrant C | 3,445,679 | 475,691 |
| Events in quadrant D | 3,610,806 | 470,422 |
| Mode M0 | |||
|---|---|---|---|
| Quadrant | BADHDUFLAG | Total packets | Discarded packets |
| A | 0 | 21485 | 2 |
| B | 0 | 13927 | 1 |
| C | 0 | 14876 | 1 |
| D | 0 | 15389 | 1 |
| Mode SS | |||
|---|---|---|---|
| Quadrant | BADHDUFLAG | Total packets | Discarded packets |
| A | 0 | 138 | 0 |
| B | 0 | 138 | 0 |
| C | 0 | 138 | 0 |
| D | 0 | 138 | 0 |
| Mode M9 | |||
|---|---|---|---|
| Quadrant | BADHDUFLAG | Total packets | Discarded packets |
| A | 0 | 6 | 0 |
| B | 0 | 6 | 0 |
| C | 0 | 6 | 0 |
| D | 0 | 6 | 0 |
| Quadrant | Total seconds | Saturated seconds | Saturation percentage |
|---|---|---|---|
| A | 6692 | 577 | 8.622236% |
| B | 6692 | 65 | 0.971309% |
| C | 6692 | 107 | 1.598924% |
| D | 6692 | 101 | 1.509265% |
Noise dominated data is calculated using 1-second bins in cleaned event files. If a bin has >2000 counts, and if more than 50% of those come from <1% of pixels, then it is considered to be noise-dominated and hence unusable.
| Quadrant | # 1 sec bins | Bins with >0 counts | Bins with >2000 counts | High rate bins dominated by noise | Noise dominated (total time) | Noise dominated (detector-on time) | Marked lightcurve |
|---|---|---|---|---|---|---|---|
| A | 7337 | 6693 | 389 | 389 | 5.30% | 5.81% | 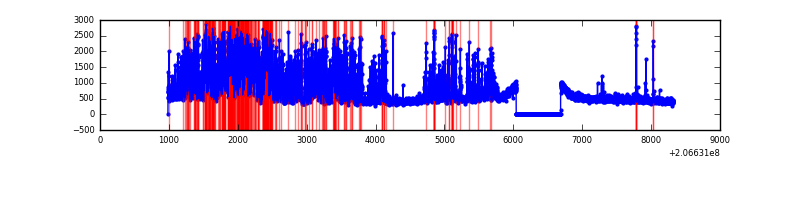 |
| B | 7336 | 6691 | 1 | 1 | 0.01% | 0.01% | 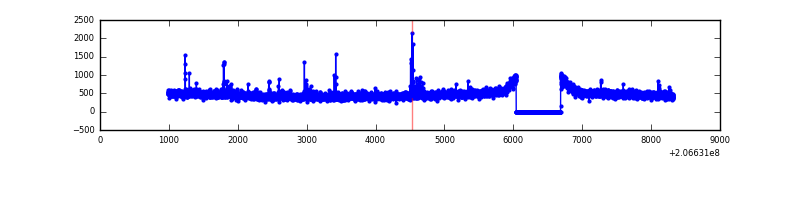 |
| C | 7336 | 6691 | 25 | 25 | 0.34% | 0.37% | 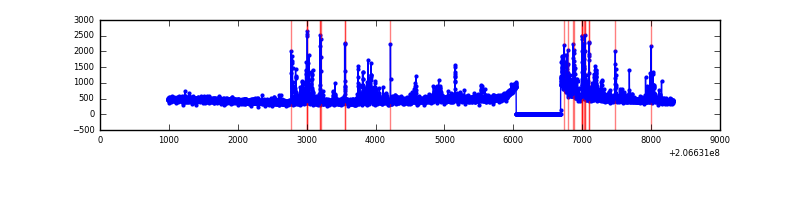 |
| D | 7337 | 6692 | 37 | 37 | 0.50% | 0.55% | 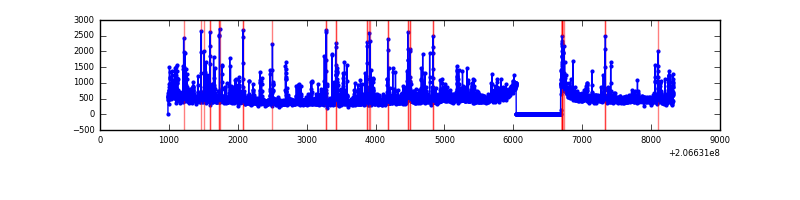 |
Top three noisy pixels from each quadrant. If the there are fewer than three noisy pixels in the level2.evt file, extra rows are filled as -1
| Pixel properties | Quadrant properties | ||||||
|---|---|---|---|---|---|---|---|
| Quadrant | DetID | PixID | Counts | Sigma | Mean | Median | Sigma |
| A | 13 | 251 | 2630802 | 16370.0 | 781 | 764 | 160.7 |
| A | 13 | 248 | 28244 | 171.04 | 781 | 764 | 160.7 |
| A | 13 | 14 | 12342 | 72.06 | 781 | 764 | 160.7 |
| B | 4 | 48 | 52715 | 333.62 | 801 | 783 | 155.7 |
| B | 0 | 183 | 17374 | 106.58 | 801 | 783 | 155.7 |
| B | 8 | 3 | 14826 | 90.21 | 801 | 783 | 155.7 |
| C | 14 | 48 | 354568 | 1965.45 | 763 | 766 | 180.0 |
| C | 9 | 247 | 68780 | 377.83 | 763 | 766 | 180.0 |
| C | 12 | 4 | 18808 | 100.23 | 763 | 766 | 180.0 |
| D | 2 | 63 | 272776 | 1454.51 | 768 | 745 | 187.0 |
| D | 4 | 95 | 141554 | 752.89 | 768 | 745 | 187.0 |
| D | 2 | 136 | 115661 | 614.44 | 768 | 745 | 187.0 |
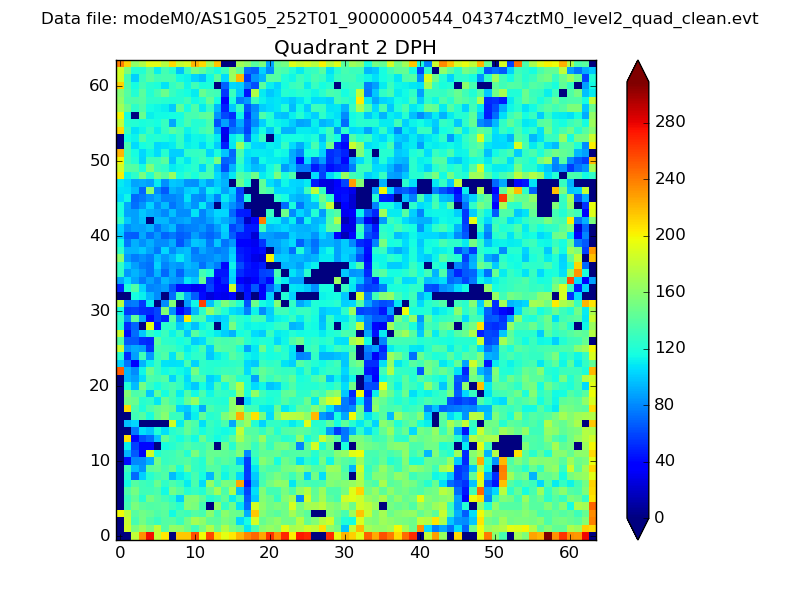
Histogram calculated using DETX and DETY for each event in the final _common_clean file
| Quadrant A | 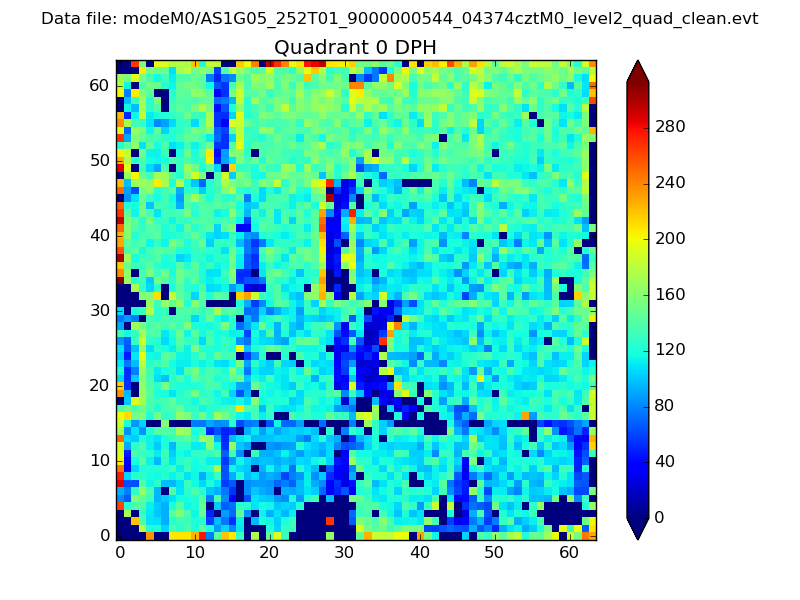 |
 |
Quadrant B |
|---|---|---|---|
| Quadrant D | 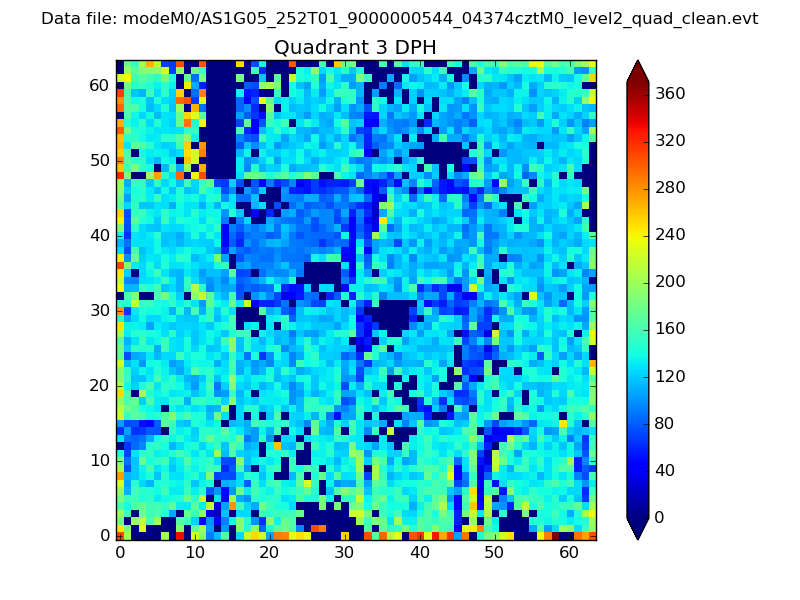 |
 |
Quadrant C |
| Plot type | Count rate plots | Images |
|---|---|---|
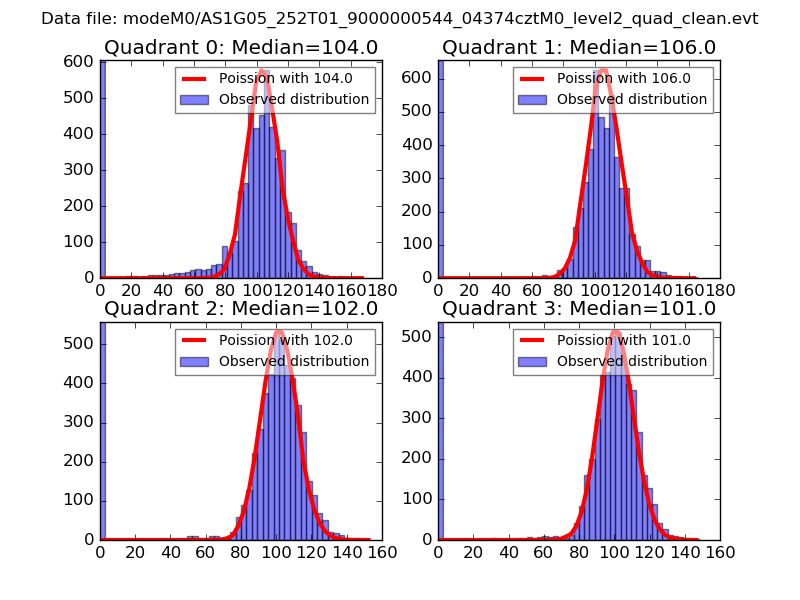
| Comparison with Poisson distribution Blue bars denote a histogram of data divided into 1 sec bins. Red curve is a Poisson curve with rate = median count rate of data. |
 |
 |
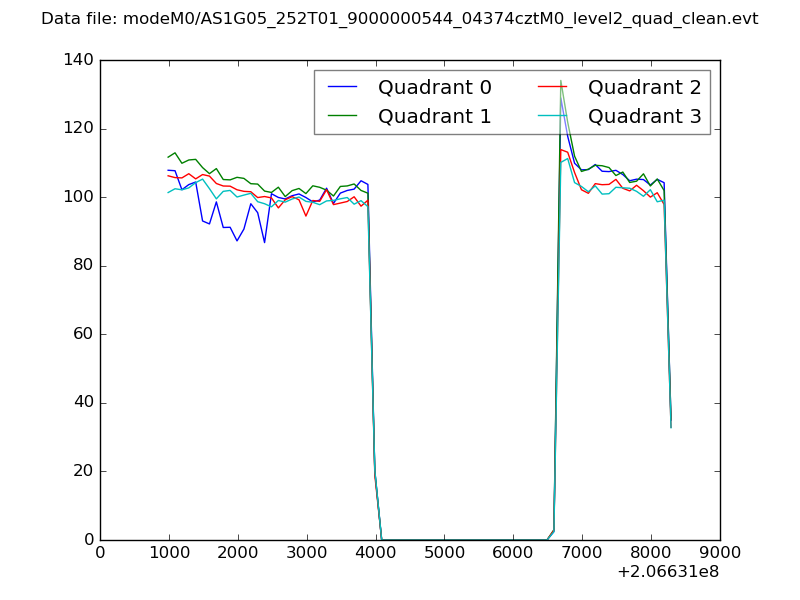
| Quadrant-wise count rates Data is divided into 100 sec bins |
 |
|
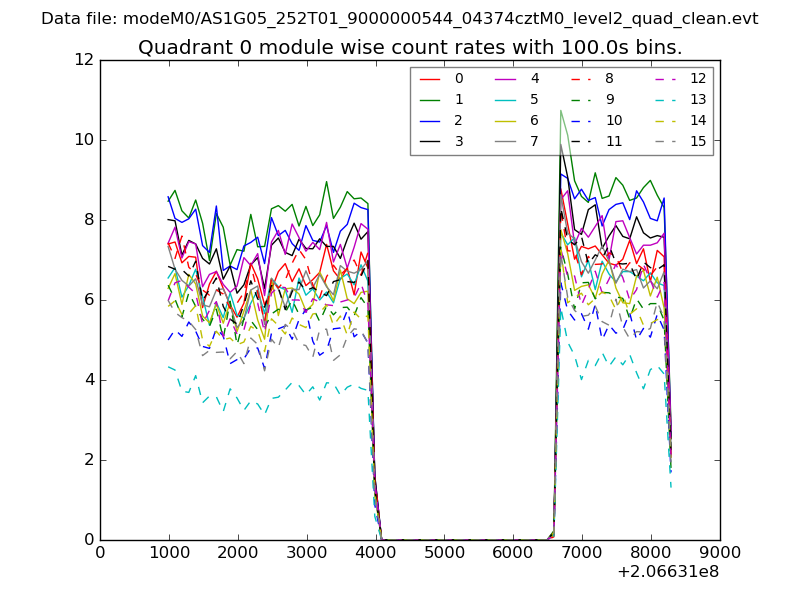
| Module-wise count rates for Quadrant A Data is divided into 100 sec bins |
 |
 |
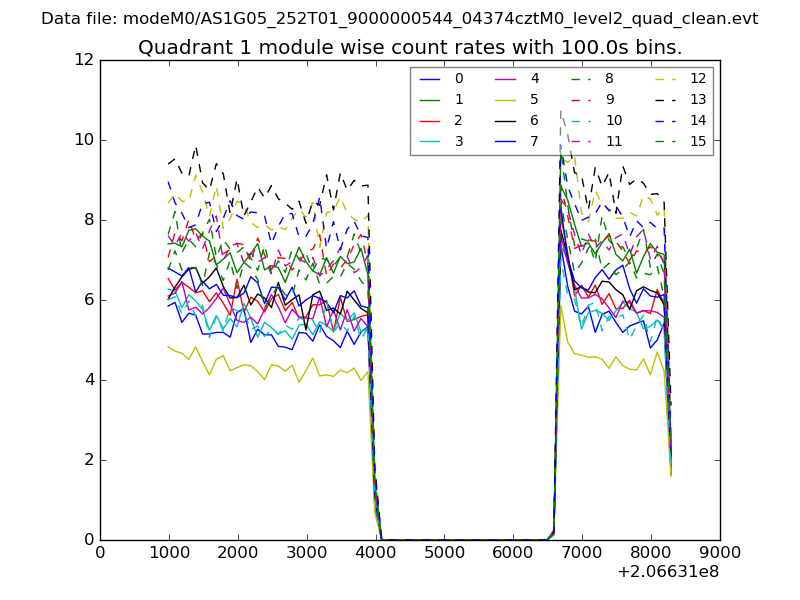
| Module-wise count rates for Quadrant B Data is divided into 100 sec bins |
 |
 |
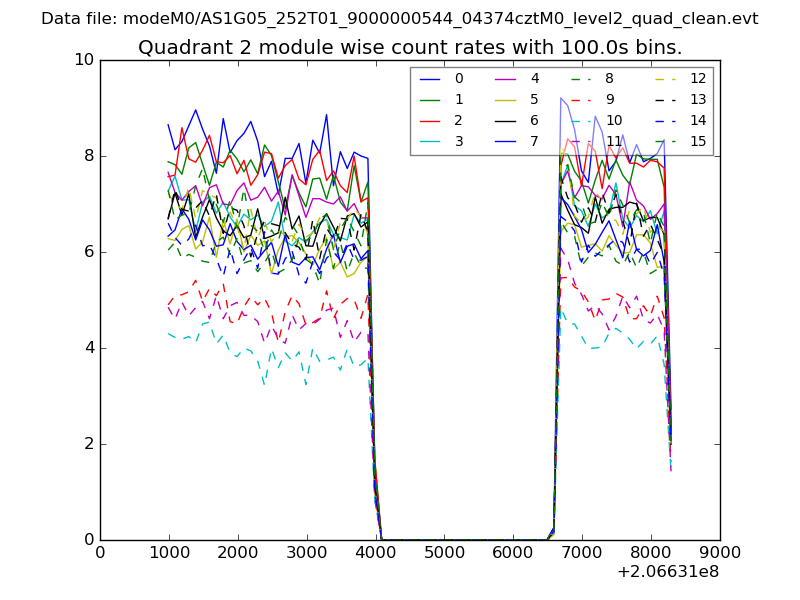
| Module-wise count rates for Quadrant C Data is divided into 100 sec bins |
 |
 |
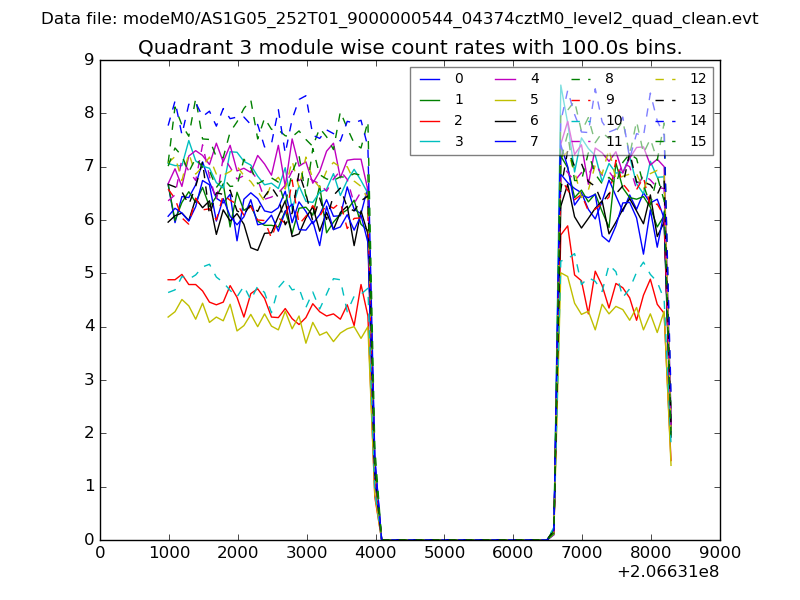
| Module-wise count rates for Quadrant D Data is divided into 100 sec bins |
 |
 |
| Parameter | Plot |
|---|---|
| CZT HV Monitor | 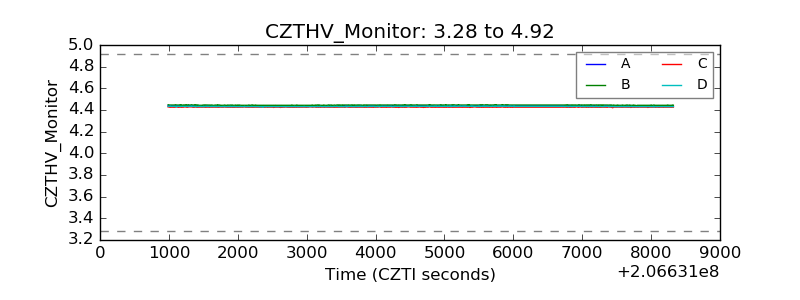 |
| D_VDD | 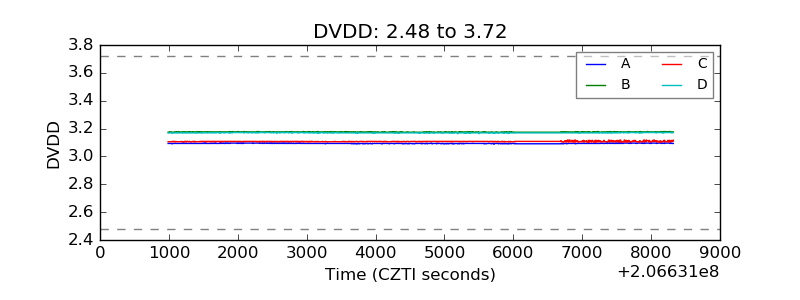 |
| Temperature 1 | 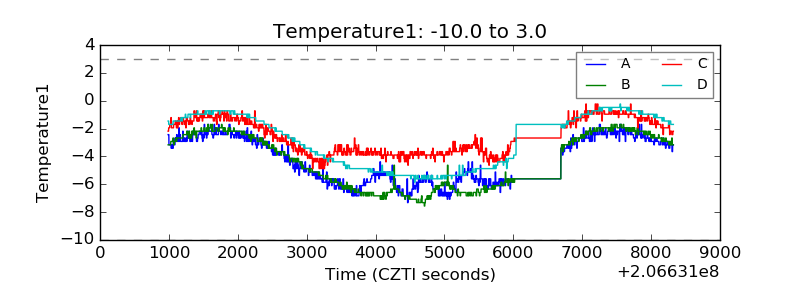 |
| Veto HV Monitor | 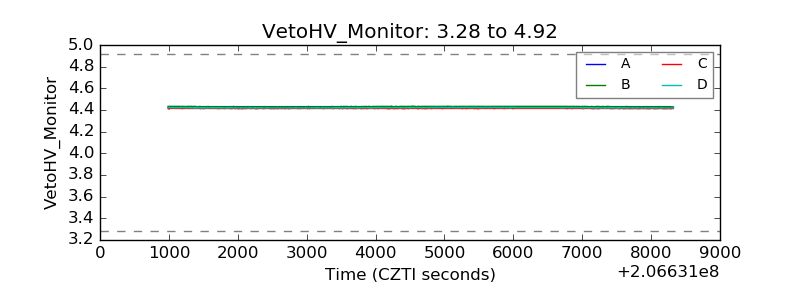 |
| Veto LLD | 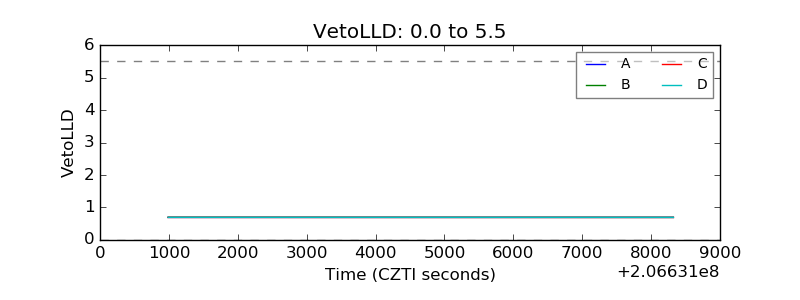 |
| Alpha Counter | 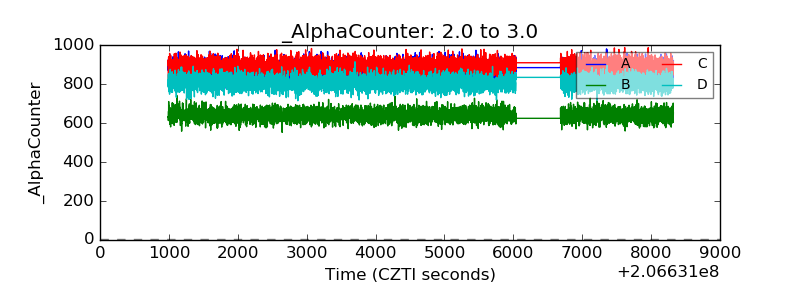 |
| _CPM_Rate | 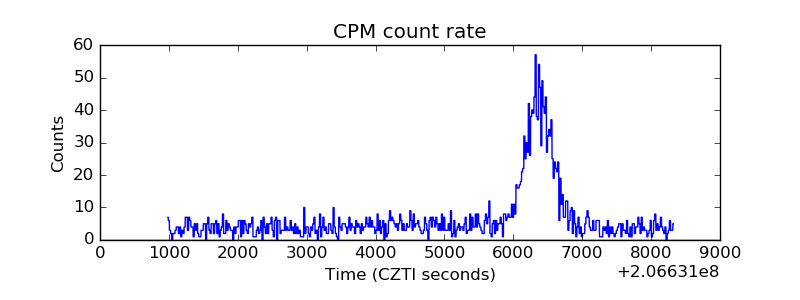 |
| CZT Counter | 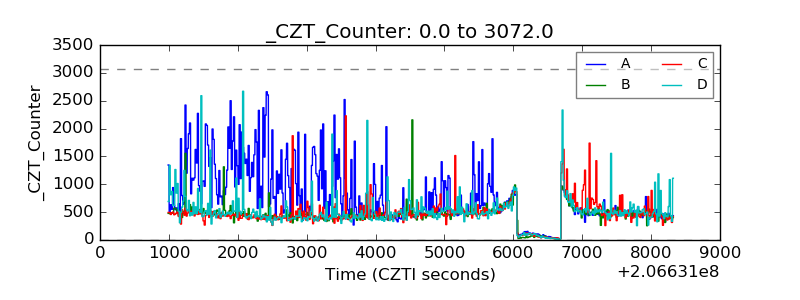 |
| +2.5 Volts monitor |  |
| +5 Volts monitor |  |
| _ROLL_ROT | 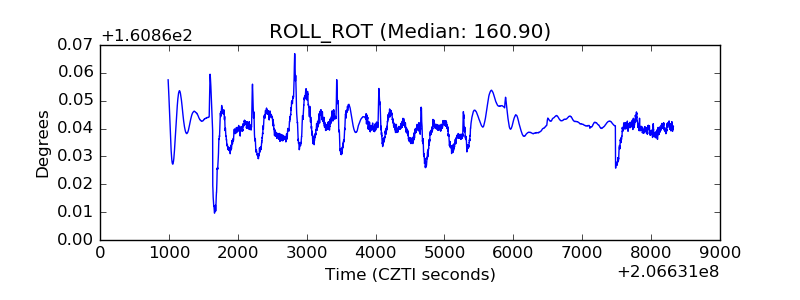 |
| _Roll_DEC | 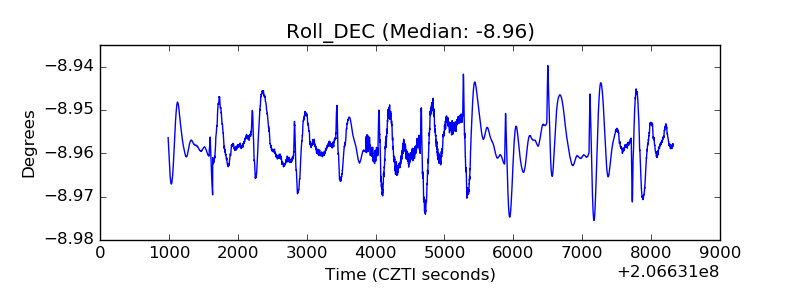 |
| _Roll_RA | 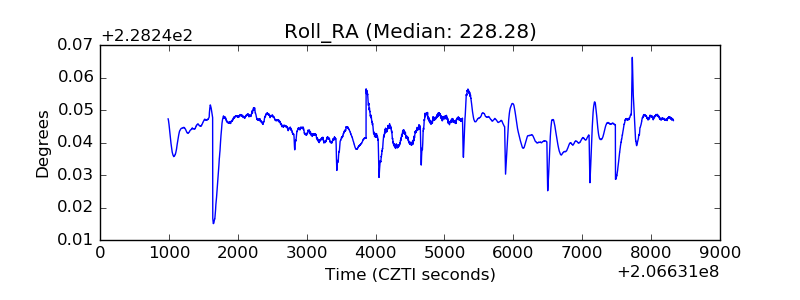 |
| Veto Counter | 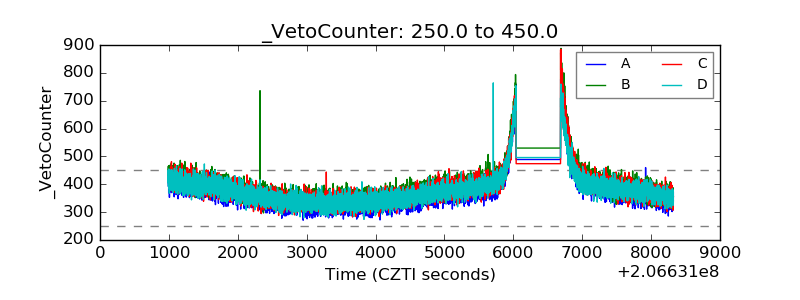 |