| Param | Original file | Final file |
|---|---|---|
| Filename | modeM0/AS1G05_252T01_9000000544_04375cztM0_level2.evt | modeM0/AS1G05_252T01_9000000544_04375cztM0_level2_quad_clean.evt |
| Size (bytes) | 508,268,160 | 83,779,200 |
| Size | 484.7 MB | 79.9 MB |
| Events in quadrant A | 3,451,304 | 521,976 |
| Events in quadrant B | 3,369,323 | 521,290 |
| Events in quadrant C | 4,211,958 | 494,960 |
| Events in quadrant D | 3,869,887 | 495,753 |
| Mode M0 | |||
|---|---|---|---|
| Quadrant | BADHDUFLAG | Total packets | Discarded packets |
| A | 0 | 15236 | 2 |
| B | 0 | 14899 | 1 |
| C | 0 | 17491 | 1 |
| D | 0 | 16619 | 1 |
| Mode SS | |||
|---|---|---|---|
| Quadrant | BADHDUFLAG | Total packets | Discarded packets |
| A | 0 | 146 | 0 |
| B | 0 | 146 | 0 |
| C | 0 | 146 | 0 |
| D | 0 | 146 | 0 |
| Mode M9 | |||
|---|---|---|---|
| Quadrant | BADHDUFLAG | Total packets | Discarded packets |
| A | 0 | 3 | 0 |
| B | 0 | 3 | 0 |
| C | 0 | 3 | 0 |
| D | 0 | 3 | 0 |
| Quadrant | Total seconds | Saturated seconds | Saturation percentage |
|---|---|---|---|
| A | 7224 | 58 | 0.802879% |
| B | 7224 | 42 | 0.581395% |
| C | 7224 | 215 | 2.976190% |
| D | 7224 | 89 | 1.232004% |
Noise dominated data is calculated using 1-second bins in cleaned event files. If a bin has >2000 counts, and if more than 50% of those come from <1% of pixels, then it is considered to be noise-dominated and hence unusable.
| Quadrant | # 1 sec bins | Bins with >0 counts | Bins with >2000 counts | High rate bins dominated by noise | Noise dominated (total time) | Noise dominated (detector-on time) | Marked lightcurve |
|---|---|---|---|---|---|---|---|
| A | 7564 | 7224 | 17 | 17 | 0.22% | 0.24% | 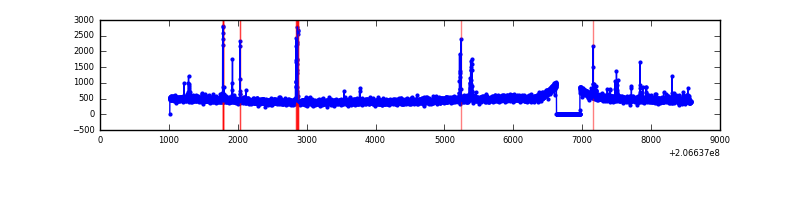 |
| B | 7564 | 7224 | 0 | 0 | 0.00% | 0.00% | 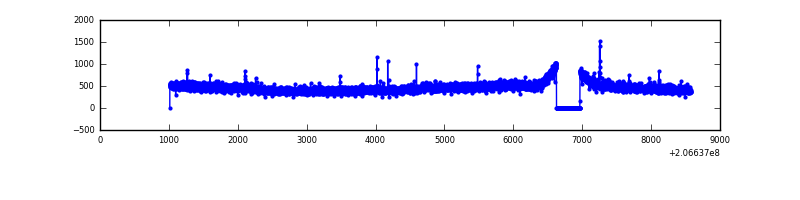 |
| C | 7564 | 7224 | 183 | 183 | 2.42% | 2.53% | 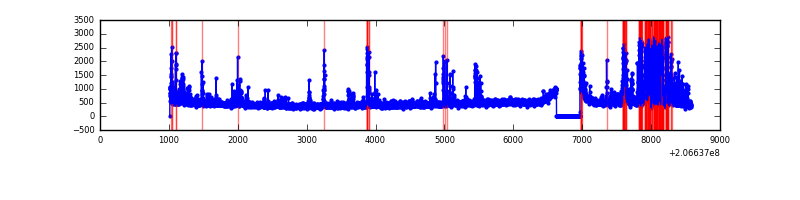 |
| D | 7564 | 7224 | 52 | 52 | 0.69% | 0.72% | 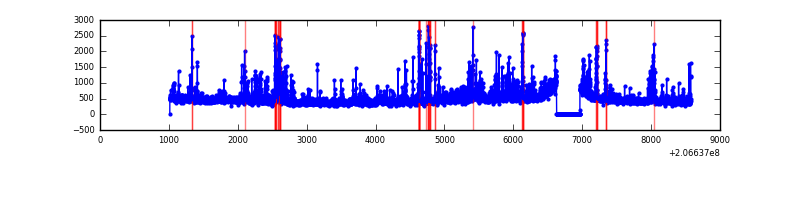 |
Top three noisy pixels from each quadrant. If the there are fewer than three noisy pixels in the level2.evt file, extra rows are filled as -1
| Pixel properties | Quadrant properties | ||||||
|---|---|---|---|---|---|---|---|
| Quadrant | DetID | PixID | Counts | Sigma | Mean | Median | Sigma |
| A | 0 | 50 | 59364 | 332.02 | 851 | 831 | 176.3 |
| A | 13 | 248 | 34884 | 193.16 | 851 | 831 | 176.3 |
| A | 15 | 234 | 26263 | 144.26 | 851 | 831 | 176.3 |
| B | 15 | 54 | 15370 | 87.32 | 856 | 836 | 166.4 |
| B | 12 | 111 | 13608 | 76.73 | 856 | 836 | 166.4 |
| B | 8 | 3 | 12153 | 67.99 | 856 | 836 | 166.4 |
| C | 14 | 48 | 898008 | 4723.03 | 810 | 815 | 190.0 |
| C | 9 | 16 | 82777 | 431.46 | 810 | 815 | 190.0 |
| C | 9 | 247 | 20694 | 104.65 | 810 | 815 | 190.0 |
| D | 2 | 63 | 337585 | 1678.49 | 820 | 795 | 200.7 |
| D | 2 | 136 | 261966 | 1301.62 | 820 | 795 | 200.7 |
| D | 10 | 172 | 49463 | 242.55 | 820 | 795 | 200.7 |
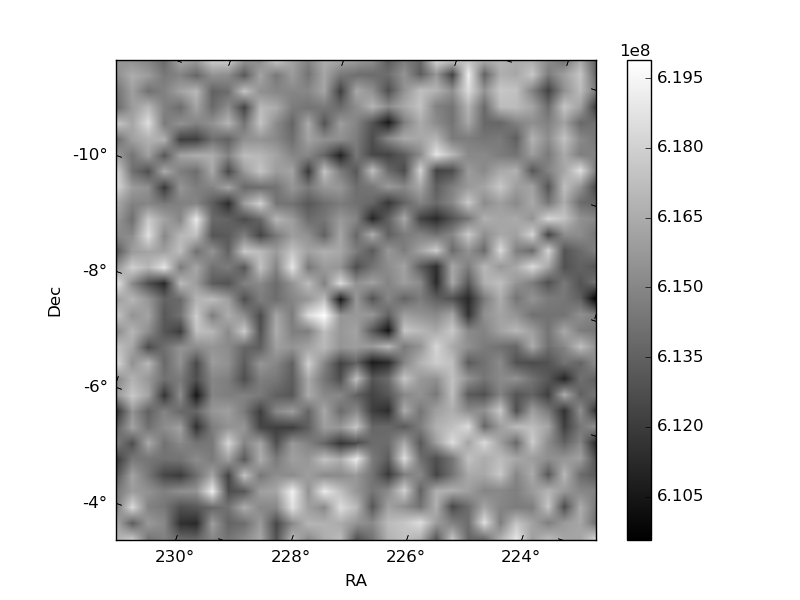
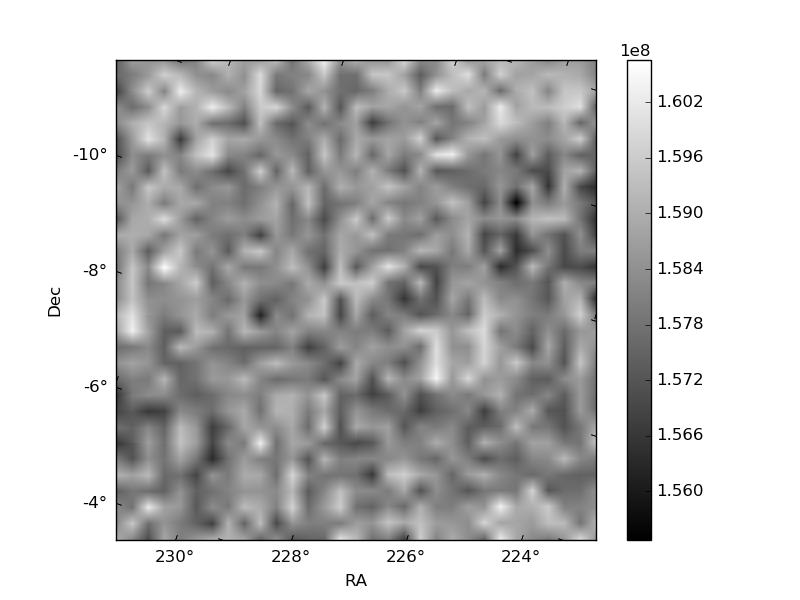
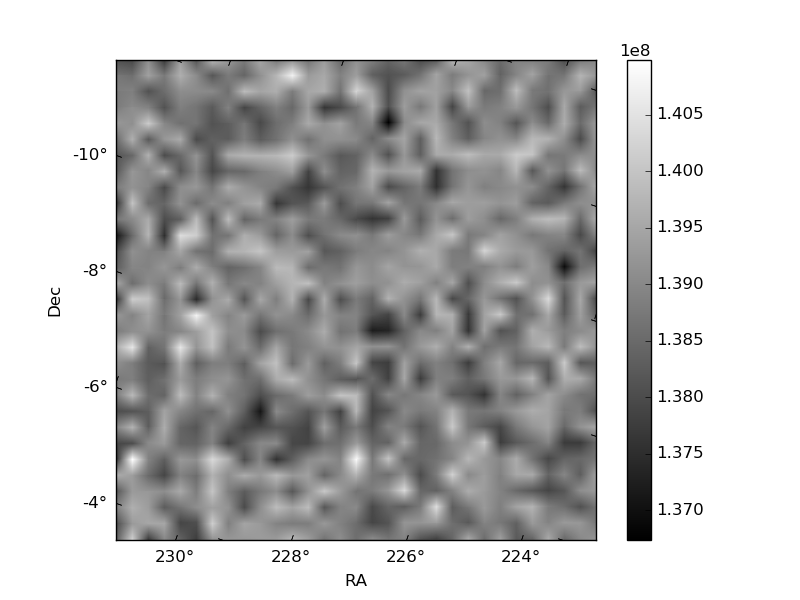
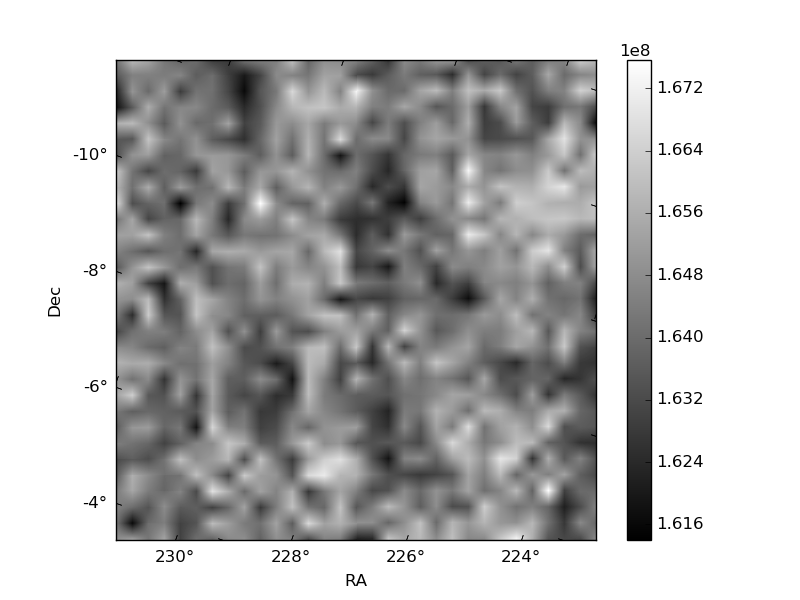
Histogram calculated using DETX and DETY for each event in the final _common_clean file
| Quadrant A | 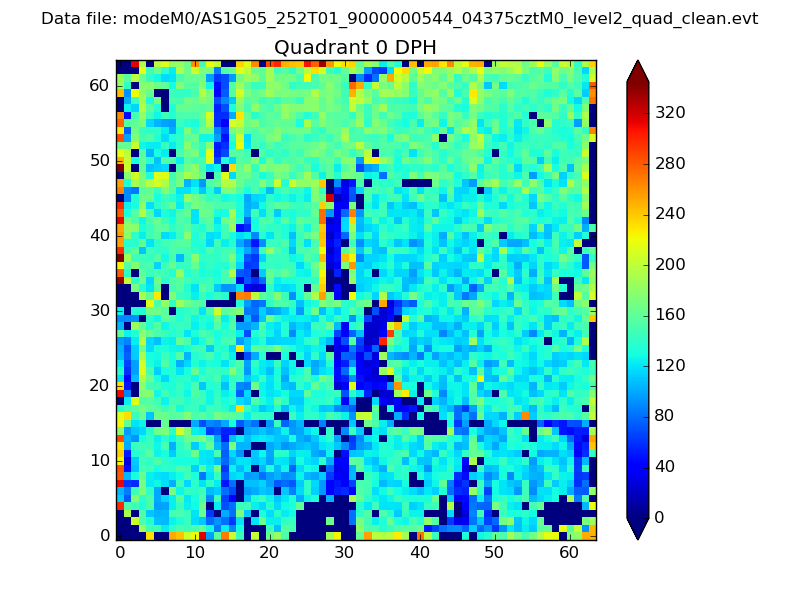 |
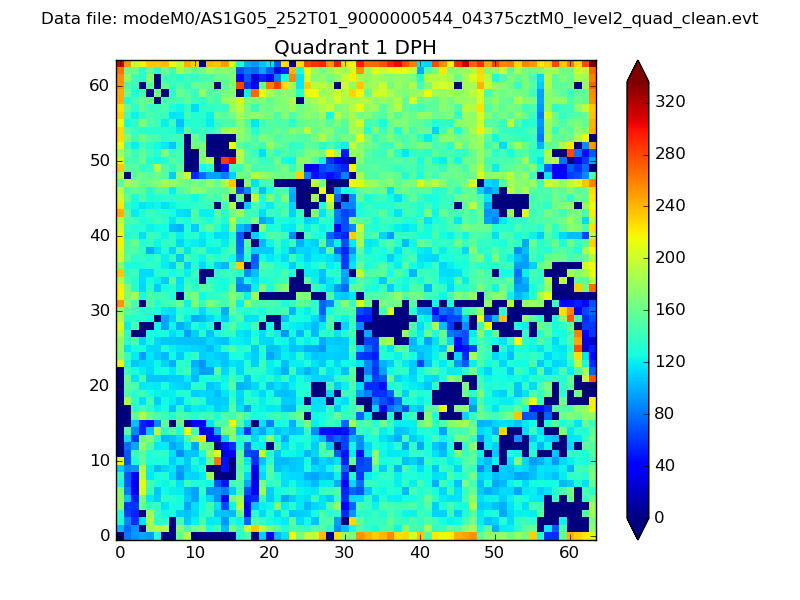 |
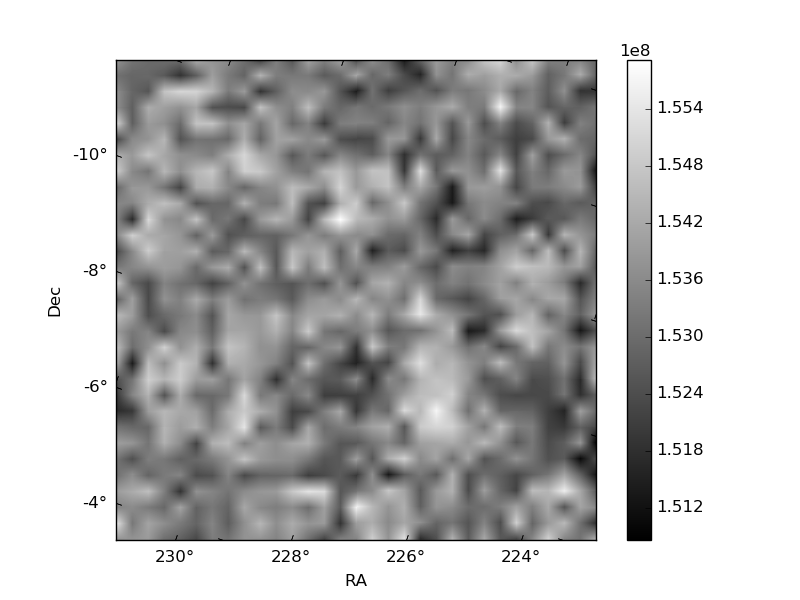
Quadrant B |
|---|---|---|---|
| Quadrant D | 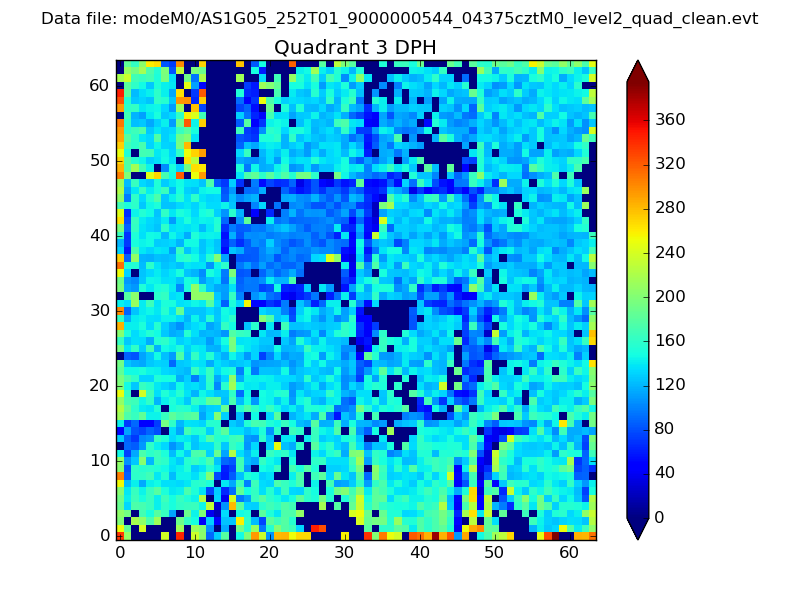 |
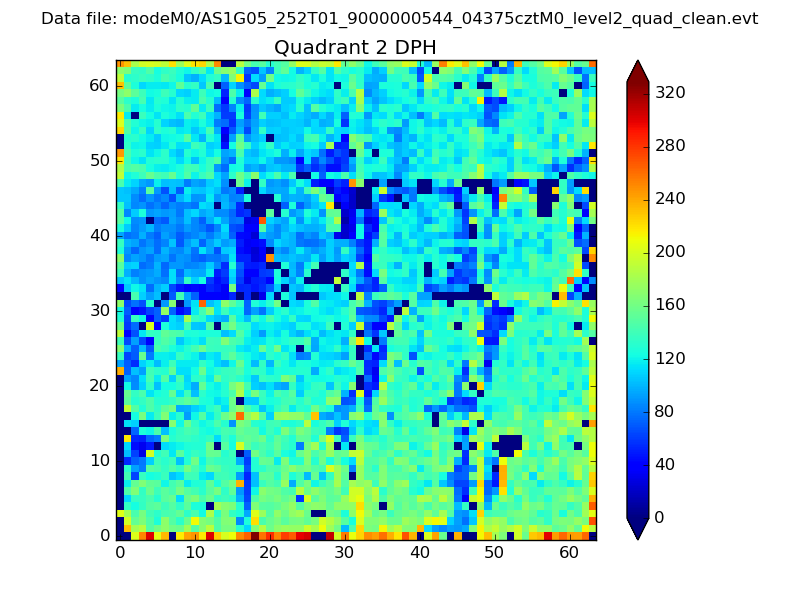 |
Quadrant C |
| Plot type | Count rate plots | Images |
|---|---|---|
| Comparison with Poisson distribution Blue bars denote a histogram of data divided into 1 sec bins. Red curve is a Poisson curve with rate = median count rate of data. |
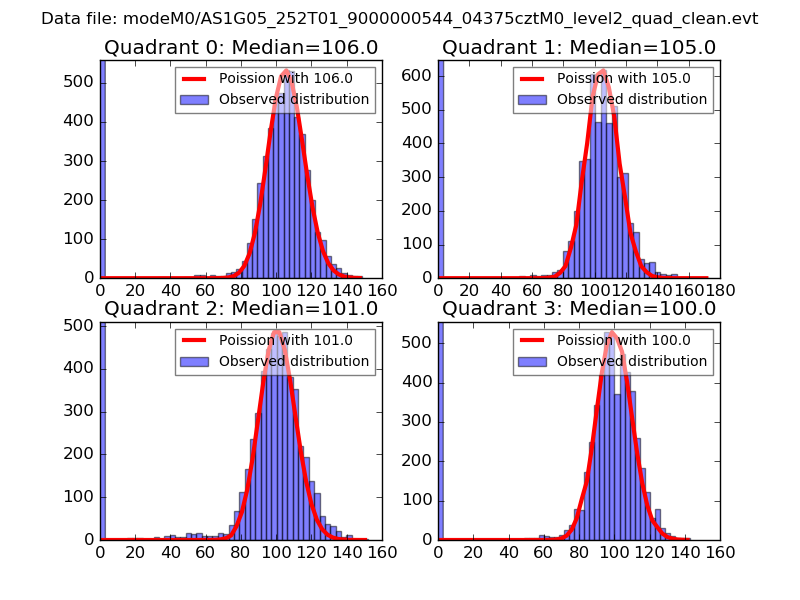 |
 |
| Quadrant-wise count rates Data is divided into 100 sec bins |
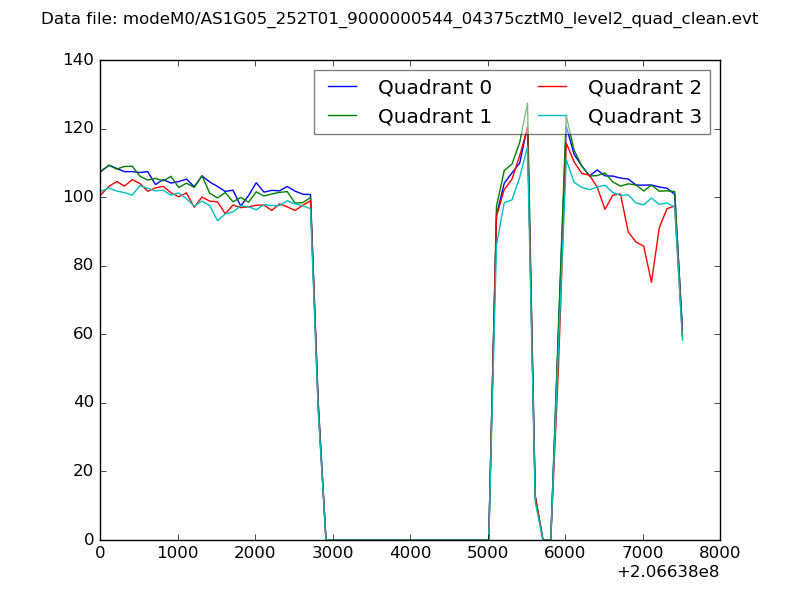 |
|
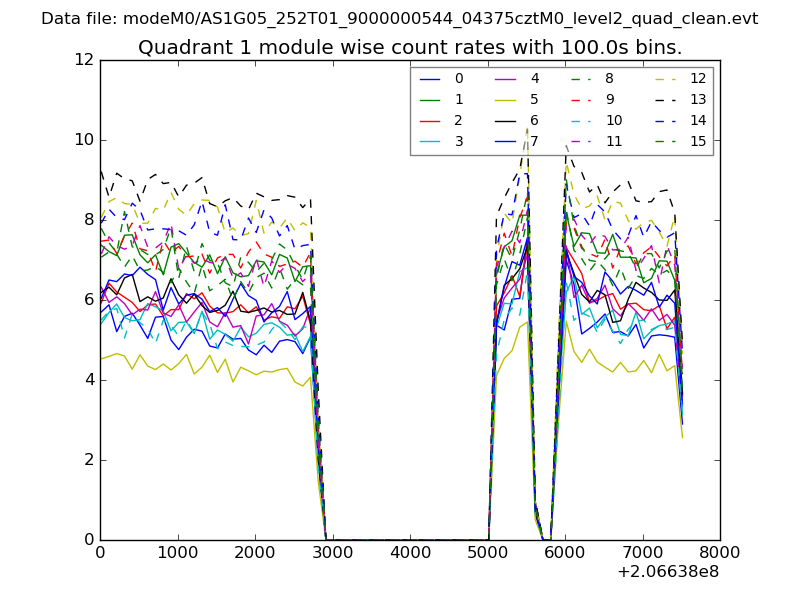
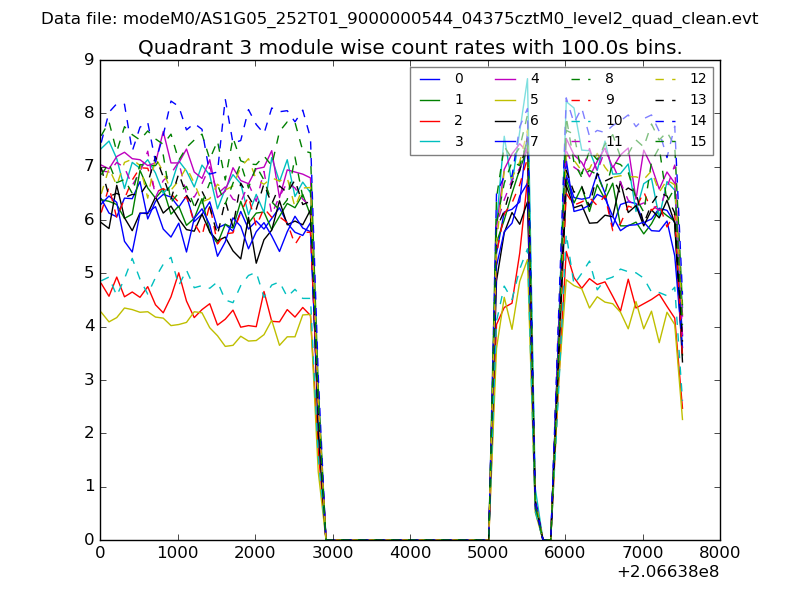
| Module-wise count rates for Quadrant A Data is divided into 100 sec bins |
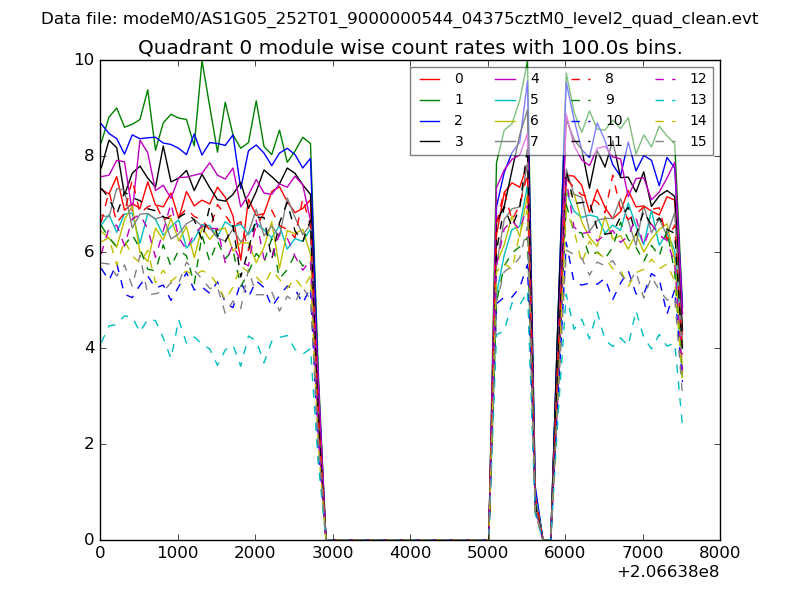 |
 |
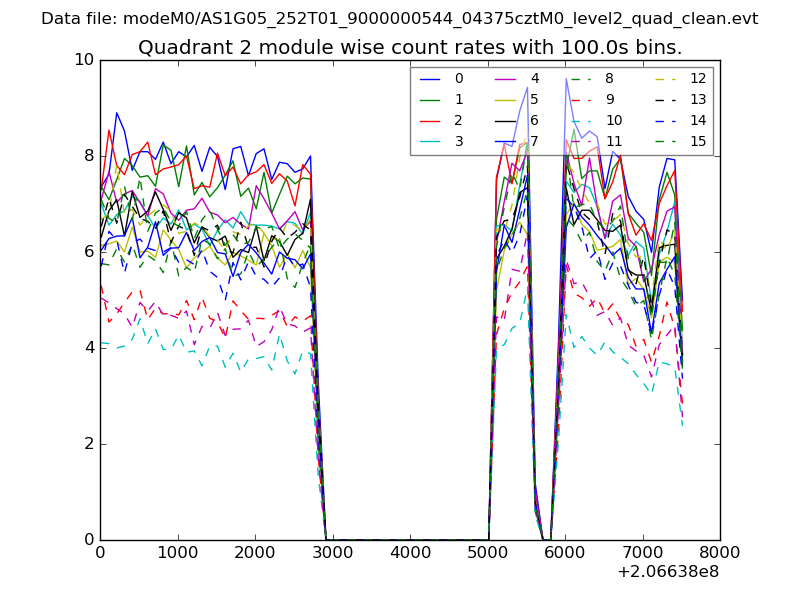
| Module-wise count rates for Quadrant B Data is divided into 100 sec bins |
 |
 |
| Module-wise count rates for Quadrant C Data is divided into 100 sec bins |
 |
 |
| Module-wise count rates for Quadrant D Data is divided into 100 sec bins |
 |
 |
| Parameter | Plot |
|---|---|
| CZT HV Monitor | 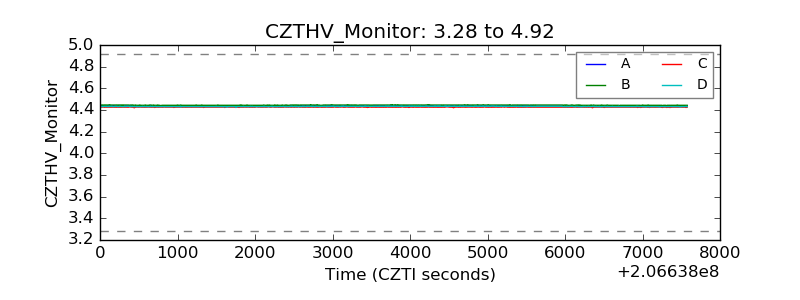 |
| D_VDD | 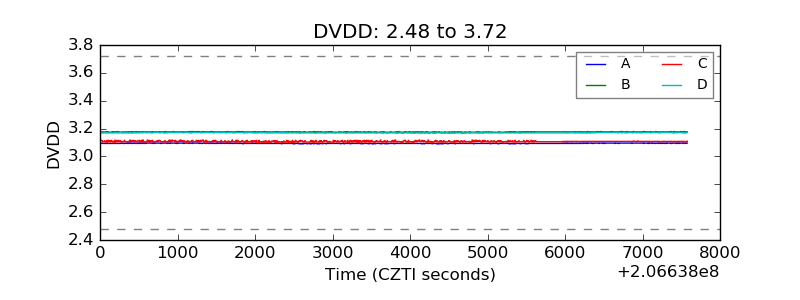 |
| Temperature 1 | 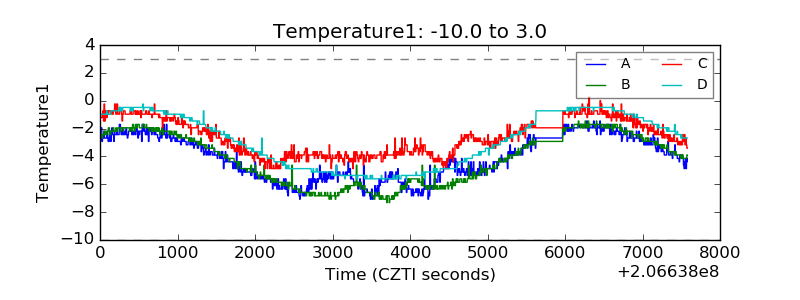 |
| Veto HV Monitor | 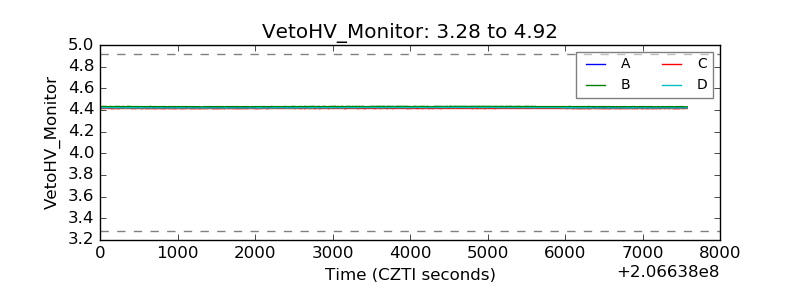 |
| Veto LLD | 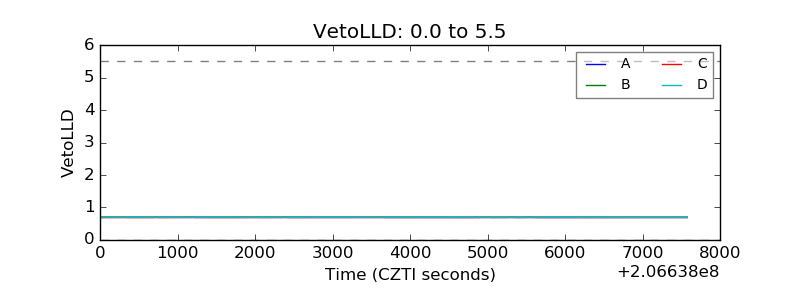 |
| Alpha Counter | 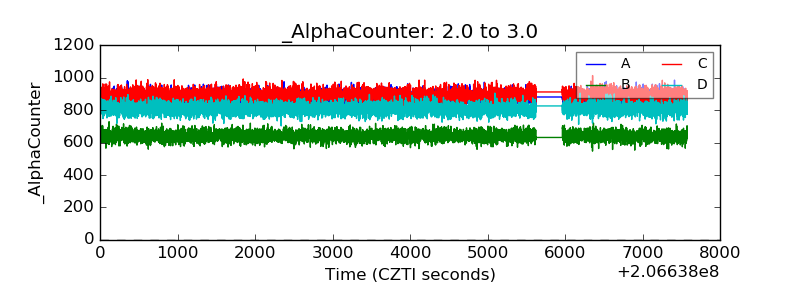 |
| _CPM_Rate | 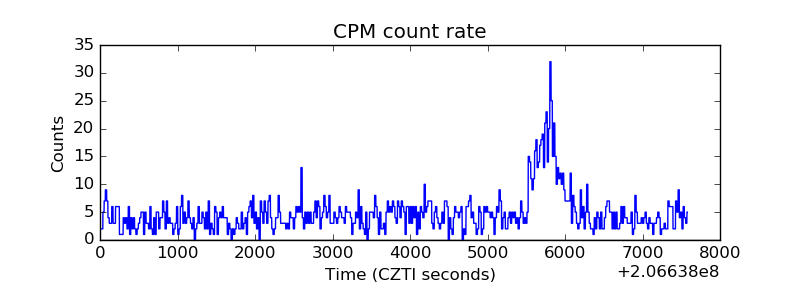 |
| CZT Counter | 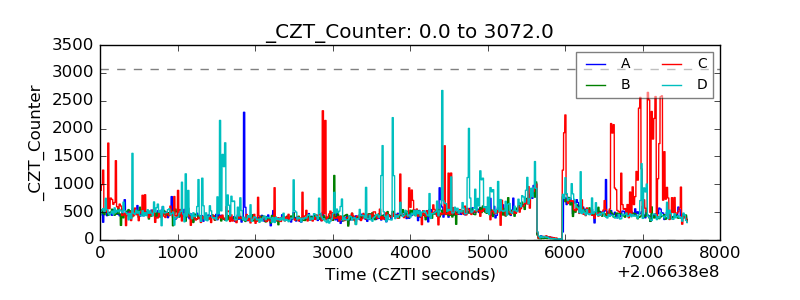 |
| +2.5 Volts monitor |  |
| +5 Volts monitor |  |
| _ROLL_ROT | 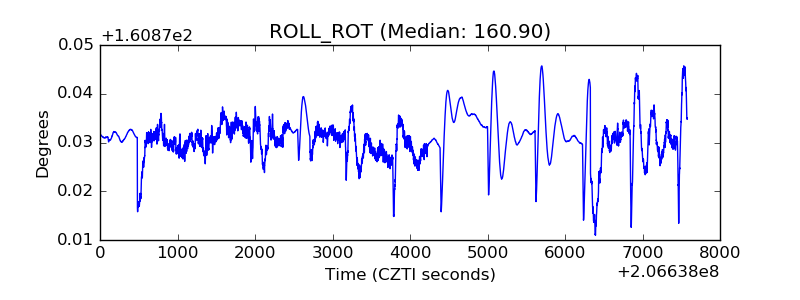 |
| _Roll_DEC | 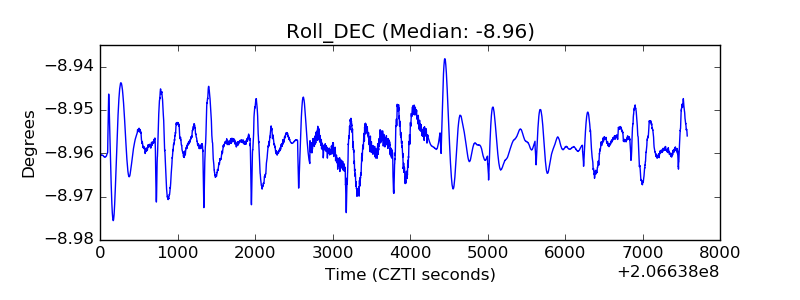 |
| _Roll_RA | 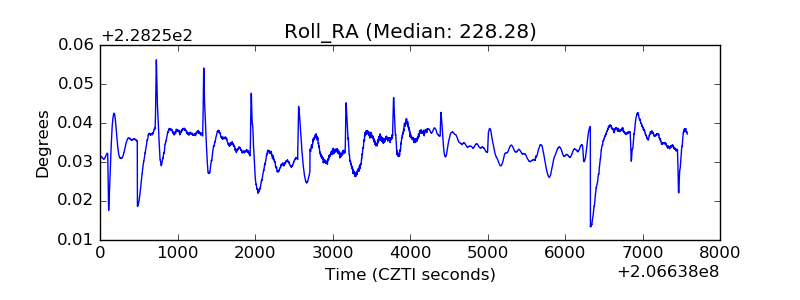 |
| Veto Counter | 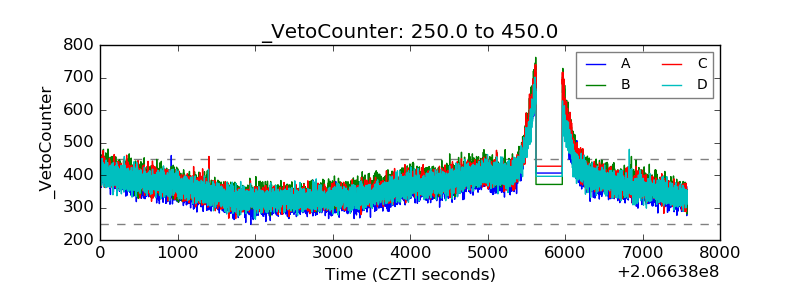 |