| Param | Original file | Final file |
|---|---|---|
| Filename | modeM0/AS1G05_252T01_9000000544_04379cztM0_level2.evt | modeM0/AS1G05_252T01_9000000544_04379cztM0_level2_quad_clean.evt |
| Size (bytes) | 1,222,911,360 | 189,933,120 |
| Size | 1.1 GB | 181.1 MB |
| Events in quadrant A | 8,379,530 | 1,163,118 |
| Events in quadrant B | 8,913,328 | 1,145,834 |
| Events in quadrant C | 8,752,984 | 1,129,145 |
| Events in quadrant D | 9,790,500 | 1,090,829 |
| Mode M0 | |||
|---|---|---|---|
| Quadrant | BADHDUFLAG | Total packets | Discarded packets |
| A | 0 | 36913 | 31 |
| B | 0 | 38386 | 38 |
| C | 0 | 38245 | 39 |
| D | 0 | 41978 | 35 |
| Mode SS | |||
|---|---|---|---|
| Quadrant | BADHDUFLAG | Total packets | Discarded packets |
| A | 0 | 362 | 0 |
| B | 0 | 362 | 0 |
| C | 0 | 362 | 0 |
| D | 0 | 362 | 0 |
| Mode M9 | |||
|---|---|---|---|
| Quadrant | BADHDUFLAG | Total packets | Discarded packets |
| A | 0 | 15 | 0 |
| B | 0 | 15 | 0 |
| C | 0 | 15 | 0 |
| D | 0 | 15 | 0 |
| Quadrant | Total seconds | Saturated seconds | Saturation percentage |
|---|---|---|---|
| A | 17743 | 107 | 0.603055% |
| B | 17744 | 254 | 1.431470% |
| C | 17740 | 134 | 0.755355% |
| D | 17745 | 482 | 2.716258% |
Noise dominated data is calculated using 1-second bins in cleaned event files. If a bin has >2000 counts, and if more than 50% of those come from <1% of pixels, then it is considered to be noise-dominated and hence unusable.
| Quadrant | # 1 sec bins | Bins with >0 counts | Bins with >2000 counts | High rate bins dominated by noise | Noise dominated (total time) | Noise dominated (detector-on time) | Marked lightcurve |
|---|---|---|---|---|---|---|---|
| A | 19066 | 17752 | 10 | 10 | 0.05% | 0.06% | 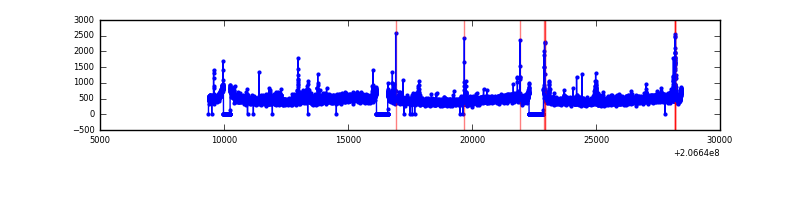 |
| B | 19066 | 17754 | 160 | 160 | 0.84% | 0.90% | 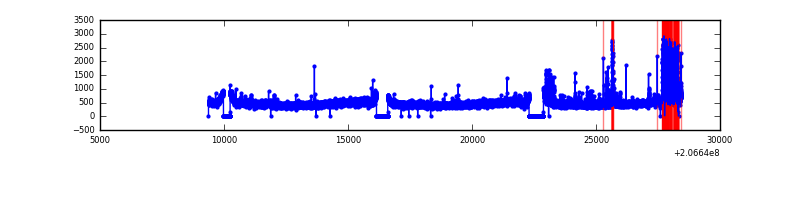 |
| C | 19066 | 17758 | 80 | 80 | 0.42% | 0.45% | 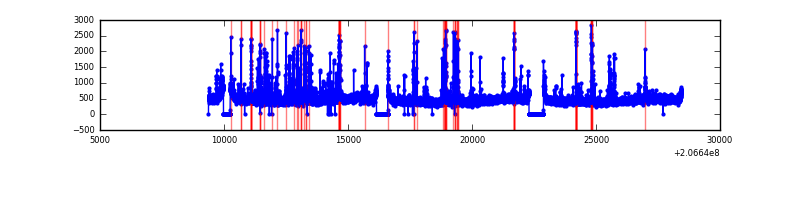 |
| D | 19066 | 17757 | 373 | 373 | 1.96% | 2.10% | 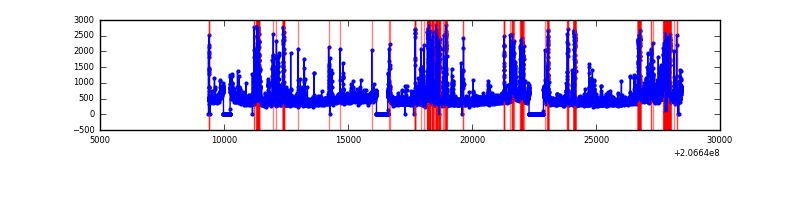 |
Top three noisy pixels from each quadrant. If the there are fewer than three noisy pixels in the level2.evt file, extra rows are filled as -1
| Pixel properties | Quadrant properties | ||||||
|---|---|---|---|---|---|---|---|
| Quadrant | DetID | PixID | Counts | Sigma | Mean | Median | Sigma |
| A | 13 | 251 | 272850 | 642.91 | 2064 | 2017 | 421.3 |
| A | 14 | 111 | 70382 | 162.29 | 2064 | 2017 | 421.3 |
| A | 13 | 14 | 27719 | 61.01 | 2064 | 2017 | 421.3 |
| B | 14 | 167 | 666792 | 1666.07 | 2075 | 2024 | 399.0 |
| B | 15 | 204 | 105894 | 260.32 | 2075 | 2024 | 399.0 |
| B | 8 | 3 | 39949 | 95.05 | 2075 | 2024 | 399.0 |
| C | 14 | 48 | 596469 | 1284.49 | 1985 | 1993 | 462.8 |
| C | 9 | 247 | 231419 | 495.72 | 1985 | 1993 | 462.8 |
| C | 9 | 16 | 62904 | 131.61 | 1985 | 1993 | 462.8 |
| D | 9 | 35 | 984102 | 2073.88 | 1964 | 1907 | 473.6 |
| D | 2 | 136 | 725157 | 1527.13 | 1964 | 1907 | 473.6 |
| D | 2 | 14 | 88885 | 183.65 | 1964 | 1907 | 473.6 |
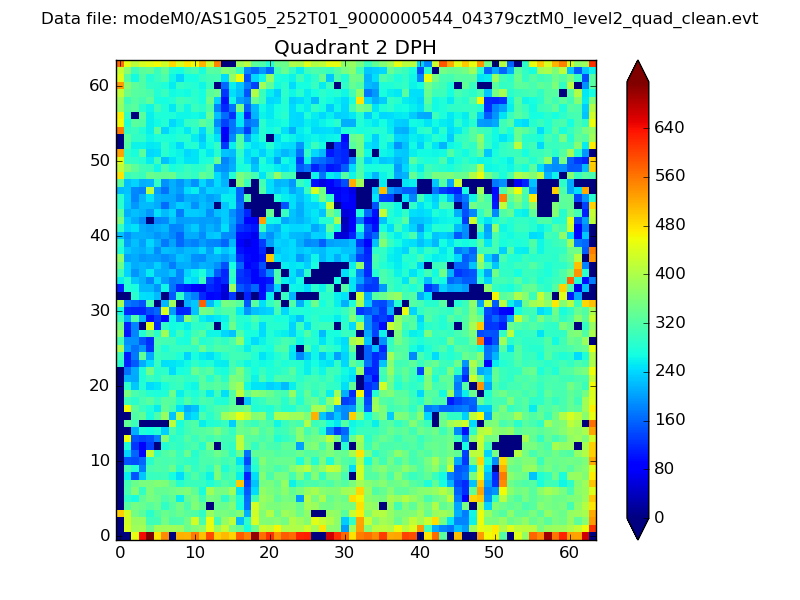
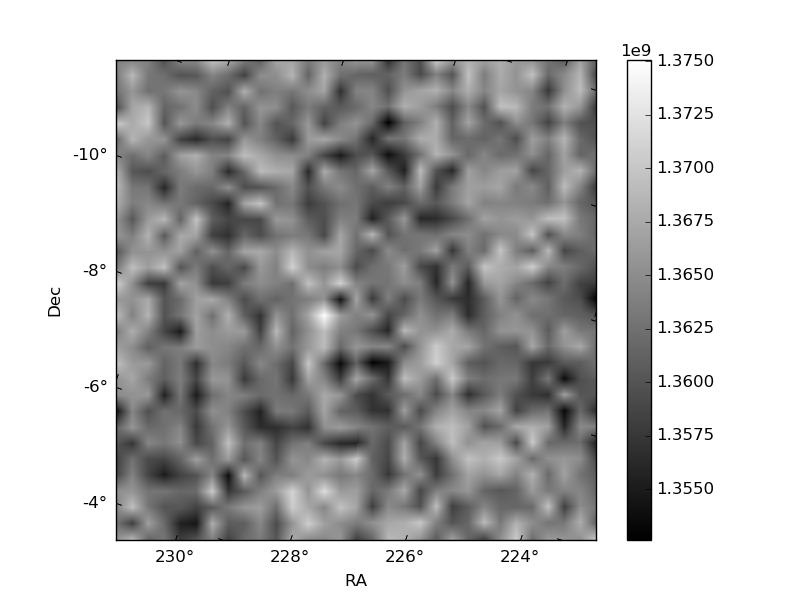
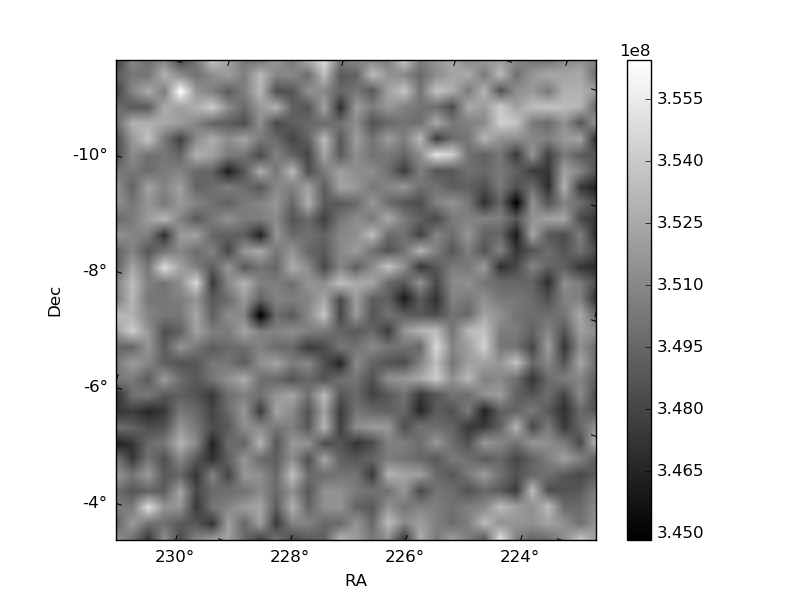
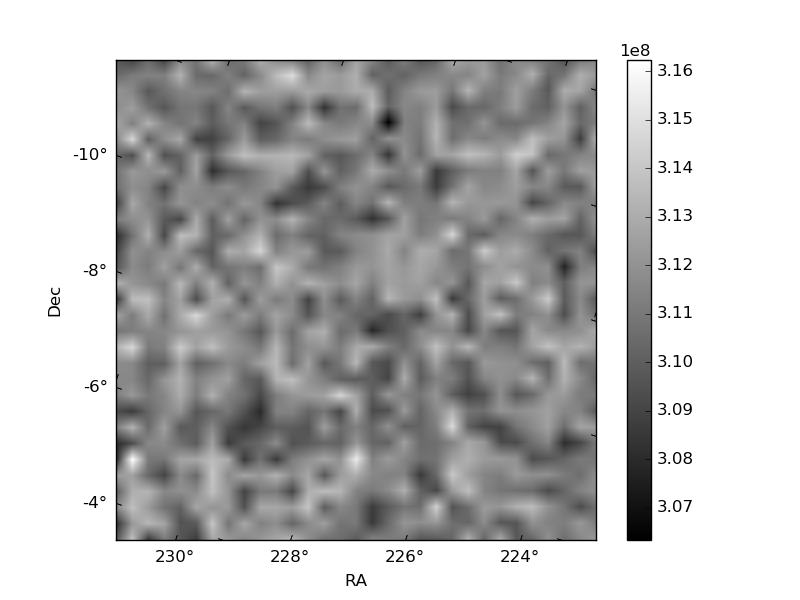
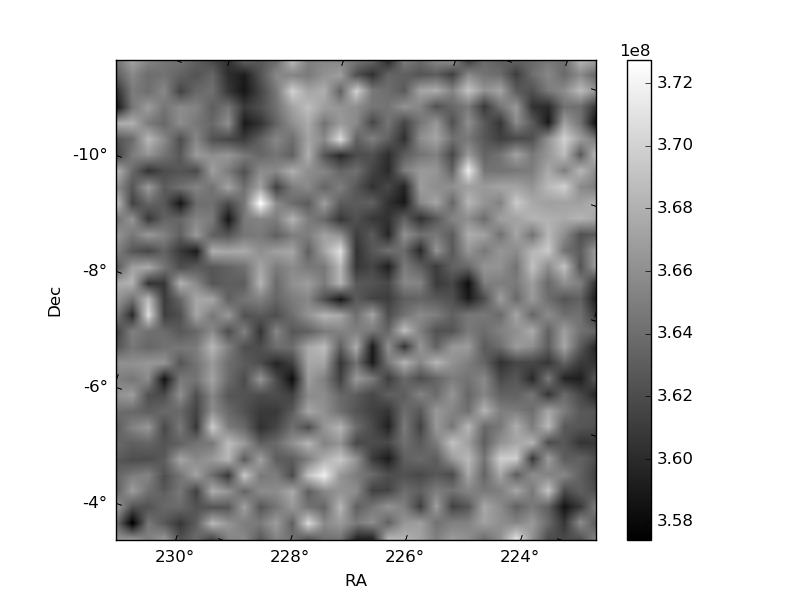
Histogram calculated using DETX and DETY for each event in the final _common_clean file
| Quadrant A | 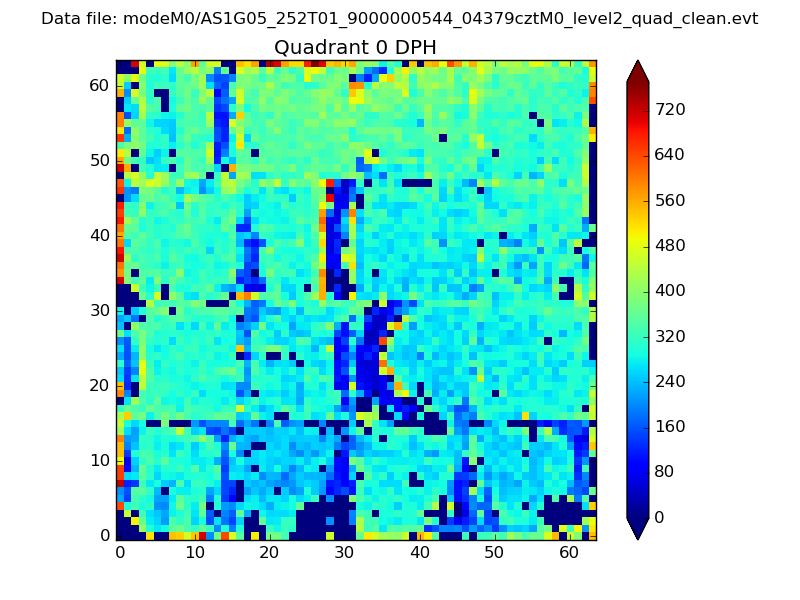 |
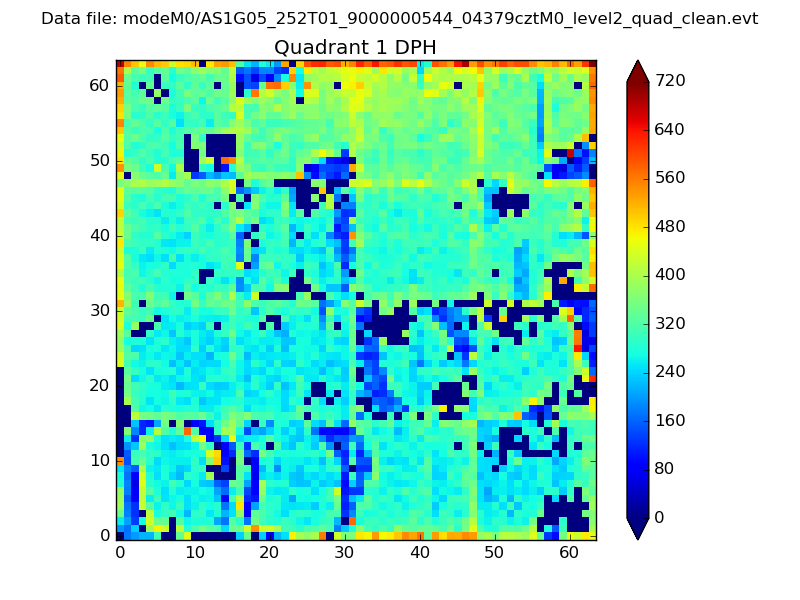 |
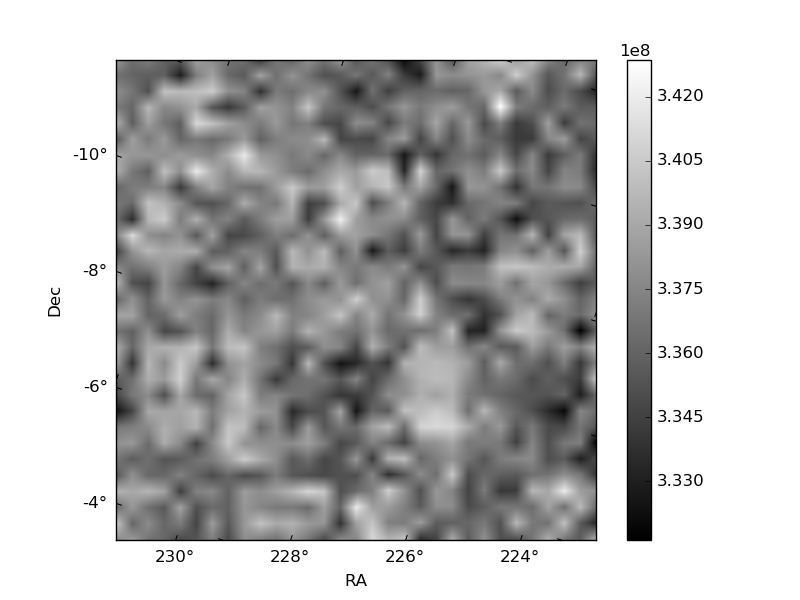
Quadrant B |
|---|---|---|---|
| Quadrant D | 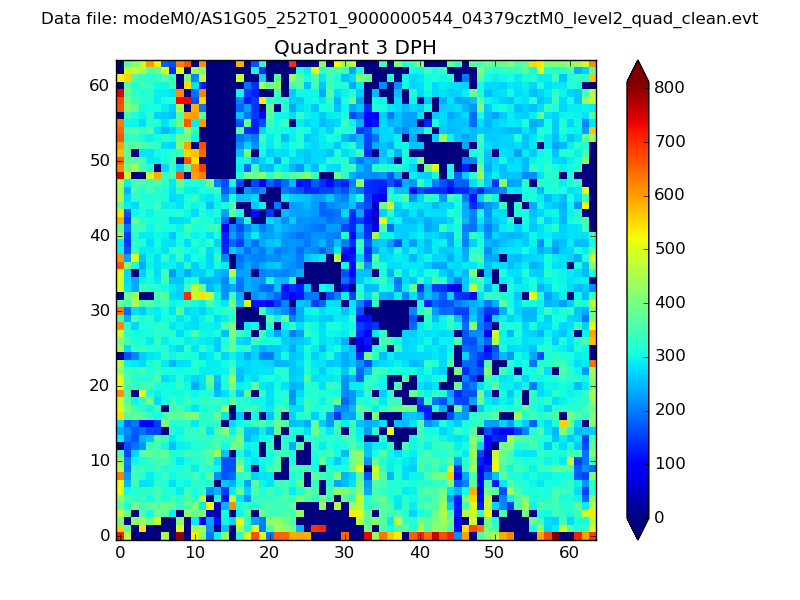 |
 |
Quadrant C |
| Plot type | Count rate plots | Images |
|---|---|---|
| Comparison with Poisson distribution Blue bars denote a histogram of data divided into 1 sec bins. Red curve is a Poisson curve with rate = median count rate of data. |
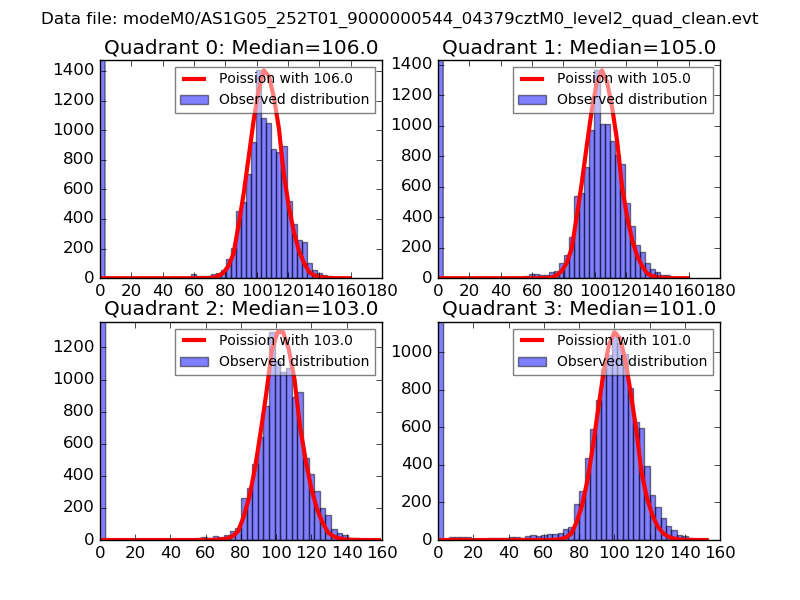 |
 |
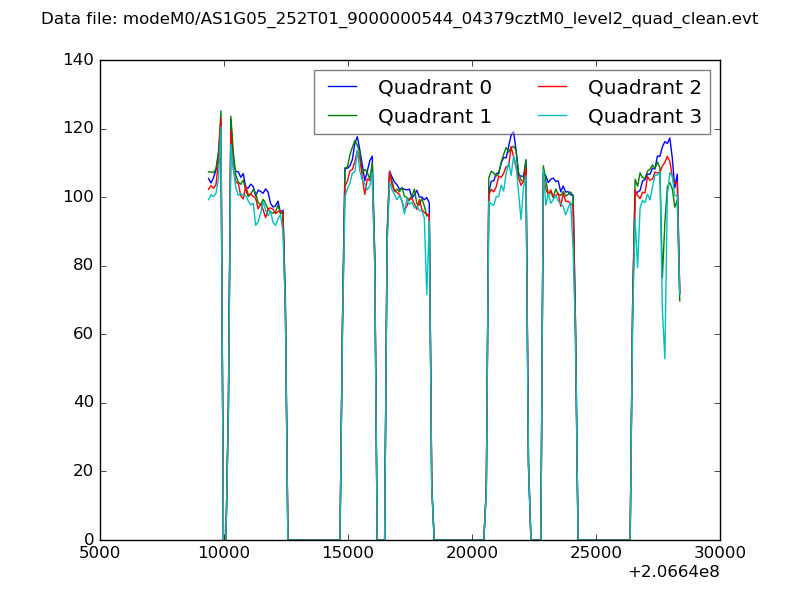
| Quadrant-wise count rates Data is divided into 100 sec bins |
 |
|
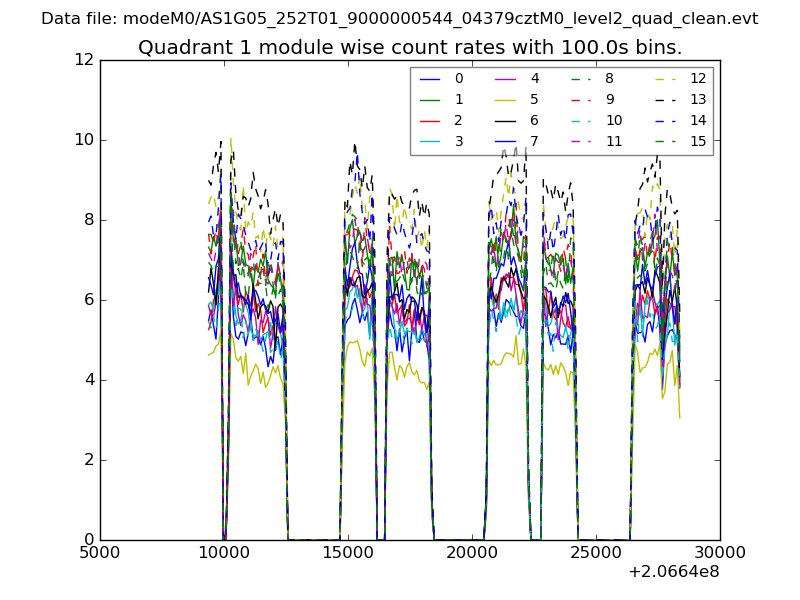
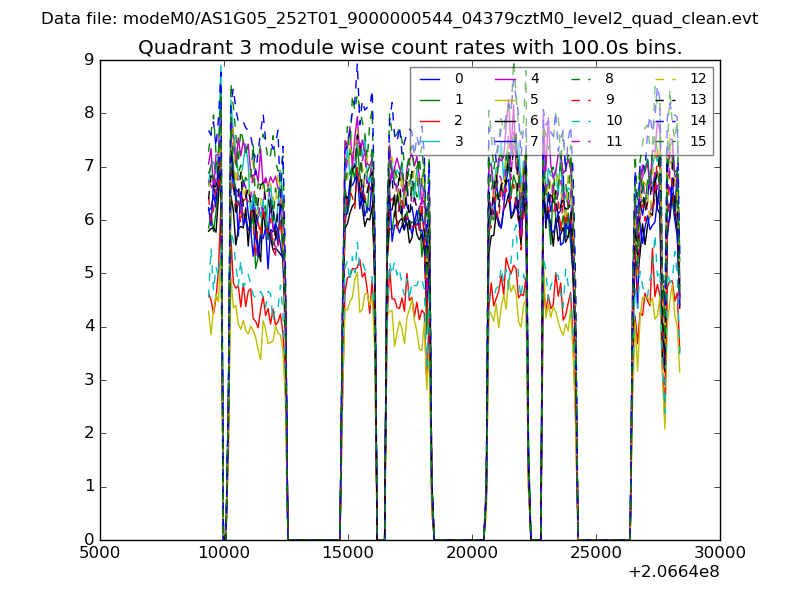
| Module-wise count rates for Quadrant A Data is divided into 100 sec bins |
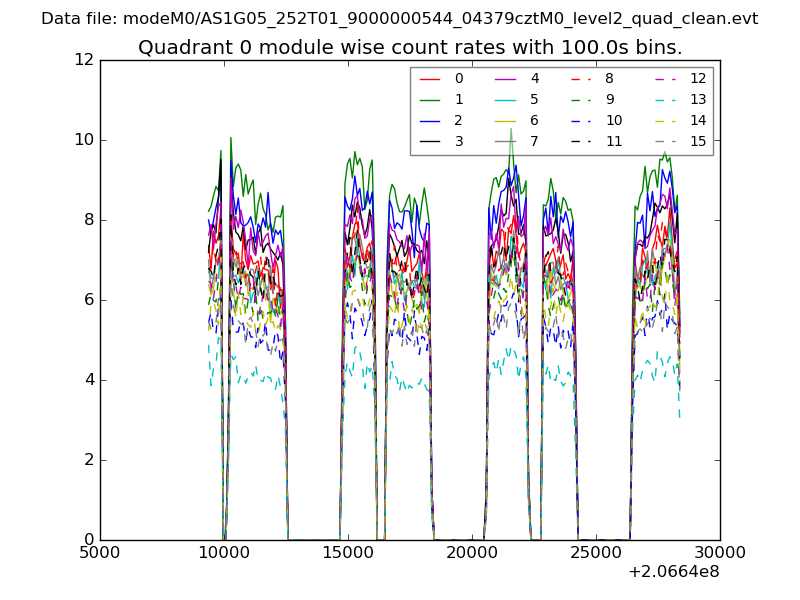 |
 |
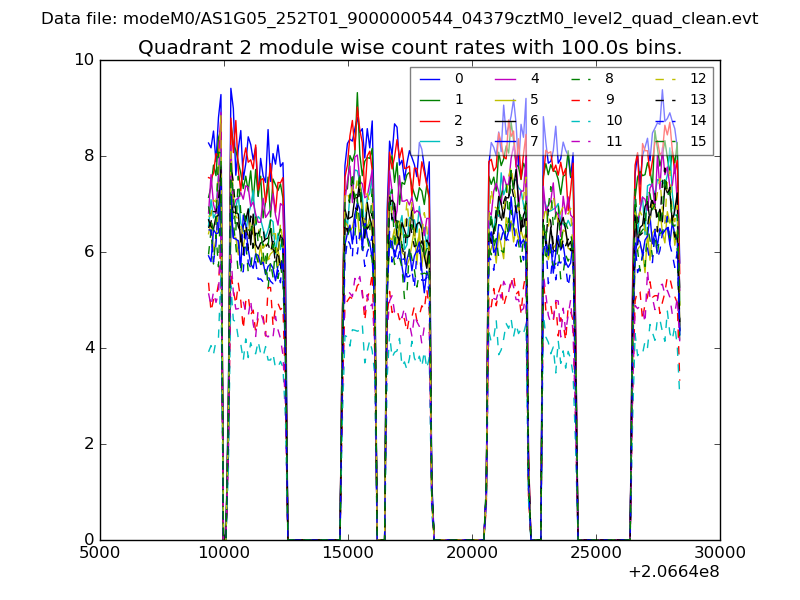
| Module-wise count rates for Quadrant B Data is divided into 100 sec bins |
 |
 |
| Module-wise count rates for Quadrant C Data is divided into 100 sec bins |
 |
 |
| Module-wise count rates for Quadrant D Data is divided into 100 sec bins |
 |
 |
| Parameter | Plot |
|---|---|
| CZT HV Monitor | 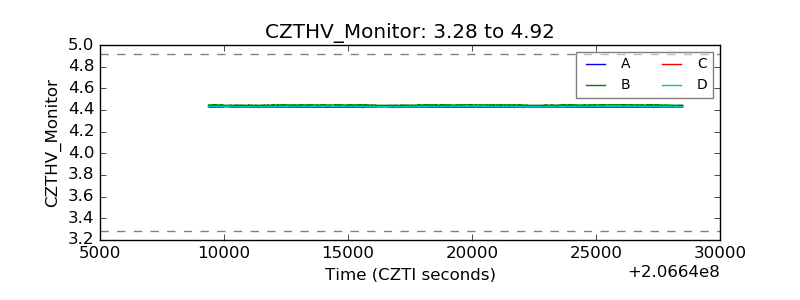 |
| D_VDD | 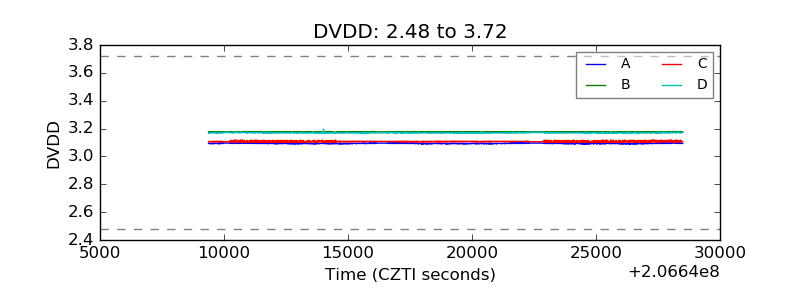 |
| Temperature 1 | 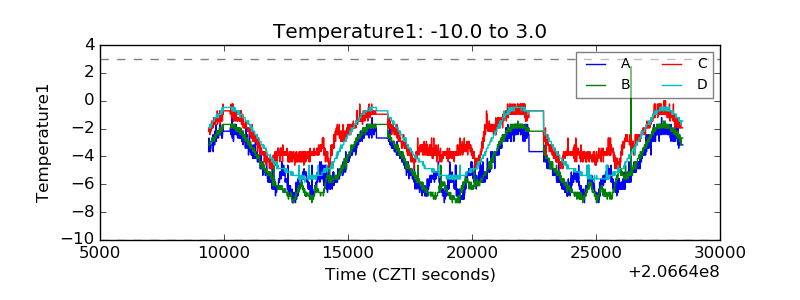 |
| Veto HV Monitor | 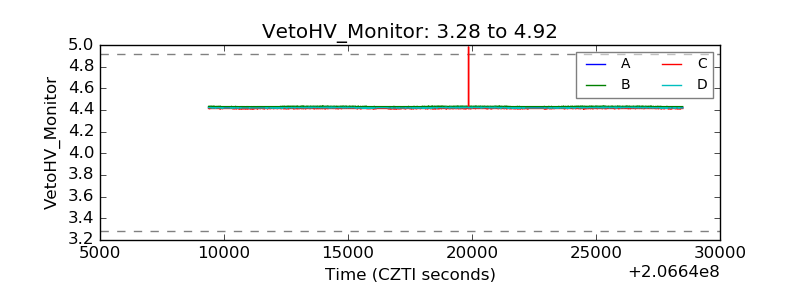 |
| Veto LLD | 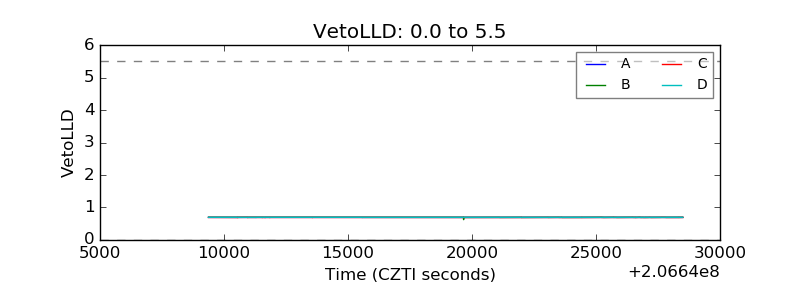 |
| Alpha Counter | 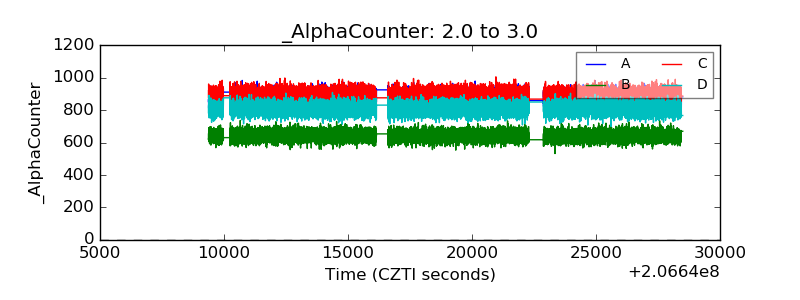 |
| _CPM_Rate | 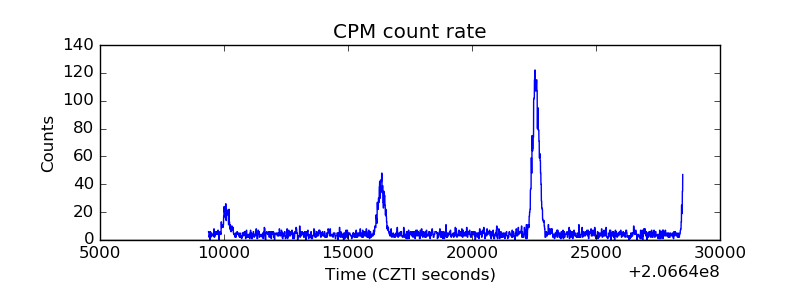 |
| CZT Counter | 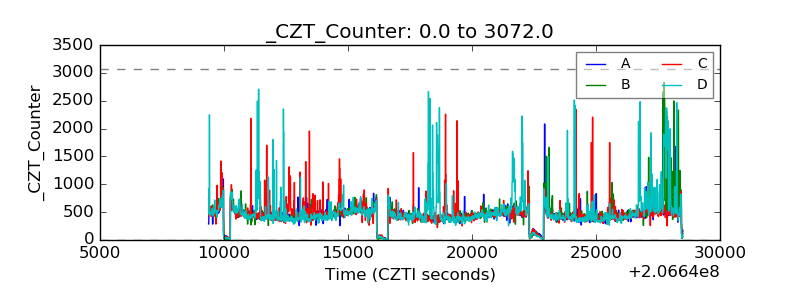 |
| +2.5 Volts monitor |  |
| +5 Volts monitor |  |
| _ROLL_ROT | 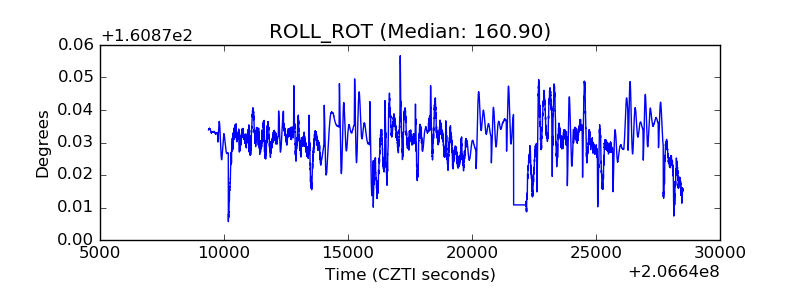 |
| _Roll_DEC | 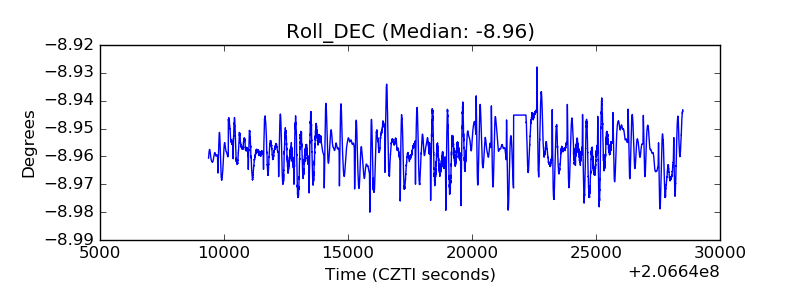 |
| _Roll_RA | 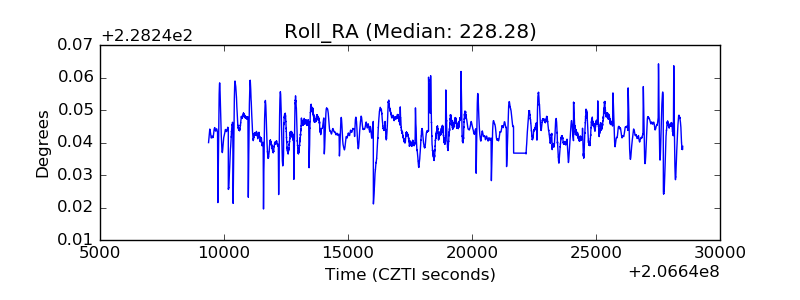 |
| Veto Counter | 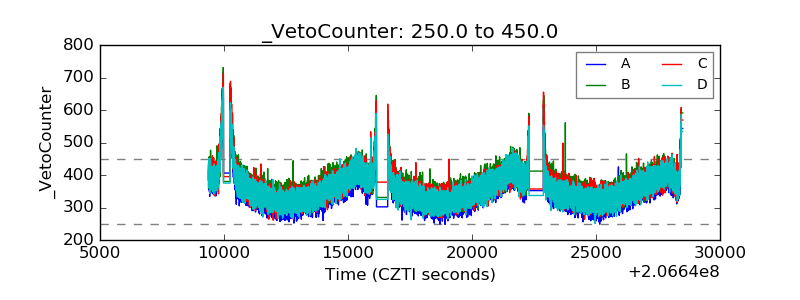 |