| Param | Original file | Final file |
|---|---|---|
| Filename | modeM0/AS1SLEW_01234_9000000541_04360cztM0_level2.evt | modeM0/AS1SLEW_01234_9000000541_04360cztM0_level2_quad_clean.evt |
| Size (bytes) | 81,855,360 | 3,634,560 |
| Size | 78.1 MB | 3.5 MB |
| Events in quadrant A | 688,287 | 5,773 |
| Events in quadrant B | 550,111 | 6,321 |
| Events in quadrant C | 567,306 | 6,067 |
| Events in quadrant D | 594,203 | 5,971 |
| Mode SS | |||
|---|---|---|---|
| Quadrant | BADHDUFLAG | Total packets | Discarded packets |
| A | 0 | 22 | 0 |
| B | 0 | 22 | 0 |
| C | 0 | 22 | 0 |
| D | 0 | 22 | 0 |
| Mode M0 | |||
|---|---|---|---|
| Quadrant | BADHDUFLAG | Total packets | Discarded packets |
| A | 0 | 2778 | 0 |
| B | 0 | 2380 | 0 |
| C | 0 | 2493 | 0 |
| D | 0 | 2523 | 0 |
| Quadrant | Total seconds | Saturated seconds | Saturation percentage |
|---|---|---|---|
| A | 1118 | 36 | 3.220036% |
| B | 1118 | 1 | 0.089445% |
| C | 1118 | 15 | 1.341682% |
| D | 1118 | 16 | 1.431127% |
Noise dominated data is calculated using 1-second bins in cleaned event files. If a bin has >2000 counts, and if more than 50% of those come from <1% of pixels, then it is considered to be noise-dominated and hence unusable.
| Quadrant | # 1 sec bins | Bins with >0 counts | Bins with >2000 counts | High rate bins dominated by noise | Noise dominated (total time) | Noise dominated (detector-on time) | Marked lightcurve |
|---|---|---|---|---|---|---|---|
| A | 1118 | 1118 | 33 | 33 | 2.95% | 2.95% | 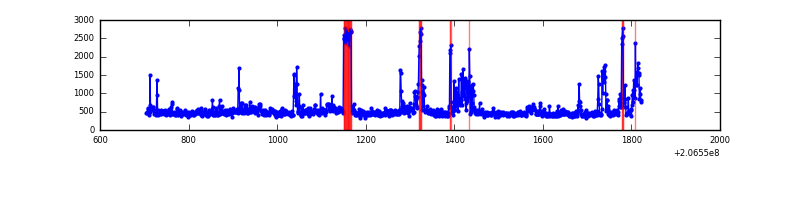 |
| B | 1118 | 1118 | 2 | 2 | 0.18% | 0.18% | 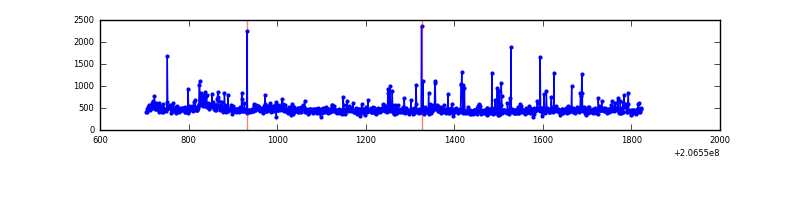 |
| C | 1118 | 1118 | 18 | 18 | 1.61% | 1.61% | 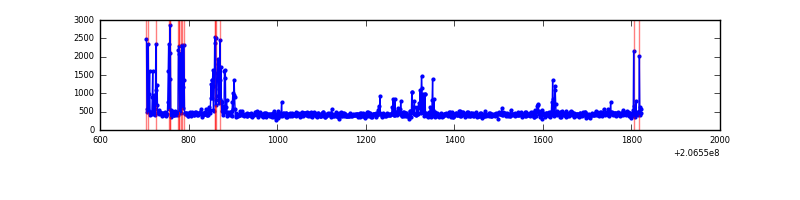 |
| D | 1118 | 1118 | 12 | 12 | 1.07% | 1.07% | 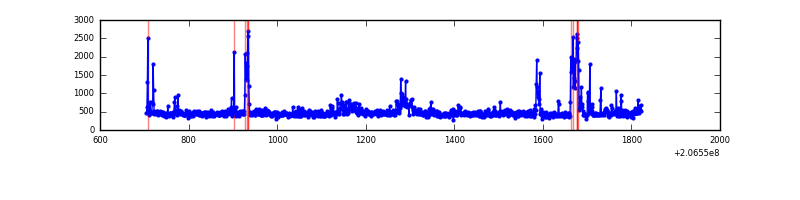 |
Top three noisy pixels from each quadrant. If the there are fewer than three noisy pixels in the level2.evt file, extra rows are filled as -1
| Pixel properties | Quadrant properties | ||||||
|---|---|---|---|---|---|---|---|
| Quadrant | DetID | PixID | Counts | Sigma | Mean | Median | Sigma |
| A | 15 | 234 | 179510 | 6616.67 | 123 | 121 | 27.1 |
| A | 13 | 251 | 17630 | 645.81 | 123 | 121 | 27.1 |
| A | 8 | 15 | 11455 | 418.05 | 123 | 121 | 27.1 |
| B | 14 | 167 | 34284 | 1319.67 | 124 | 121 | 25.9 |
| B | 4 | 48 | 13745 | 526.28 | 124 | 121 | 25.9 |
| B | 15 | 204 | 10368 | 395.83 | 124 | 121 | 25.9 |
| C | 9 | 247 | 94888 | 3166.22 | 120 | 121 | 29.9 |
| C | 12 | 4 | 959 | 28.0 | 120 | 121 | 29.9 |
| C | 13 | 61 | 955 | 27.86 | 120 | 121 | 29.9 |
| D | 2 | 63 | 72509 | 2350.22 | 121 | 118 | 30.8 |
| D | 2 | 136 | 30867 | 998.29 | 121 | 118 | 30.8 |
| D | 13 | 53 | 22510 | 726.97 | 121 | 118 | 30.8 |
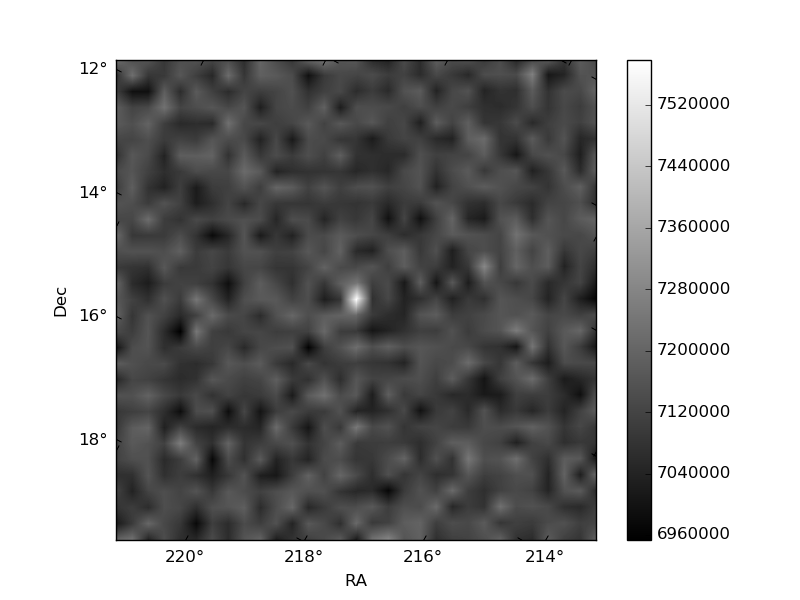
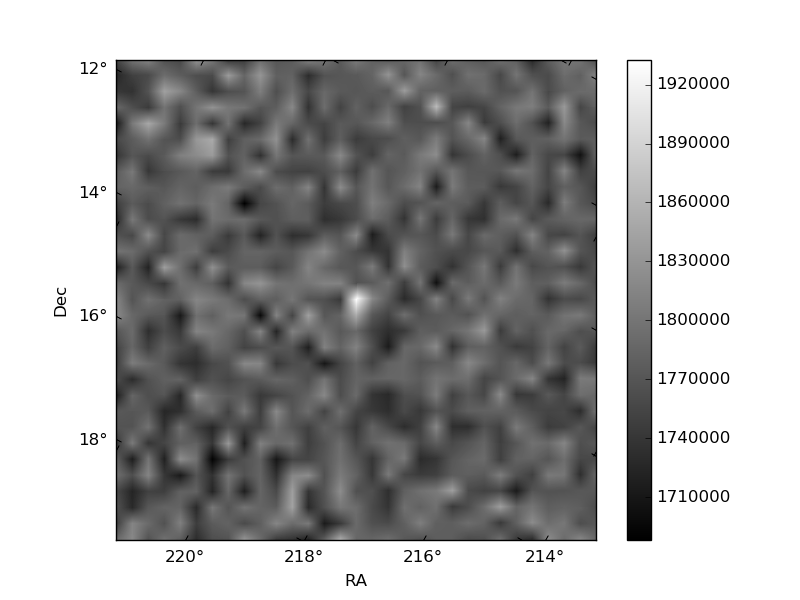
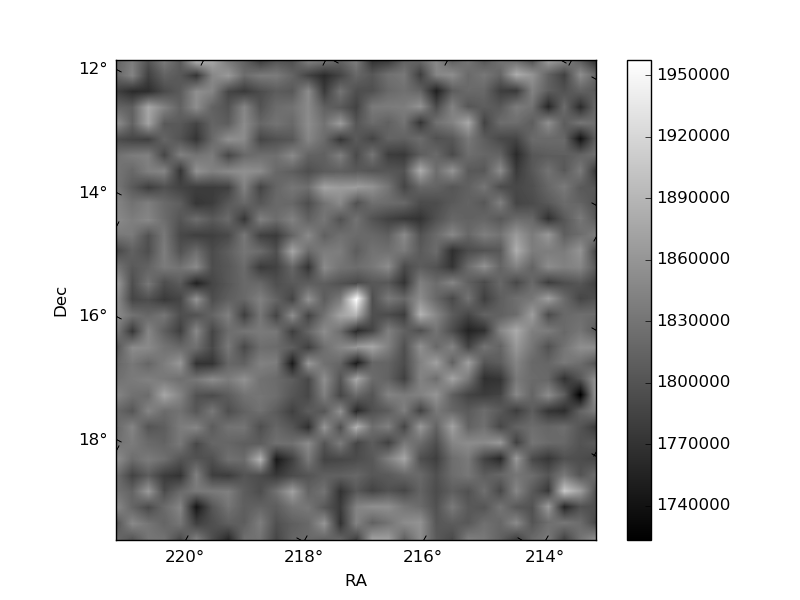
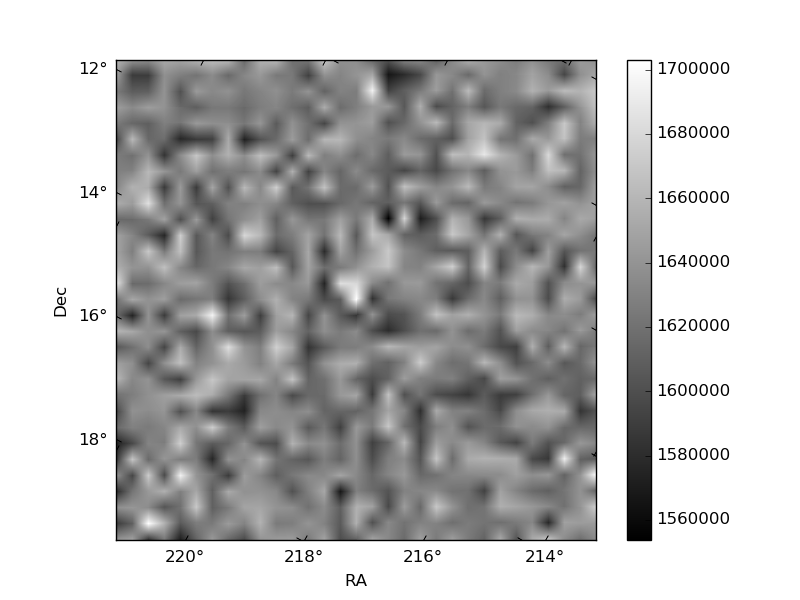
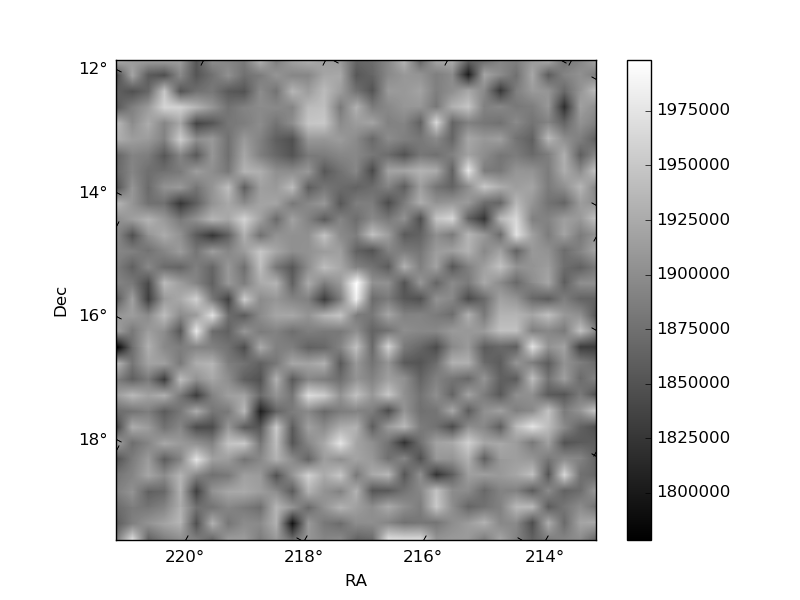
Histogram calculated using DETX and DETY for each event in the final _common_clean file
| Quadrant A | 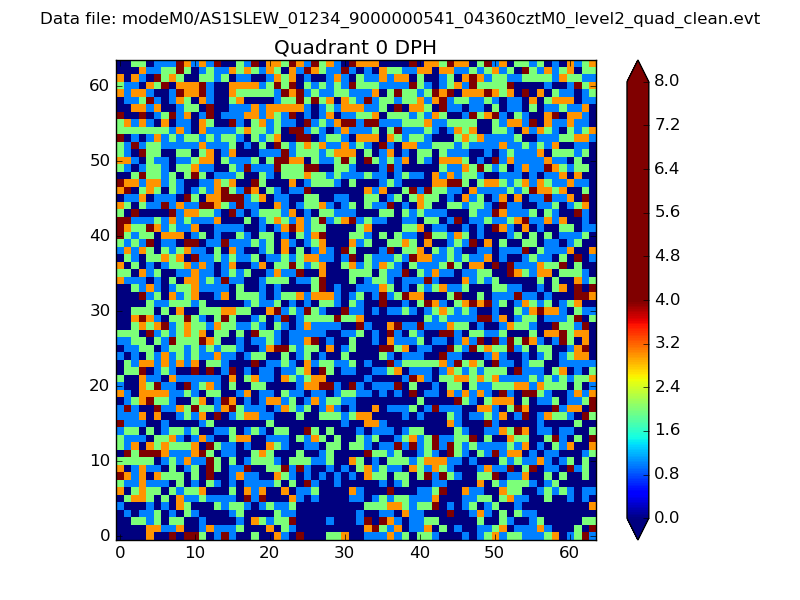 |
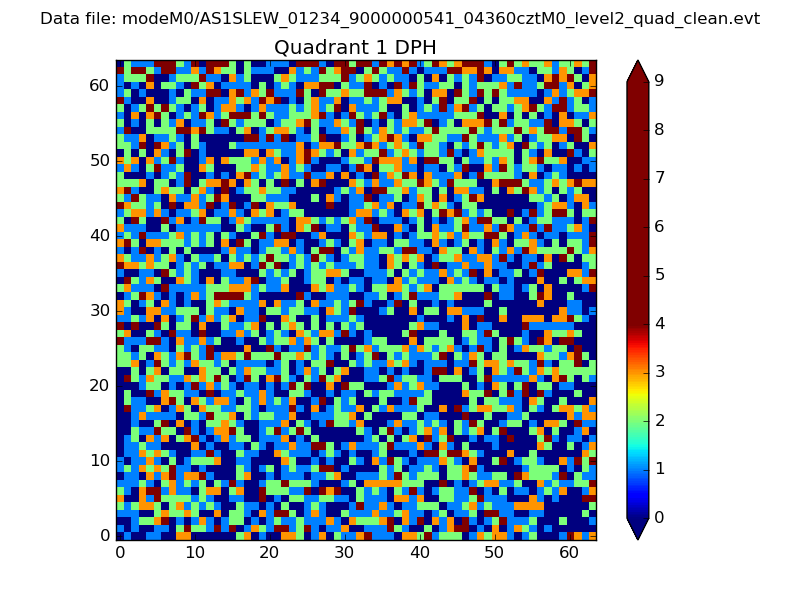 |
Quadrant B |
|---|---|---|---|
| Quadrant D | 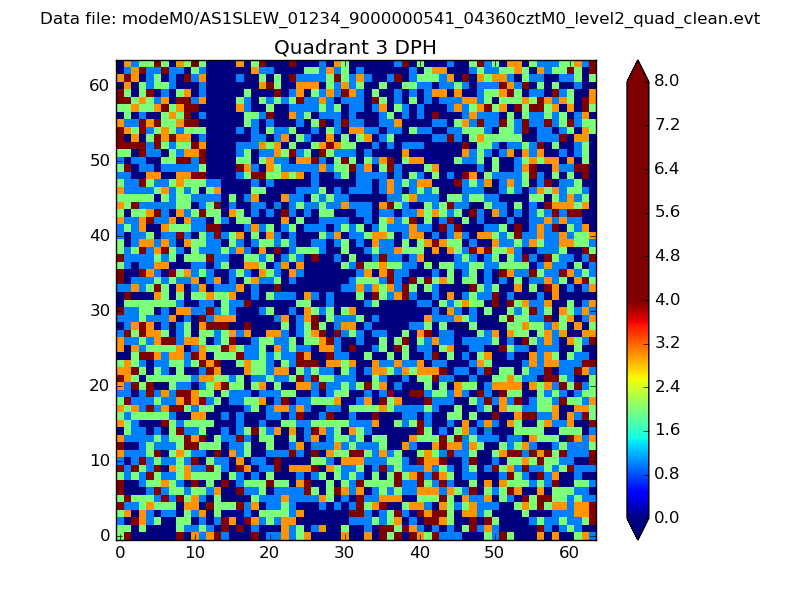 |
 |
Quadrant C |
| Plot type | Count rate plots | Images |
|---|---|---|
| Comparison with Poisson distribution Blue bars denote a histogram of data divided into 1 sec bins. Red curve is a Poisson curve with rate = median count rate of data. |
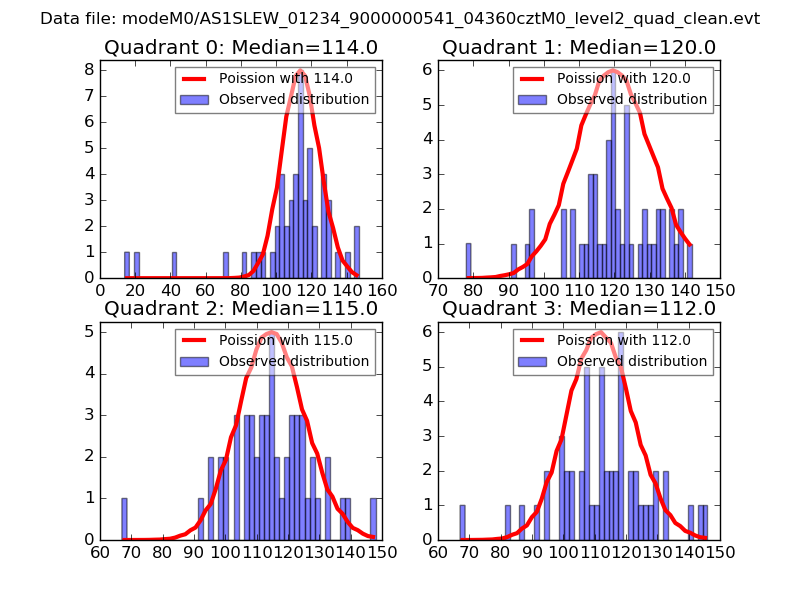 |
 |
| Quadrant-wise count rates Data is divided into 100 sec bins |
 |
|
| Module-wise count rates for Quadrant A Data is divided into 100 sec bins |
 |
 |
| Module-wise count rates for Quadrant B Data is divided into 100 sec bins |
 |
 |
| Module-wise count rates for Quadrant C Data is divided into 100 sec bins |
 |
 |
| Module-wise count rates for Quadrant D Data is divided into 100 sec bins |
 |
 |
| Parameter | Plot |
|---|---|
| CZT HV Monitor |  |
| D_VDD | 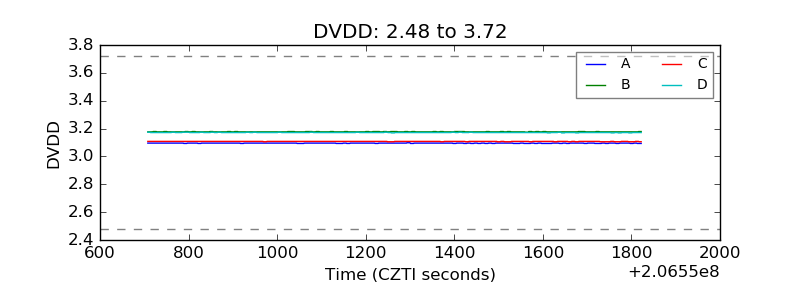 |
| Temperature 1 | 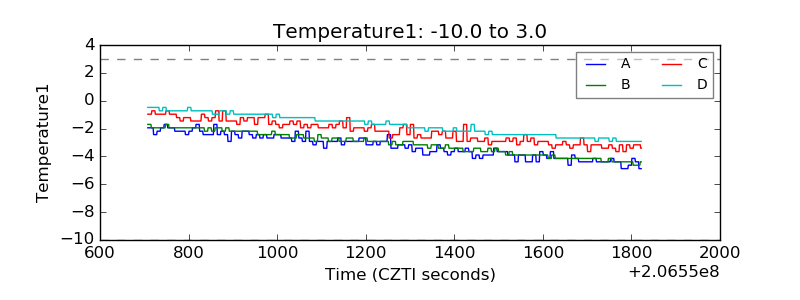 |
| Veto HV Monitor | 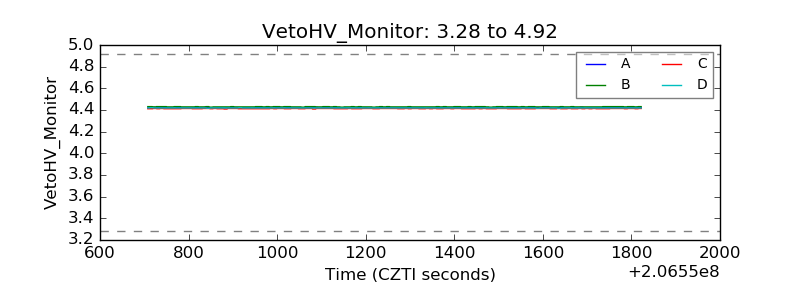 |
| Veto LLD | 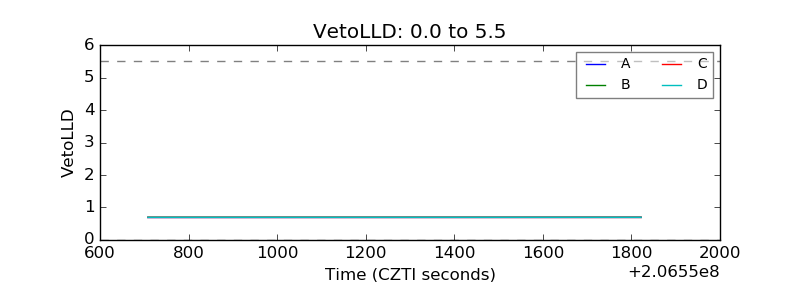 |
| Alpha Counter | 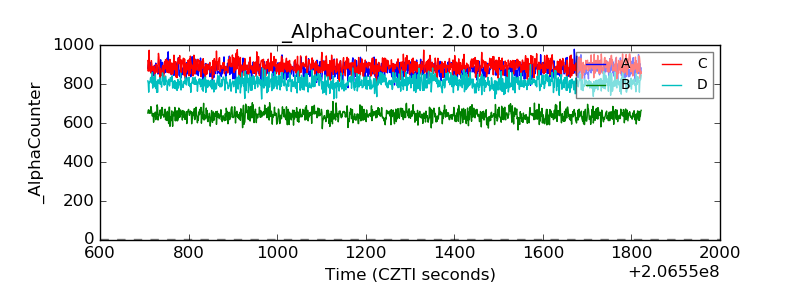 |
| _CPM_Rate | 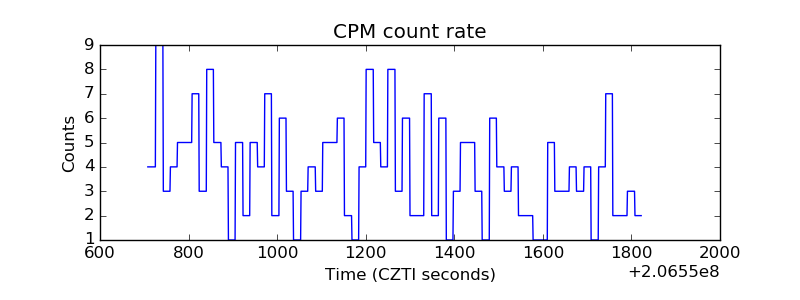 |
| CZT Counter |  |
| +2.5 Volts monitor |  |
| +5 Volts monitor | 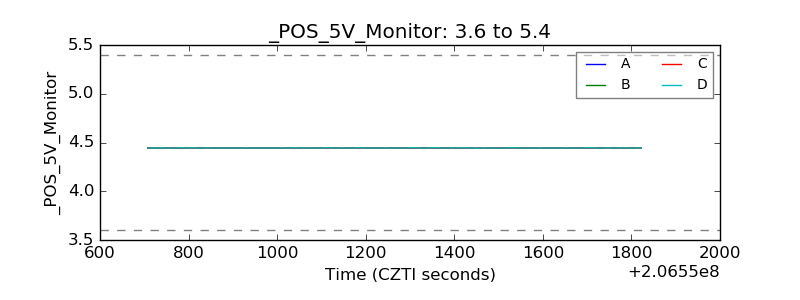 |
| _ROLL_ROT | 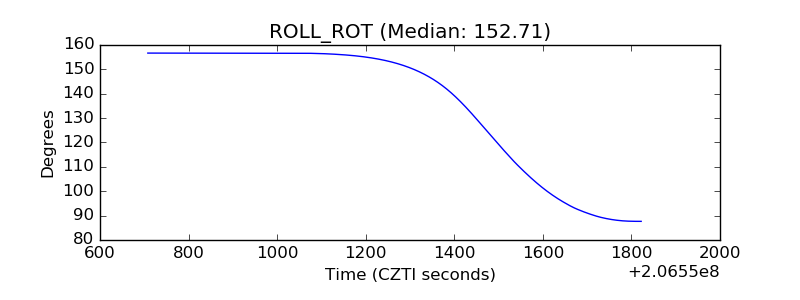 |
| _Roll_DEC | 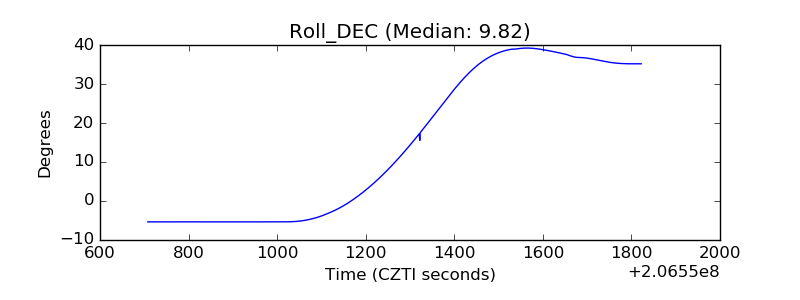 |
| _Roll_RA |  |
| Veto Counter | 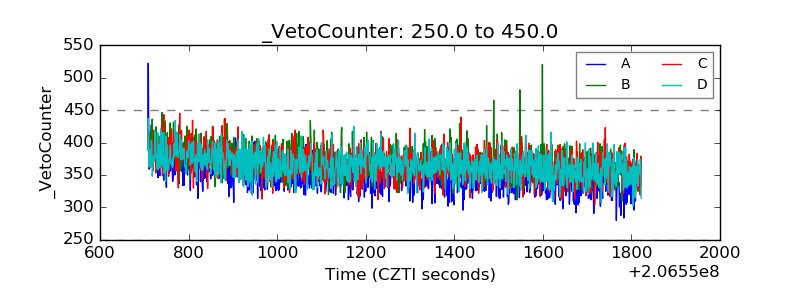 |