| Param | Original file | Final file |
|---|---|---|
| Filename | modeM0/AS1SLEW_01234_9000000543_04365cztM0_level2.evt | modeM0/AS1SLEW_01234_9000000543_04365cztM0_level2_quad_clean.evt |
| Size (bytes) | 56,701,440 | 2,767,680 |
| Size | 54.1 MB | 2.6 MB |
| Events in quadrant A | 435,832 | 4,959 |
| Events in quadrant B | 377,650 | 4,932 |
| Events in quadrant C | 456,103 | 4,770 |
| Events in quadrant D | 389,745 | 4,923 |
| Mode SS | |||
|---|---|---|---|
| Quadrant | BADHDUFLAG | Total packets | Discarded packets |
| A | 0 | 16 | 0 |
| B | 0 | 16 | 0 |
| C | 0 | 16 | 0 |
| D | 0 | 16 | 0 |
| Mode M0 | |||
|---|---|---|---|
| Quadrant | BADHDUFLAG | Total packets | Discarded packets |
| A | 0 | 1816 | 1 |
| B | 0 | 1672 | 1 |
| C | 0 | 1891 | 1 |
| D | 0 | 1720 | 1 |
| Mode M9 | |||
|---|---|---|---|
| Quadrant | BADHDUFLAG | Total packets | Discarded packets |
| A | 0 | 2 | 0 |
| B | 0 | 2 | 0 |
| C | 0 | 2 | 0 |
| D | 0 | 2 | 0 |
| Quadrant | Total seconds | Saturated seconds | Saturation percentage |
|---|---|---|---|
| A | 802 | 15 | 1.870324% |
| B | 802 | 4 | 0.498753% |
| C | 802 | 15 | 1.870324% |
| D | 802 | 6 | 0.748130% |
Noise dominated data is calculated using 1-second bins in cleaned event files. If a bin has >2000 counts, and if more than 50% of those come from <1% of pixels, then it is considered to be noise-dominated and hence unusable.
| Quadrant | # 1 sec bins | Bins with >0 counts | Bins with >2000 counts | High rate bins dominated by noise | Noise dominated (total time) | Noise dominated (detector-on time) | Marked lightcurve |
|---|---|---|---|---|---|---|---|
| A | 817 | 803 | 7 | 7 | 0.86% | 0.87% | 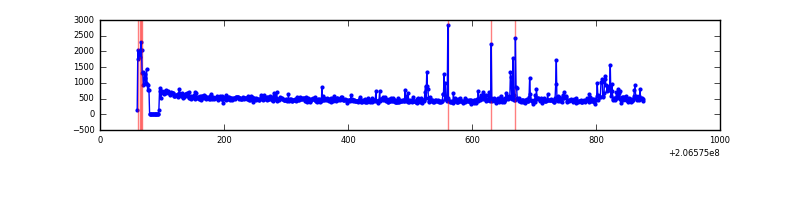 |
| B | 817 | 803 | 0 | 0 | 0.00% | 0.00% | 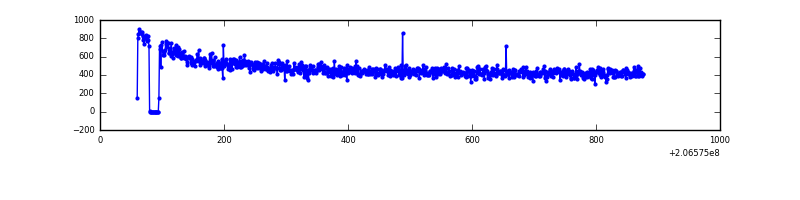 |
| C | 817 | 802 | 3 | 3 | 0.37% | 0.37% | 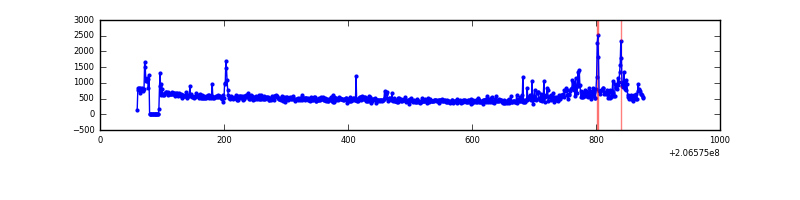 |
| D | 817 | 803 | 2 | 2 | 0.24% | 0.25% | 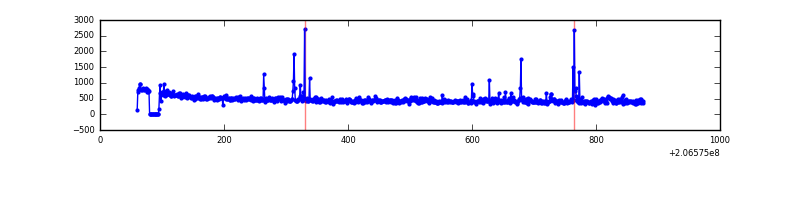 |
Top three noisy pixels from each quadrant. If the there are fewer than three noisy pixels in the level2.evt file, extra rows are filled as -1
| Pixel properties | Quadrant properties | ||||||
|---|---|---|---|---|---|---|---|
| Quadrant | DetID | PixID | Counts | Sigma | Mean | Median | Sigma |
| A | 13 | 251 | 47352 | 2199.37 | 95 | 93 | 21.5 |
| A | 14 | 223 | 10868 | 501.45 | 95 | 93 | 21.5 |
| A | 15 | 234 | 6705 | 307.71 | 95 | 93 | 21.5 |
| B | 0 | 183 | 2150 | 95.81 | 97 | 94 | 21.5 |
| B | 12 | 111 | 1647 | 72.37 | 97 | 94 | 21.5 |
| B | 8 | 3 | 1338 | 57.97 | 97 | 94 | 21.5 |
| C | 9 | 247 | 81448 | 3390.88 | 94 | 95 | 24.0 |
| C | 12 | 4 | 1718 | 67.65 | 94 | 95 | 24.0 |
| C | 8 | 128 | 1064 | 40.39 | 94 | 95 | 24.0 |
| D | 13 | 239 | 16736 | 669.36 | 94 | 91 | 24.9 |
| D | 7 | 223 | 5822 | 230.46 | 94 | 91 | 24.9 |
| D | 2 | 63 | 5497 | 217.4 | 94 | 91 | 24.9 |
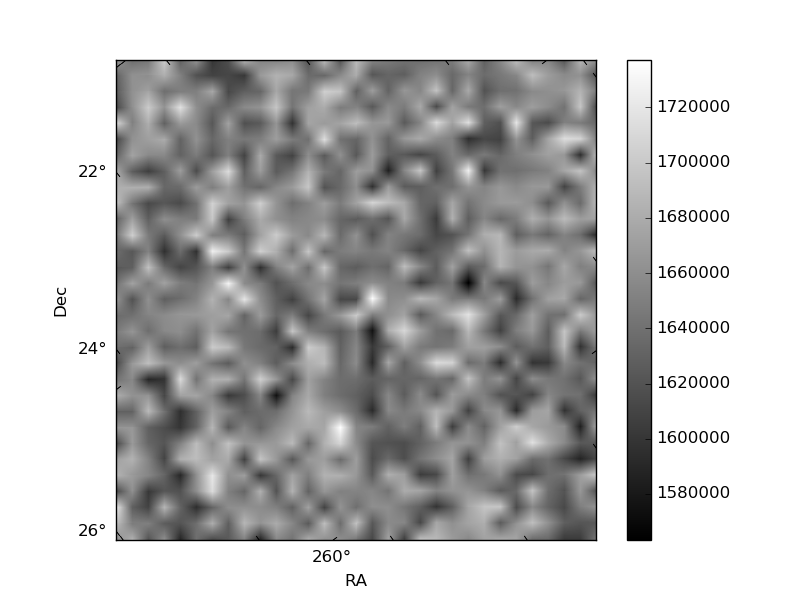
Histogram calculated using DETX and DETY for each event in the final _common_clean file
| Quadrant A | 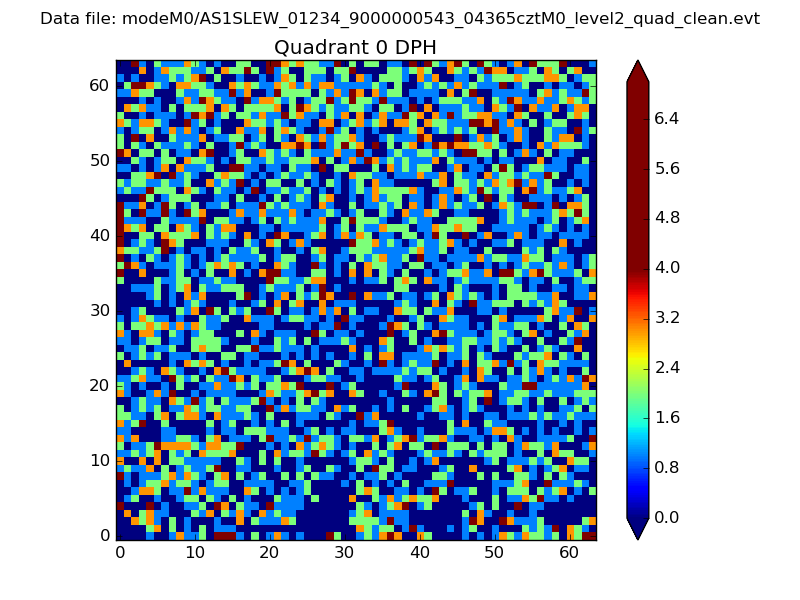 |
 |
Quadrant B |
|---|---|---|---|
| Quadrant D |  |
 |
Quadrant C |
| Plot type | Count rate plots | Images |
|---|---|---|
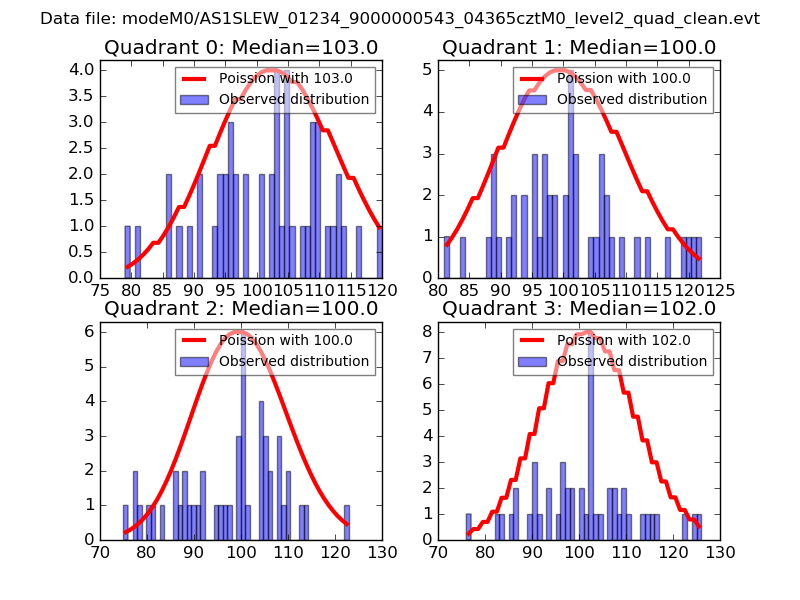
| Comparison with Poisson distribution Blue bars denote a histogram of data divided into 1 sec bins. Red curve is a Poisson curve with rate = median count rate of data. |
 |
 |
| Quadrant-wise count rates Data is divided into 100 sec bins |
 |
|
| Module-wise count rates for Quadrant A Data is divided into 100 sec bins |
 |
 |
| Module-wise count rates for Quadrant B Data is divided into 100 sec bins |
 |
 |
| Module-wise count rates for Quadrant C Data is divided into 100 sec bins |
 |
 |
| Module-wise count rates for Quadrant D Data is divided into 100 sec bins |
 |
 |
| Parameter | Plot |
|---|---|
| CZT HV Monitor | 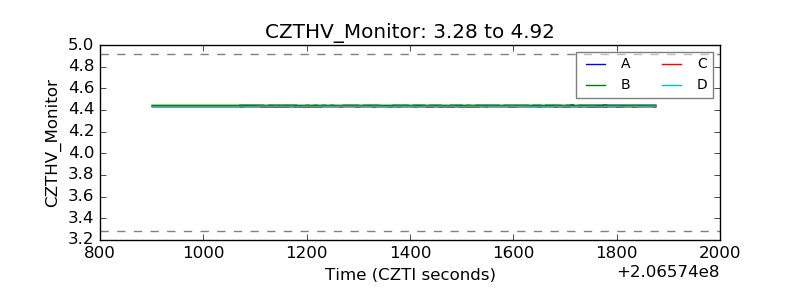 |
| D_VDD | 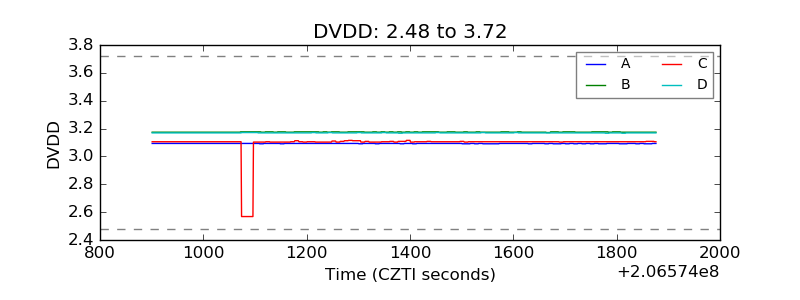 |
| Temperature 1 | 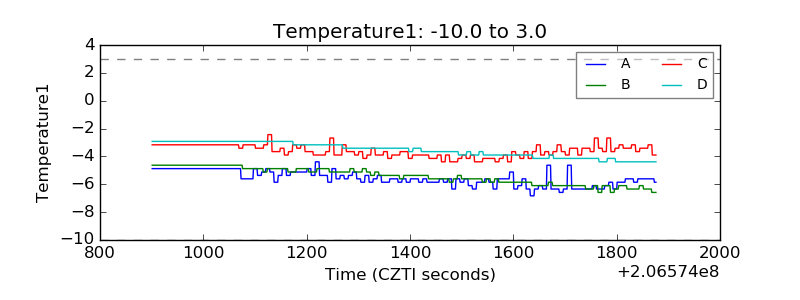 |
| Veto HV Monitor | 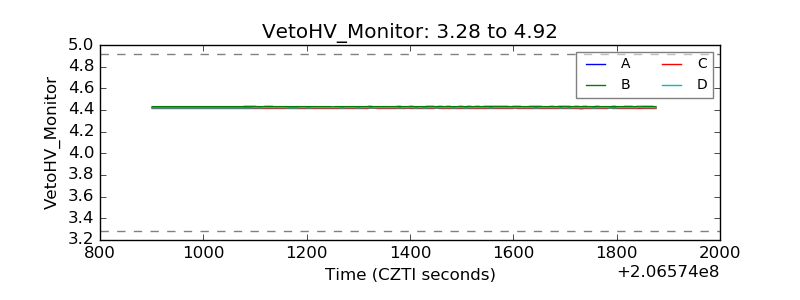 |
| Veto LLD | 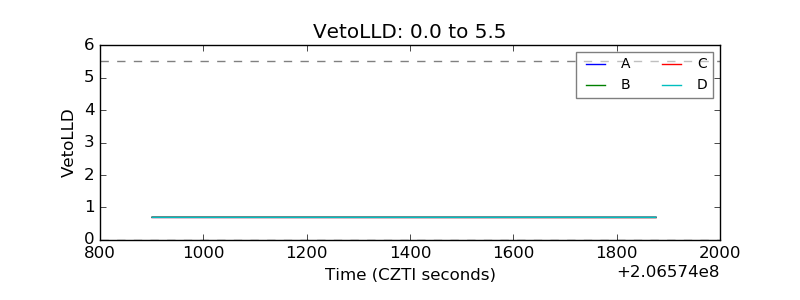 |
| Alpha Counter | 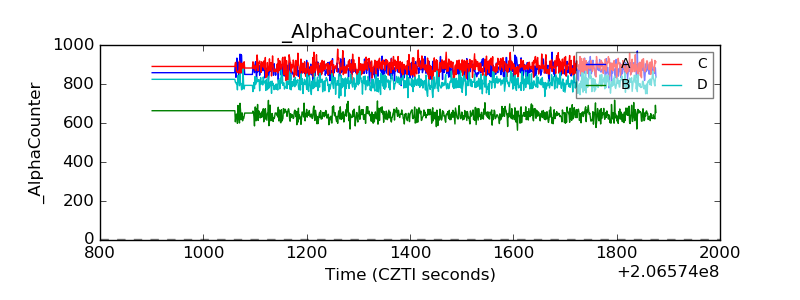 |
| _CPM_Rate | 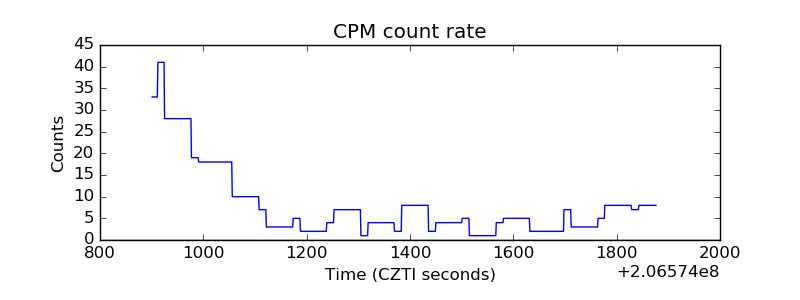 |
| CZT Counter | 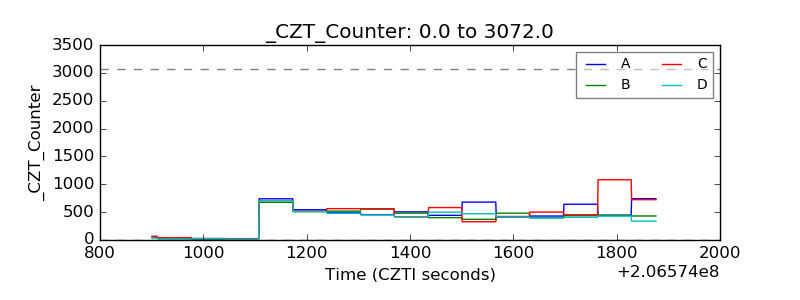 |
| +2.5 Volts monitor |  |
| +5 Volts monitor |  |
| _ROLL_ROT | 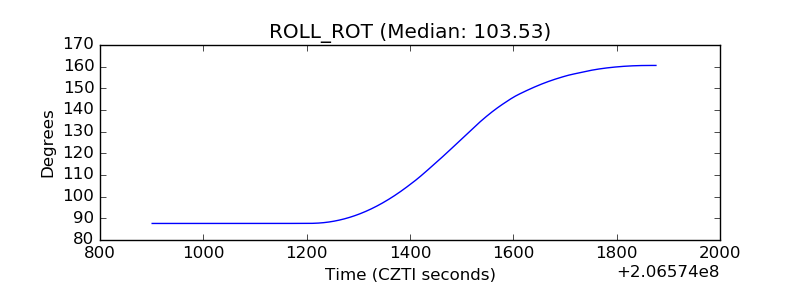 |
| _Roll_DEC | 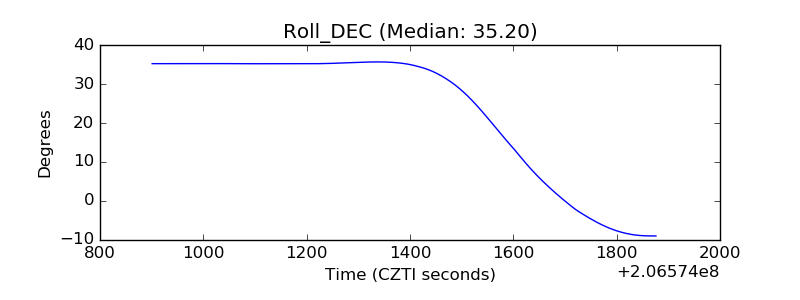 |
| _Roll_RA | 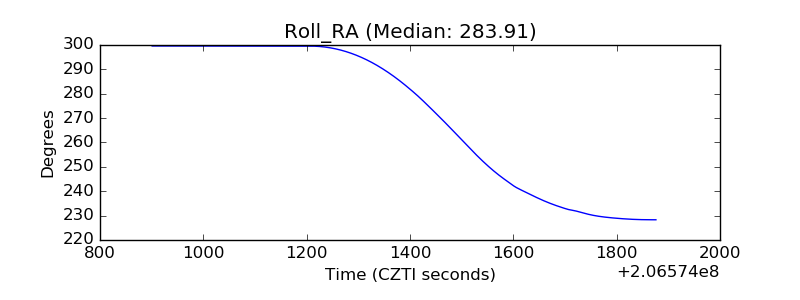 |
| Veto Counter | 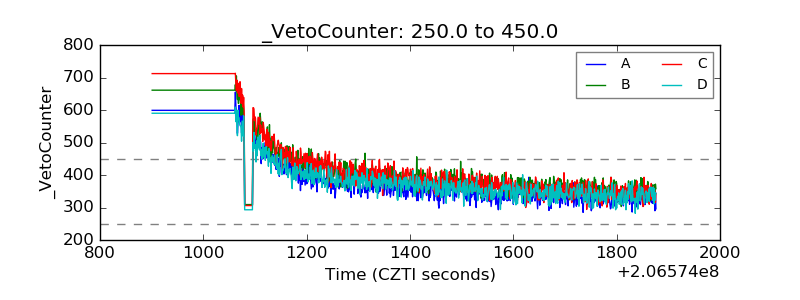 |