| Param | Original file | Final file |
|---|---|---|
| Filename | modeM0/AS1SLEW_01234_9000000545_04379cztM0_level2.evt | modeM0/AS1SLEW_01234_9000000545_04379cztM0_level2_quad_clean.evt |
| Size (bytes) | 17,550,720 | 1,258,560 |
| Size | 16.7 MB | 1.2 MB |
| Events in quadrant A | 167,843 | 4,134 |
| Events in quadrant B | 115,611 | 4,398 |
| Events in quadrant C | 93,233 | 4,317 |
| Events in quadrant D | 139,372 | 4,101 |
| Mode M0 | |||
|---|---|---|---|
| Quadrant | BADHDUFLAG | Total packets | Discarded packets |
| A | 0 | 613 | 1 |
| B | 0 | 455 | 1 |
| C | 0 | 380 | 1 |
| D | 0 | 536 | 1 |
| Mode SS | |||
|---|---|---|---|
| Quadrant | BADHDUFLAG | Total packets | Discarded packets |
| A | 0 | 2 | 0 |
| B | 0 | 2 | 0 |
| C | 0 | 2 | 0 |
| D | 0 | 2 | 0 |
| Mode M9 | |||
|---|---|---|---|
| Quadrant | BADHDUFLAG | Total packets | Discarded packets |
| A | 0 | 7 | 0 |
| B | 0 | 7 | 0 |
| C | 0 | 7 | 0 |
| D | 0 | 7 | 0 |
| Quadrant | Total seconds | Saturated seconds | Saturation percentage |
|---|---|---|---|
| A | 178 | 33 | 18.539326% |
| B | 178 | 4 | 2.247191% |
| C | 178 | 3 | 1.685393% |
| D | 178 | 9 | 5.056180% |
Noise dominated data is calculated using 1-second bins in cleaned event files. If a bin has >2000 counts, and if more than 50% of those come from <1% of pixels, then it is considered to be noise-dominated and hence unusable.
| Quadrant | # 1 sec bins | Bins with >0 counts | Bins with >2000 counts | High rate bins dominated by noise | Noise dominated (total time) | Noise dominated (detector-on time) | Marked lightcurve |
|---|---|---|---|---|---|---|---|
| A | 178 | 178 | 24 | 24 | 13.48% | 13.48% | 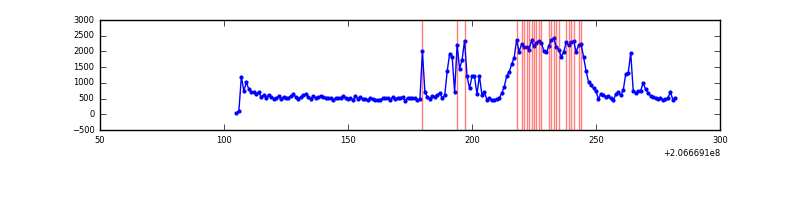 |
| B | 178 | 178 | 0 | 0 | 0.00% | 0.00% | 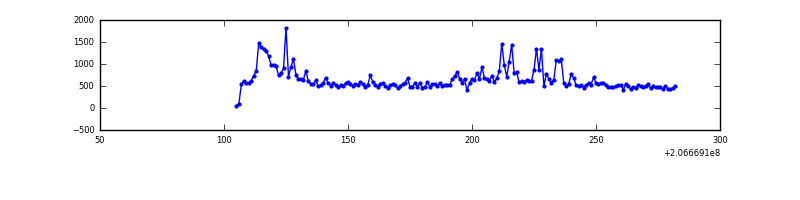 |
| C | 178 | 178 | 0 | 0 | 0.00% | 0.00% | 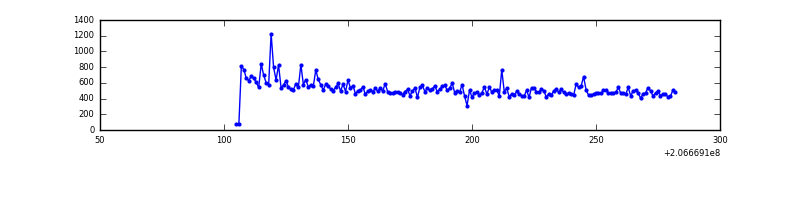 |
| D | 178 | 178 | 4 | 4 | 2.25% | 2.25% | 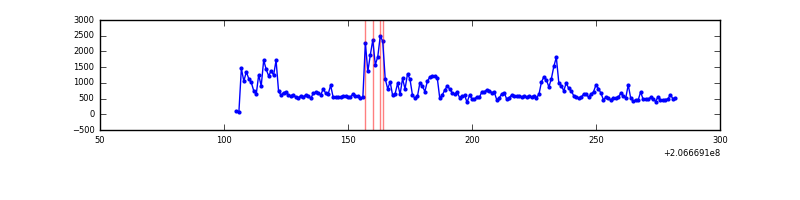 |
Top three noisy pixels from each quadrant. If the there are fewer than three noisy pixels in the level2.evt file, extra rows are filled as -1
| Pixel properties | Quadrant properties | ||||||
|---|---|---|---|---|---|---|---|
| Quadrant | DetID | PixID | Counts | Sigma | Mean | Median | Sigma |
| A | 0 | 50 | 84273 | 13504.81 | 21 | 21 | 6.2 |
| A | 13 | 251 | 759 | 118.29 | 21 | 21 | 6.2 |
| A | 12 | 194 | 220 | 31.9 | 21 | 21 | 6.2 |
| B | 14 | 167 | 19834 | 3066.68 | 23 | 22 | 6.5 |
| B | 5 | 171 | 3234 | 497.18 | 23 | 22 | 6.5 |
| B | 4 | 48 | 1590 | 242.71 | 23 | 22 | 6.5 |
| C | 9 | 247 | 3548 | 493.57 | 22 | 22 | 7.1 |
| C | 9 | 16 | 325 | 42.41 | 22 | 22 | 7.1 |
| C | 7 | 237 | 285 | 36.81 | 22 | 22 | 7.1 |
| D | 9 | 35 | 44379 | 6071.19 | 22 | 21 | 7.3 |
| D | 13 | 239 | 4055 | 552.13 | 22 | 21 | 7.3 |
| D | 2 | 37 | 2598 | 352.71 | 22 | 21 | 7.3 |
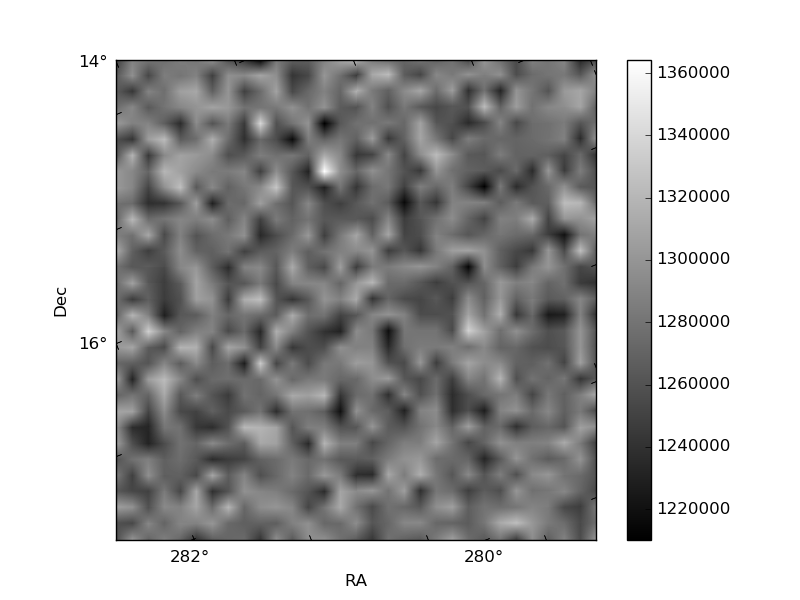
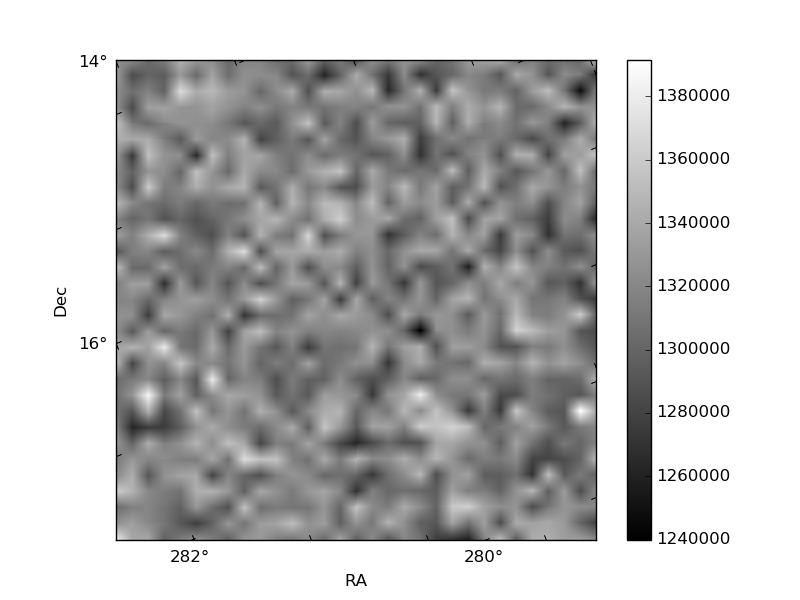
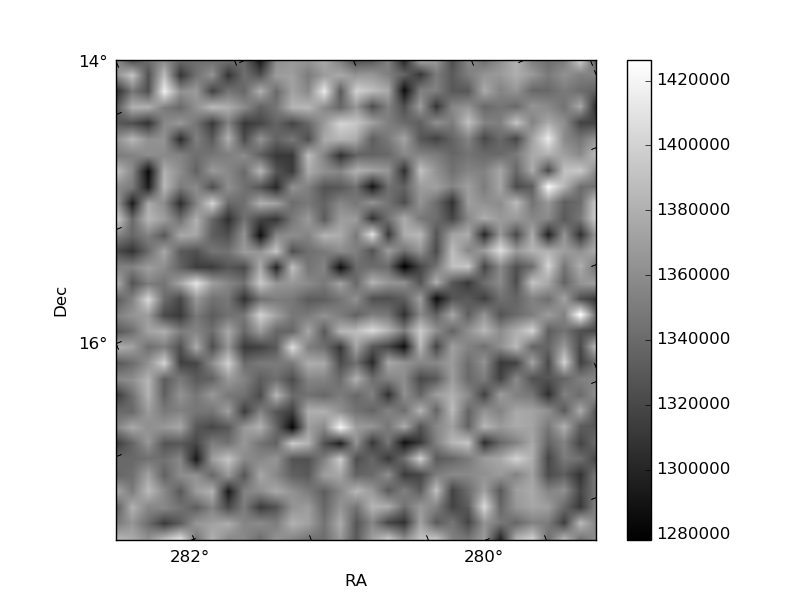
Histogram calculated using DETX and DETY for each event in the final _common_clean file
| Quadrant A | 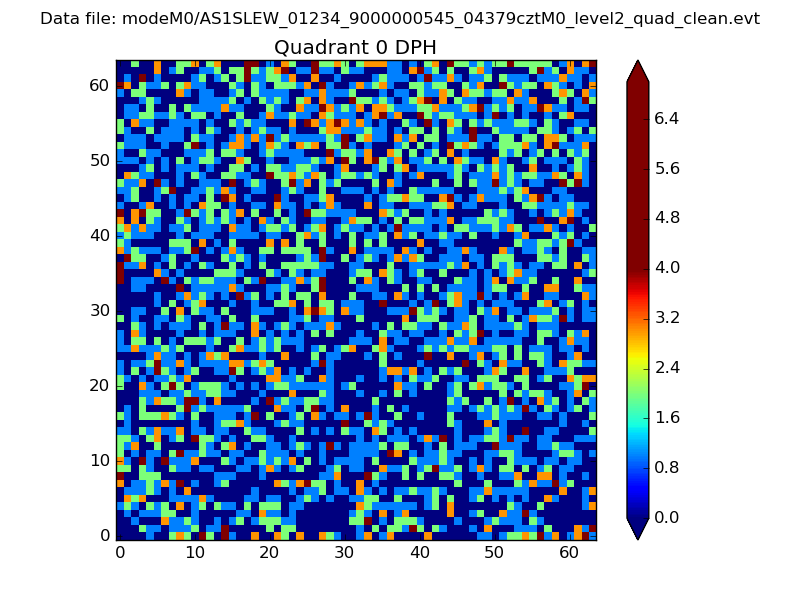 |
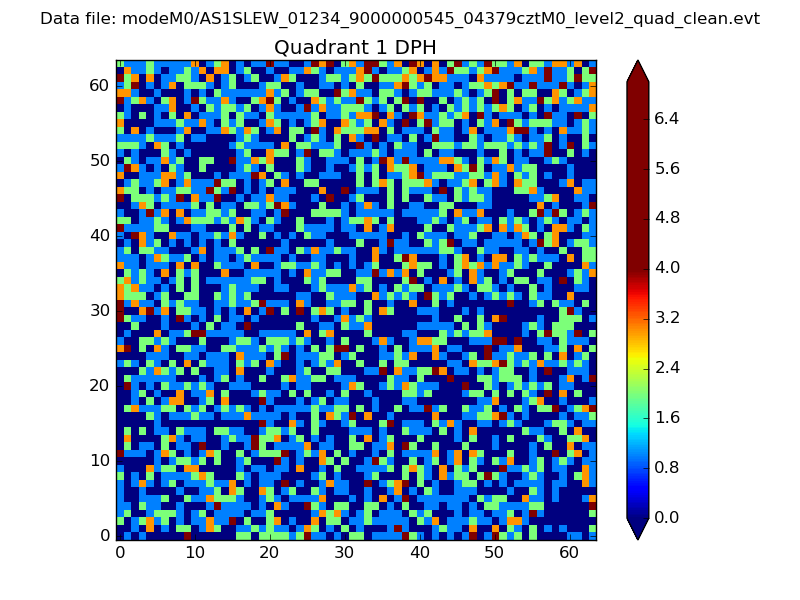 |
Quadrant B |
|---|---|---|---|
| Quadrant D | 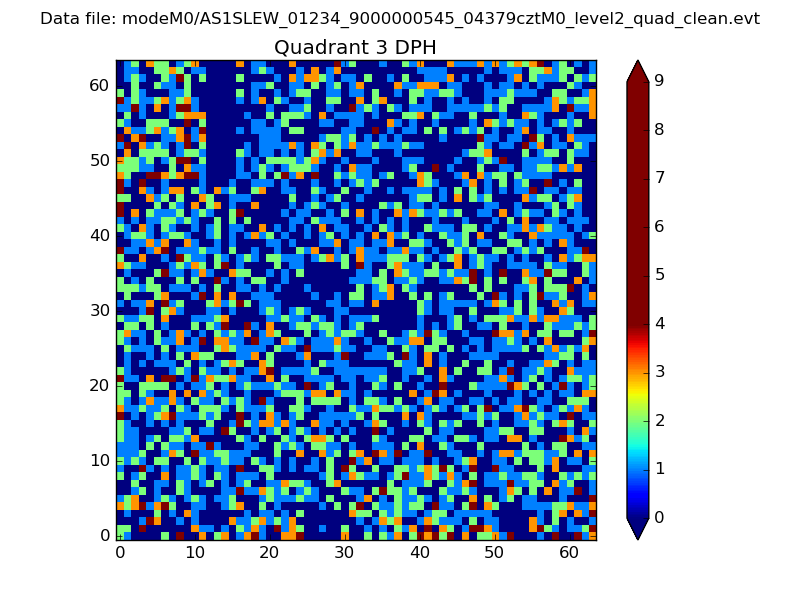 |
 |
Quadrant C |
| Plot type | Count rate plots | Images |
|---|---|---|
| Comparison with Poisson distribution Blue bars denote a histogram of data divided into 1 sec bins. Red curve is a Poisson curve with rate = median count rate of data. |
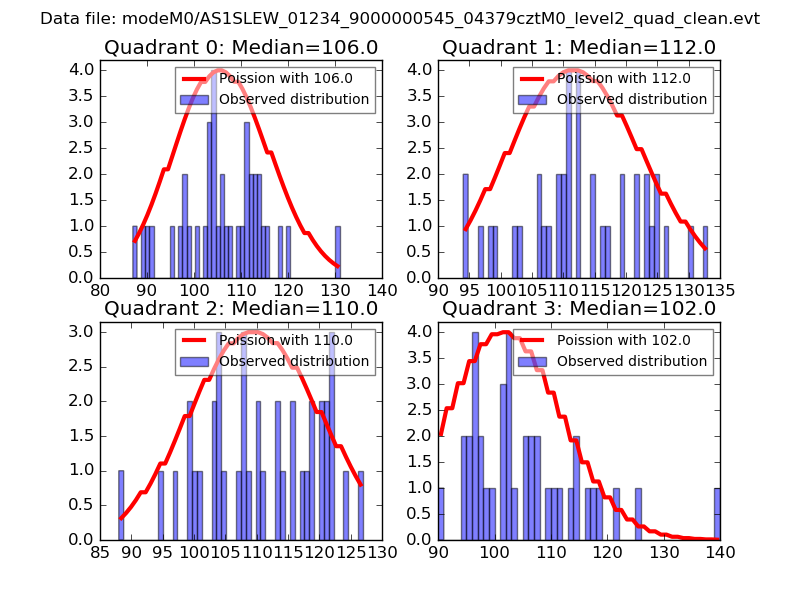 |
 |
| Quadrant-wise count rates Data is divided into 100 sec bins |
 |
|
| Module-wise count rates for Quadrant A Data is divided into 100 sec bins |
 |
 |
| Module-wise count rates for Quadrant B Data is divided into 100 sec bins |
 |
 |
| Module-wise count rates for Quadrant C Data is divided into 100 sec bins |
 |
 |
| Module-wise count rates for Quadrant D Data is divided into 100 sec bins |
 |
 |
| Parameter | Plot |
|---|---|
| CZT HV Monitor | 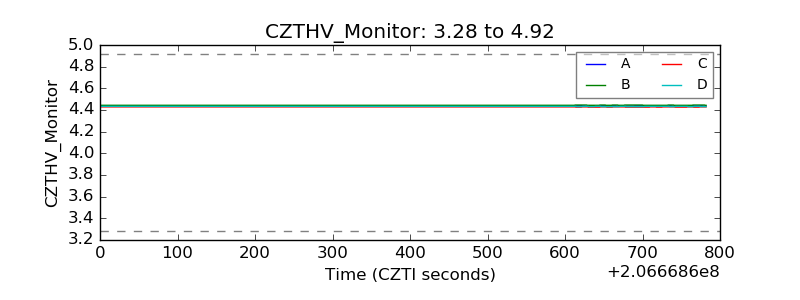 |
| D_VDD |  |
| Temperature 1 | 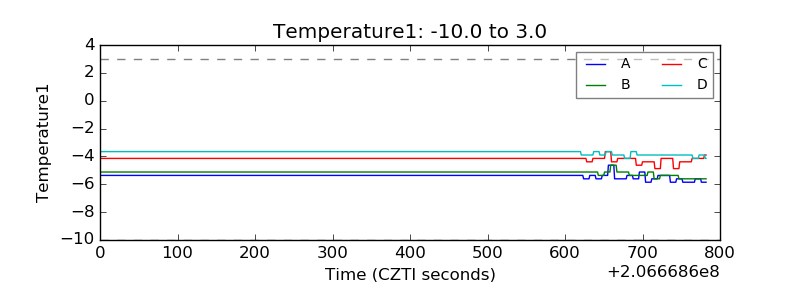 |
| Veto HV Monitor | 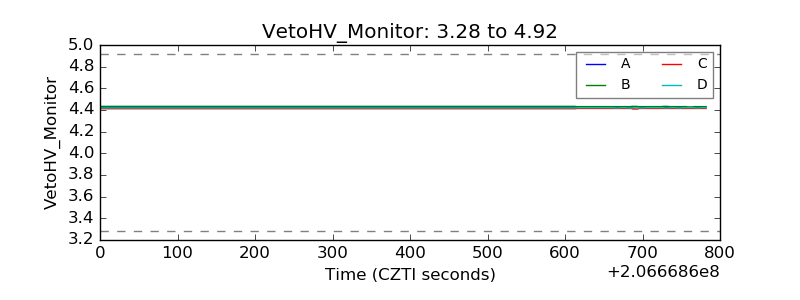 |
| Veto LLD | 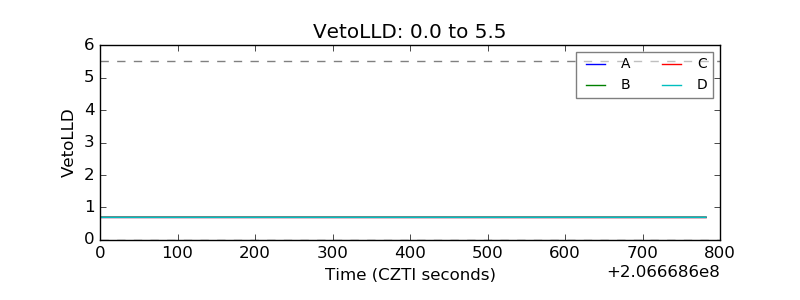 |
| Alpha Counter | 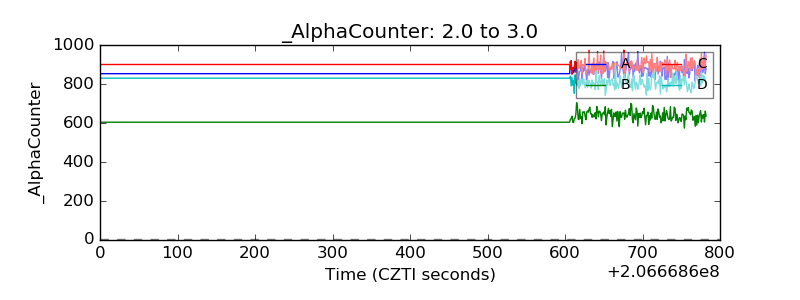 |
| _CPM_Rate | 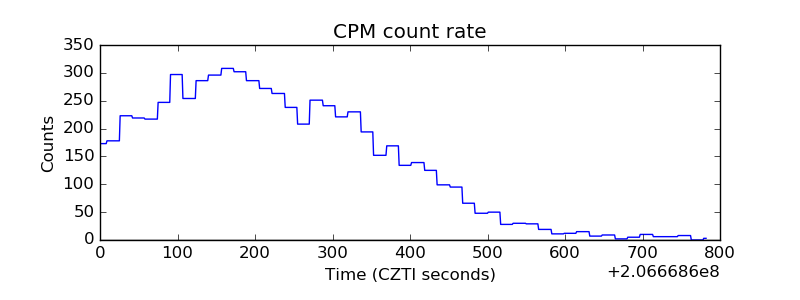 |
| CZT Counter | 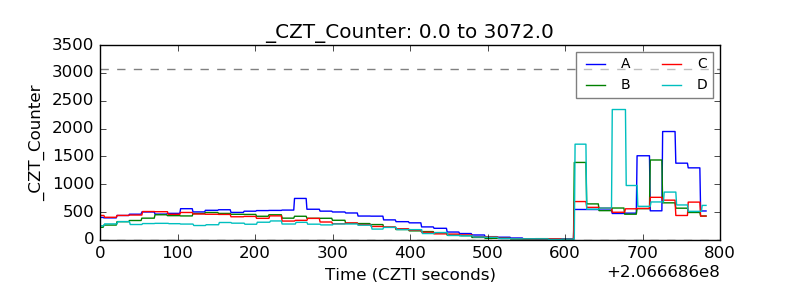 |
| +2.5 Volts monitor |  |
| +5 Volts monitor |  |
| _ROLL_ROT | 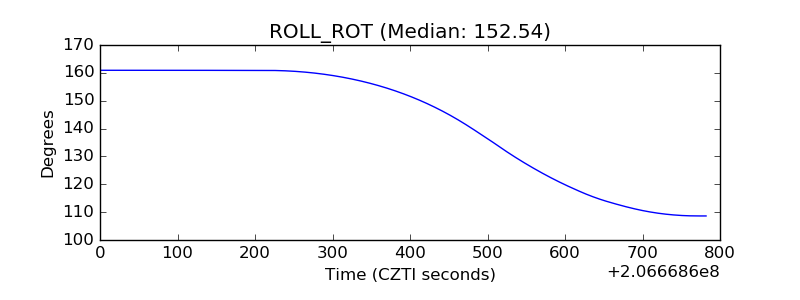 |
| _Roll_DEC | 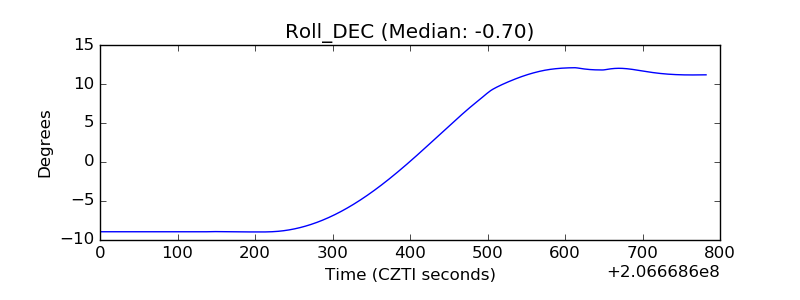 |
| _Roll_RA |  |
| Veto Counter | 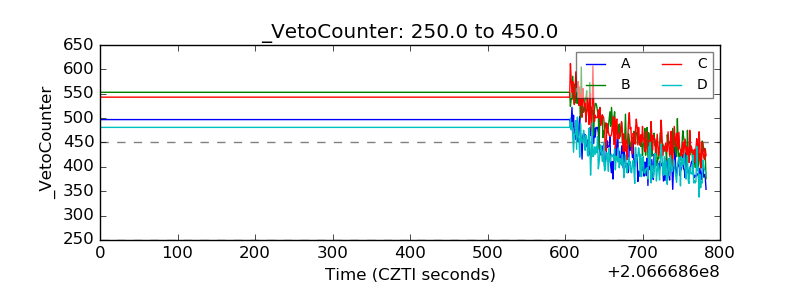 |