| Param | Original file | Final file |
|---|---|---|
| Filename | modeM0/AS1G05_167T02_9000000546cztM0_level2.fits | modeM0/AS1G05_167T02_9000000546cztM0_level2_quad_clean.evt |
| Size (bytes) | 282,867,840 | 224,256,960 |
| Size | 269.8 MB | 213.9 MB |
| Events in quadrant A | 1,714,976 | 1,224,460 |
| Events in quadrant B | 1,671,088 | 1,255,323 |
| Events in quadrant C | 1,677,490 | 1,180,085 |
| Events in quadrant D | 1,451,860 | 1,078,813 |
| Mode SS | |||
|---|---|---|---|
| Quadrant | BADHDUFLAG | Total packets | Discarded packets |
| A | 0 | 606 | 0 |
| B | 0 | 606 | 0 |
| C | 0 | 606 | 0 |
| D | 0 | 606 | 0 |
| Mode M0 | |||
|---|---|---|---|
| Quadrant | BADHDUFLAG | Total packets | Discarded packets |
| A | 0 | 62342 | 0 |
| B | 0 | 62156 | 0 |
| C | 0 | 64389 | 0 |
| D | 0 | 65318 | 0 |
| Mode M9 | |||
|---|---|---|---|
| Quadrant | BADHDUFLAG | Total packets | Discarded packets |
| A | 0 | 57 | 0 |
| B | 0 | 57 | 0 |
| C | 0 | 57 | 0 |
| D | 0 | 57 | 0 |
| Quadrant | Total seconds | Saturated seconds | Saturation percentage |
|---|---|---|---|
| A | 29852 | 215 | 0.720220% |
| B | 29851 | 238 | 0.797293% |
| C | 29852 | 292 | 0.978159% |
| D | 29854 | 295 | 0.988142% |
Noise dominated data is calculated using 1-second bins in cleaned event files. If a bin has >2000 counts, and if more than 50% of those come from <1% of pixels, then it is considered to be noise-dominated and hence unusable.
| Quadrant | # 1 sec bins | Bins with >0 counts | Bins with >2000 counts | High rate bins dominated by noise | Noise dominated (total time) | Noise dominated (detector-on time) | Marked lightcurve |
|---|---|---|---|---|---|---|---|
| A | 35458 | 29850 | 0 | 0 | 0.00% | 0.00% |  |
| B | 35458 | 29849 | 0 | 0 | 0.00% | 0.00% |  |
| C | 35459 | 29851 | 0 | 0 | 0.00% | 0.00% | 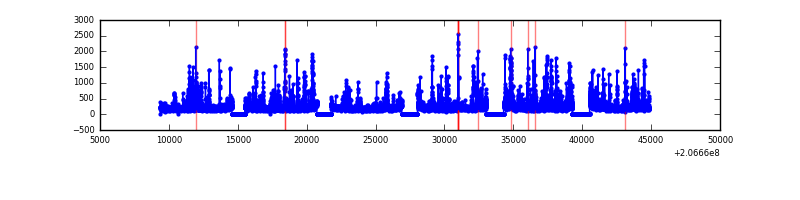 |
| D | 35458 | 29852 | 0 | 0 | 0.00% | 0.00% |  |
Top three noisy pixels from each quadrant. If the there are fewer than three noisy pixels in the level2.evt file, extra rows are filled as -1
| Pixel properties | Quadrant properties | ||||||
|---|---|---|---|---|---|---|---|
| Quadrant | DetID | PixID | Counts | Sigma | Mean | Median | Sigma |
| A | 0 | 29 | 1672 | 10.86 | 445 | 415 | 115.7 |
| A | 7 | 110 | 1420 | 8.69 | 445 | 415 | 115.7 |
| A | 9 | 19 | 1296 | 7.61 | 445 | 415 | 115.7 |
| B | 2 | 9 | 1465 | 11.34 | 440 | 417 | 92.4 |
| B | 5 | 128 | 1187 | 8.33 | 440 | 417 | 92.4 |
| B | 12 | 226 | 1187 | 8.33 | 440 | 417 | 92.4 |
| C | 1 | 80 | 1199 | 6.53 | 443 | 410 | 120.8 |
| C | 9 | 188 | 1165 | 6.25 | 443 | 410 | 120.8 |
| C | 12 | 241 | 1160 | 6.21 | 443 | 410 | 120.8 |
| D | 11 | 82 | 1208 | 7.54 | 412 | 375 | 110.5 |
| D | 1 | 19 | 1083 | 6.41 | 412 | 375 | 110.5 |
| D | 7 | 5 | 1067 | 6.26 | 412 | 375 | 110.5 |
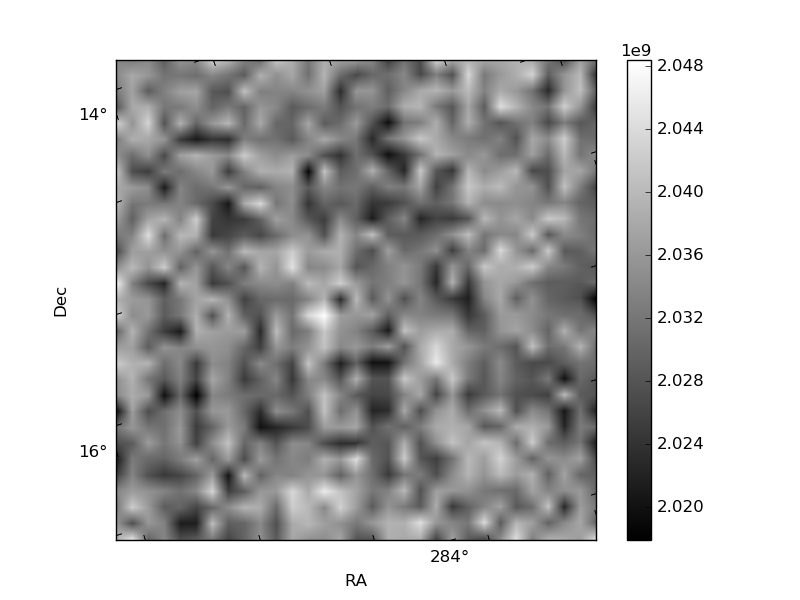
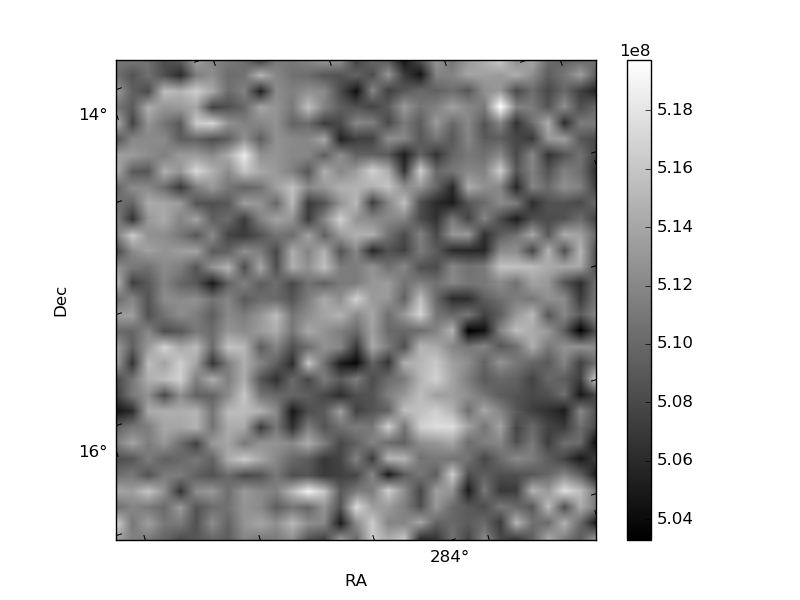
Histogram calculated using DETX and DETY for each event in the final _common_clean file
| Quadrant A | 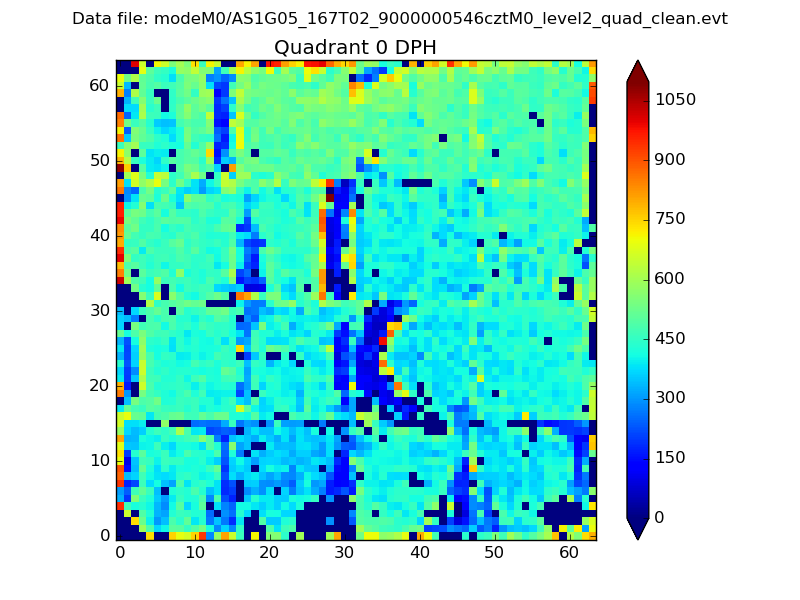 |
 |
Quadrant B |
|---|---|---|---|
| Quadrant D | 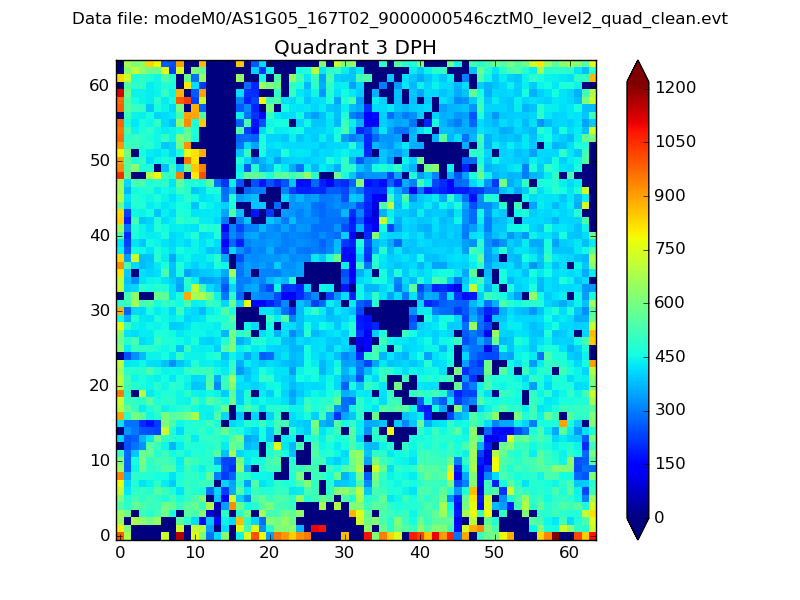 |
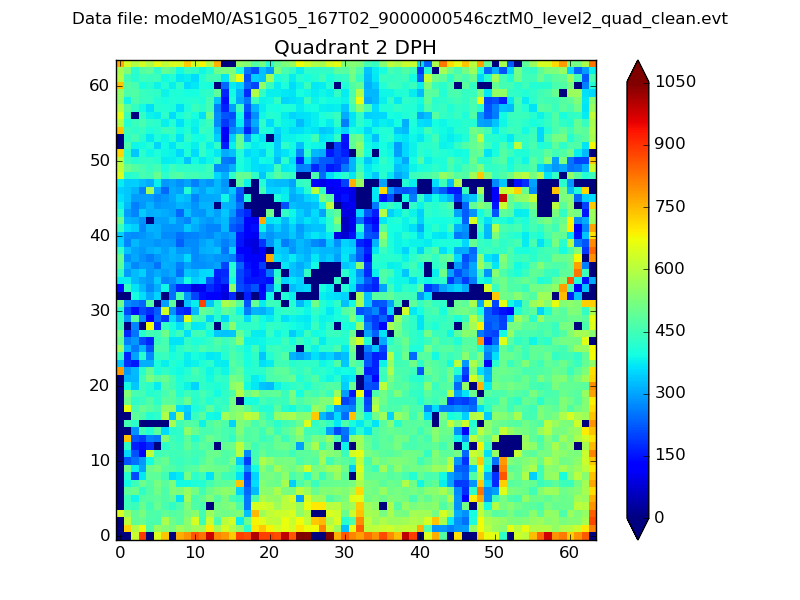 |
Quadrant C |
| Plot type | Count rate plots | Images |
|---|---|---|
| Comparison with Poisson distribution Blue bars denote a histogram of data divided into 1 sec bins. Red curve is a Poisson curve with rate = median count rate of data. |
 |
 |
| Quadrant-wise count rates Data is divided into 100 sec bins |
 |
|
| Module-wise count rates for Quadrant A Data is divided into 100 sec bins |
 |
 |
| Module-wise count rates for Quadrant B Data is divided into 100 sec bins |
 |
 |
| Module-wise count rates for Quadrant C Data is divided into 100 sec bins |
 |
 |
| Module-wise count rates for Quadrant D Data is divided into 100 sec bins |
 |
 |
| Parameter | Plot |
|---|---|
| CZT HV Monitor |  |
| D_VDD |  |
| Temperature 1 |  |
| Veto HV Monitor |  |
| Veto LLD |  |
| Alpha Counter |  |
| _CPM_Rate | 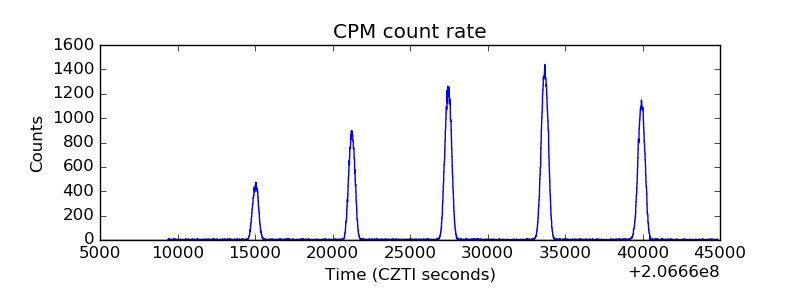 |
| CZT Counter |  |
| +2.5 Volts monitor |  |
| +5 Volts monitor |  |
| _ROLL_ROT |  |
| _Roll_DEC |  |
| _Roll_RA | 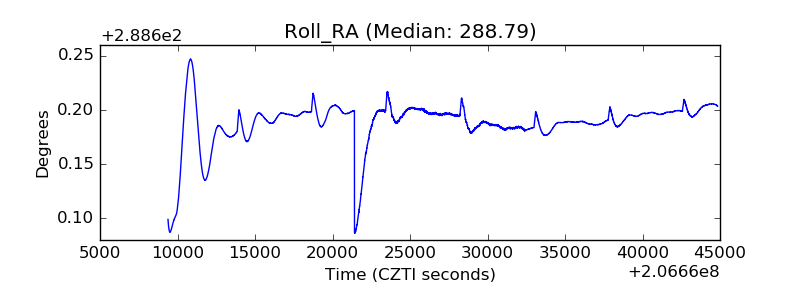 |
| Veto Counter | 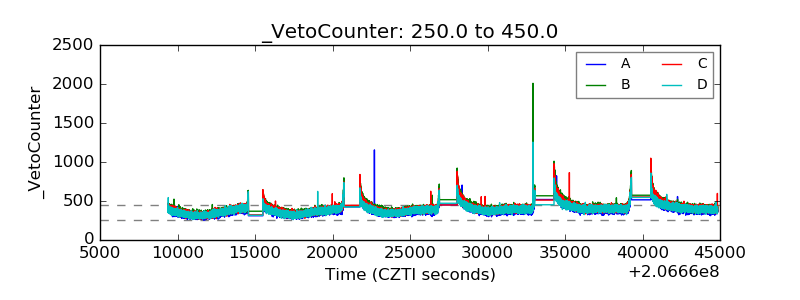 |