| Param | Original file | Final file |
|---|---|---|
| Filename | modeM0/AS1G05_167T02_9000000546_04379cztM0_level2.evt | modeM0/AS1G05_167T02_9000000546_04379cztM0_level2_quad_clean.evt |
| Size (bytes) | 87,698,880 | 21,686,400 |
| Size | 83.6 MB | 20.7 MB |
| Events in quadrant A | 615,788 | 139,023 |
| Events in quadrant B | 747,361 | 140,005 |
| Events in quadrant C | 584,901 | 141,645 |
| Events in quadrant D | 612,729 | 134,152 |
| Mode SS | |||
|---|---|---|---|
| Quadrant | BADHDUFLAG | Total packets | Discarded packets |
| A | 0 | 28 | 0 |
| B | 0 | 28 | 0 |
| C | 0 | 28 | 0 |
| D | 0 | 28 | 0 |
| Mode M0 | |||
|---|---|---|---|
| Quadrant | BADHDUFLAG | Total packets | Discarded packets |
| A | 0 | 2840 | 1 |
| B | 0 | 3127 | 0 |
| C | 0 | 2731 | 2 |
| D | 0 | 2843 | 0 |
| Quadrant | Total seconds | Saturated seconds | Saturation percentage |
|---|---|---|---|
| A | 1353 | 4 | 0.295639% |
| B | 1353 | 18 | 1.330377% |
| C | 1352 | 1 | 0.073964% |
| D | 1353 | 1 | 0.073910% |
Noise dominated data is calculated using 1-second bins in cleaned event files. If a bin has >2000 counts, and if more than 50% of those come from <1% of pixels, then it is considered to be noise-dominated and hence unusable.
| Quadrant | # 1 sec bins | Bins with >0 counts | Bins with >2000 counts | High rate bins dominated by noise | Noise dominated (total time) | Noise dominated (detector-on time) | Marked lightcurve |
|---|---|---|---|---|---|---|---|
| A | 1353 | 1353 | 4 | 4 | 0.30% | 0.30% | 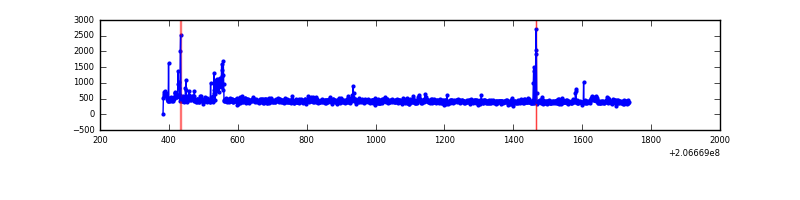 |
| B | 1353 | 1353 | 17 | 17 | 1.26% | 1.26% | 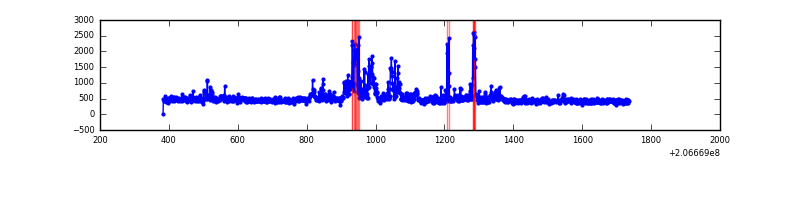 |
| C | 1353 | 1353 | 0 | 0 | 0.00% | 0.00% | 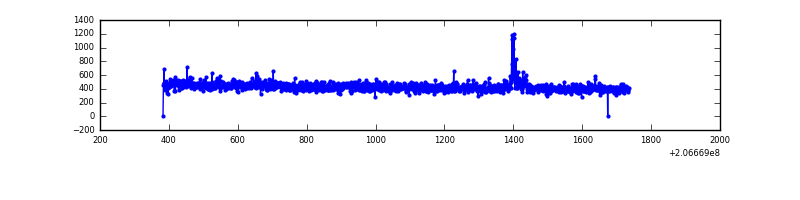 |
| D | 1353 | 1353 | 2 | 2 | 0.15% | 0.15% | 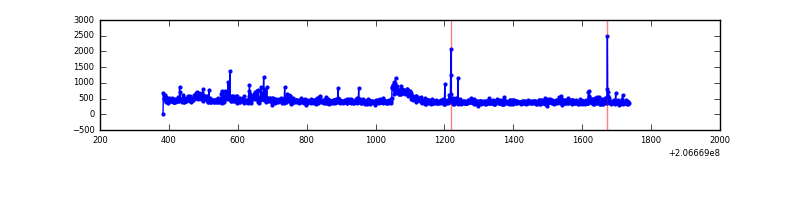 |
Top three noisy pixels from each quadrant. If the there are fewer than three noisy pixels in the level2.evt file, extra rows are filled as -1
| Pixel properties | Quadrant properties | ||||||
|---|---|---|---|---|---|---|---|
| Quadrant | DetID | PixID | Counts | Sigma | Mean | Median | Sigma |
| A | 13 | 251 | 32330 | 1011.0 | 146 | 143 | 31.8 |
| A | 0 | 50 | 14985 | 466.19 | 146 | 143 | 31.8 |
| A | 15 | 234 | 1831 | 53.02 | 146 | 143 | 31.8 |
| B | 14 | 167 | 114006 | 3673.03 | 149 | 146 | 31.0 |
| B | 5 | 200 | 22325 | 715.48 | 149 | 146 | 31.0 |
| B | 4 | 48 | 22166 | 710.35 | 149 | 146 | 31.0 |
| C | 9 | 247 | 9255 | 253.81 | 146 | 147 | 35.9 |
| C | 14 | 48 | 2956 | 78.28 | 146 | 147 | 35.9 |
| C | 13 | 61 | 1184 | 28.9 | 146 | 147 | 35.9 |
| D | 9 | 35 | 26149 | 711.83 | 142 | 138 | 36.5 |
| D | 2 | 37 | 16677 | 452.61 | 142 | 138 | 36.5 |
| D | 4 | 95 | 8603 | 231.66 | 142 | 138 | 36.5 |
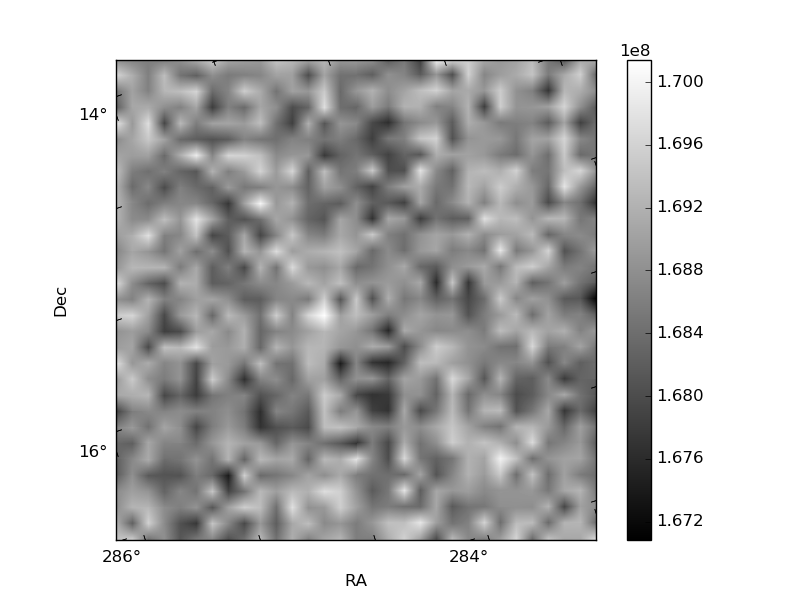
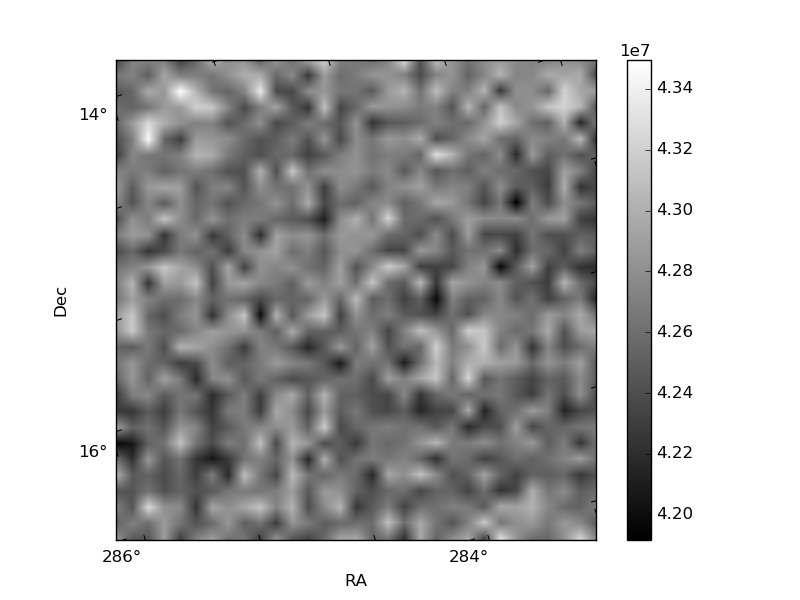
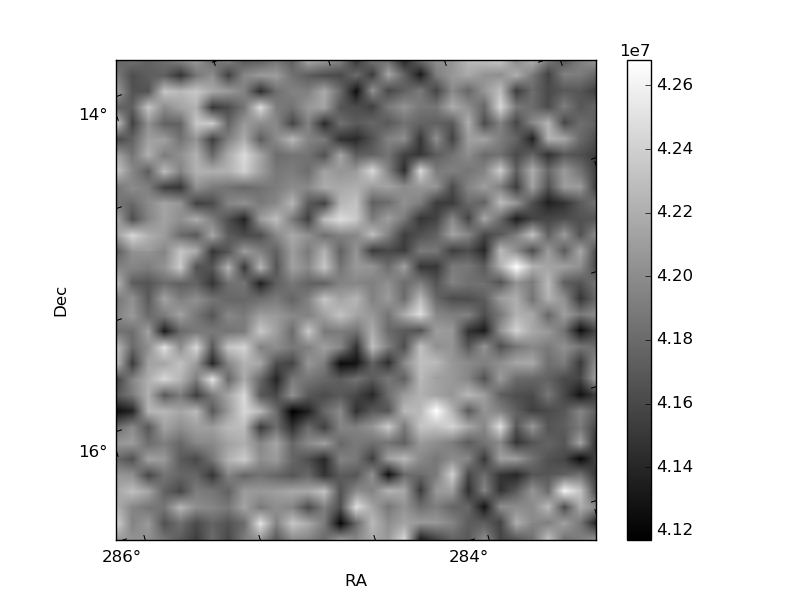
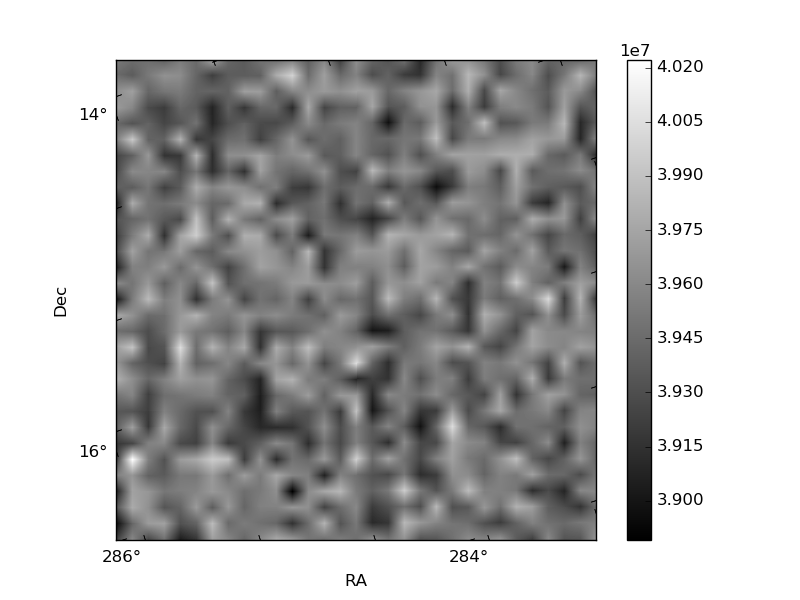
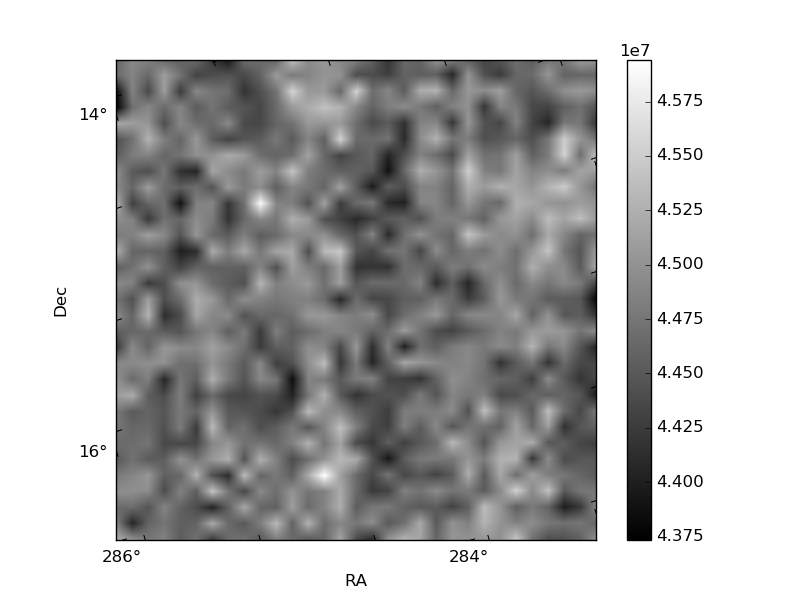
Histogram calculated using DETX and DETY for each event in the final _common_clean file
| Quadrant A | 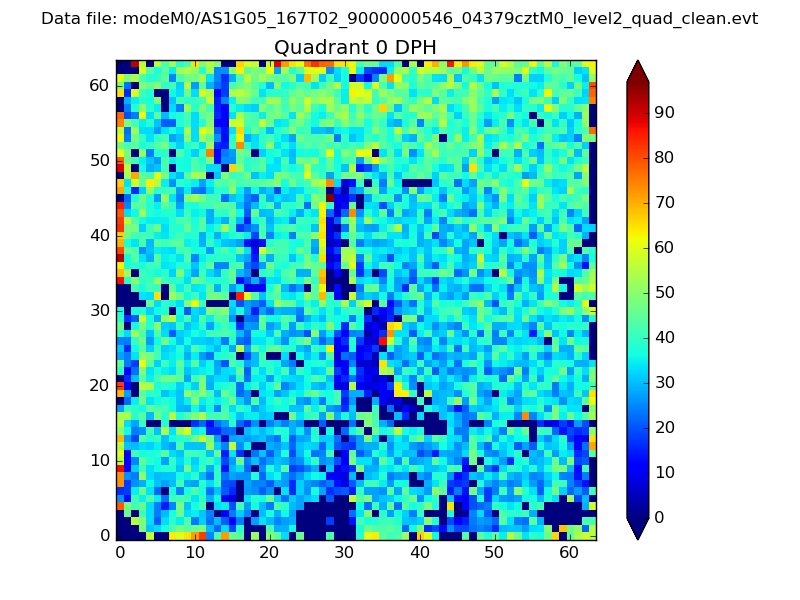 |
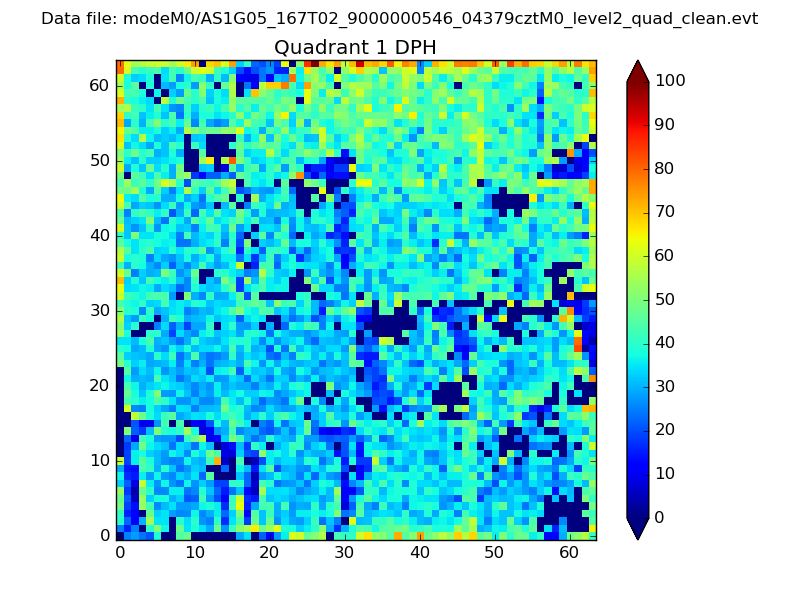 |
Quadrant B |
|---|---|---|---|
| Quadrant D | 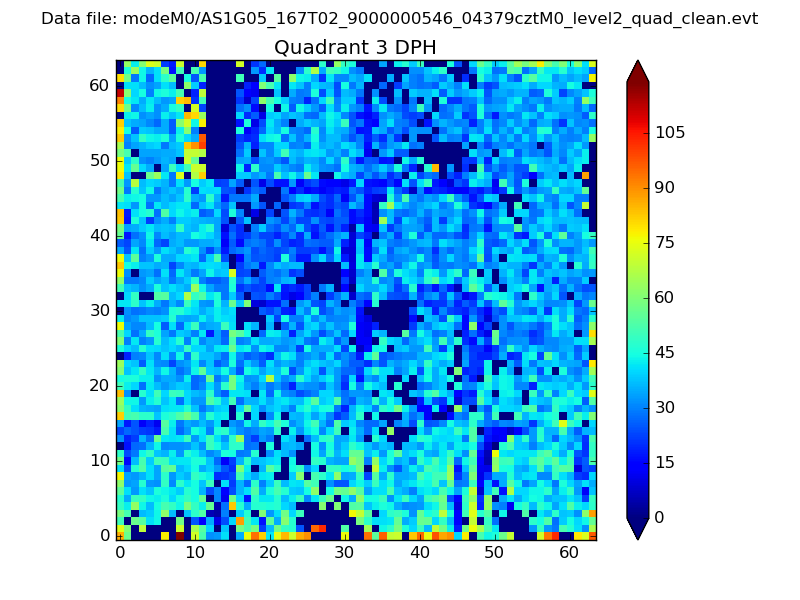 |
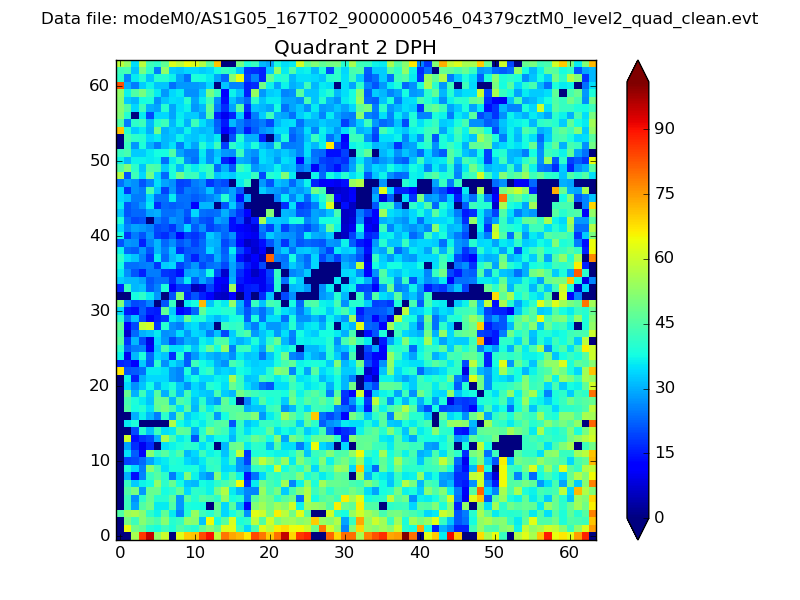 |
Quadrant C |
| Plot type | Count rate plots | Images |
|---|---|---|
| Comparison with Poisson distribution Blue bars denote a histogram of data divided into 1 sec bins. Red curve is a Poisson curve with rate = median count rate of data. |
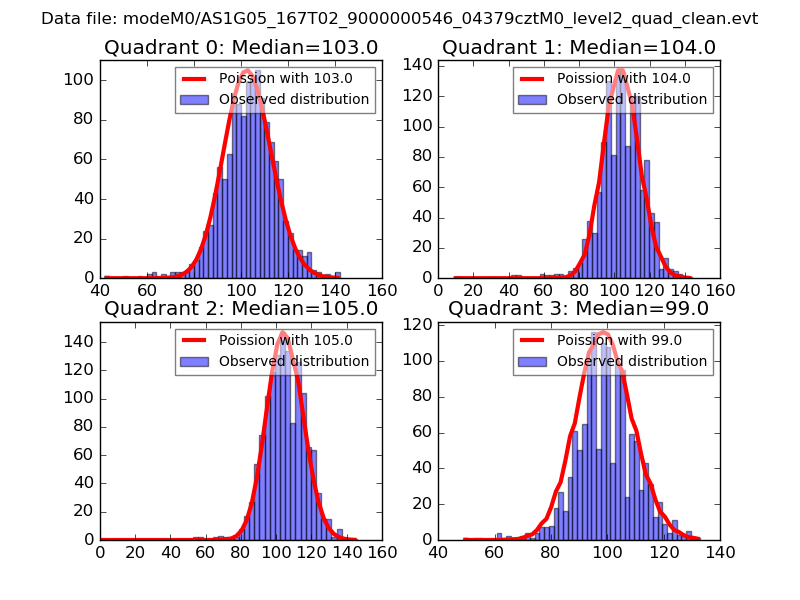 |
 |
| Quadrant-wise count rates Data is divided into 100 sec bins |
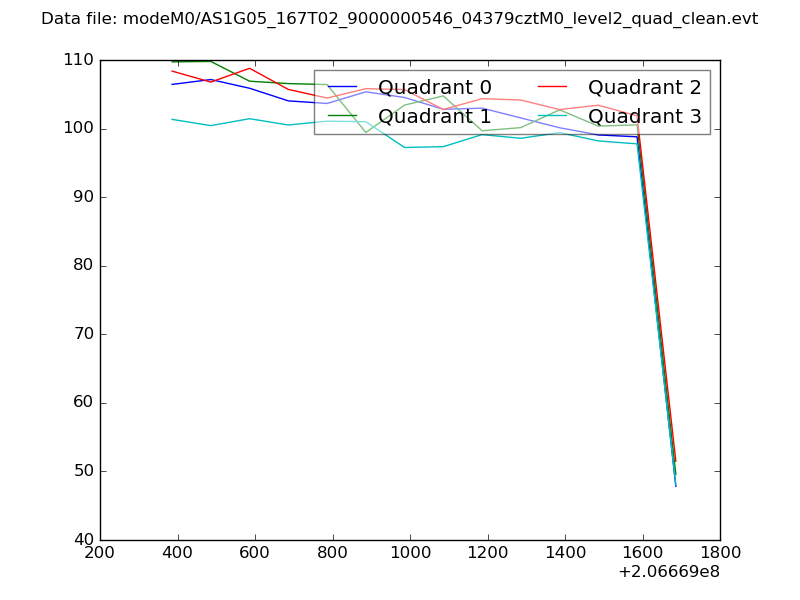 |
|
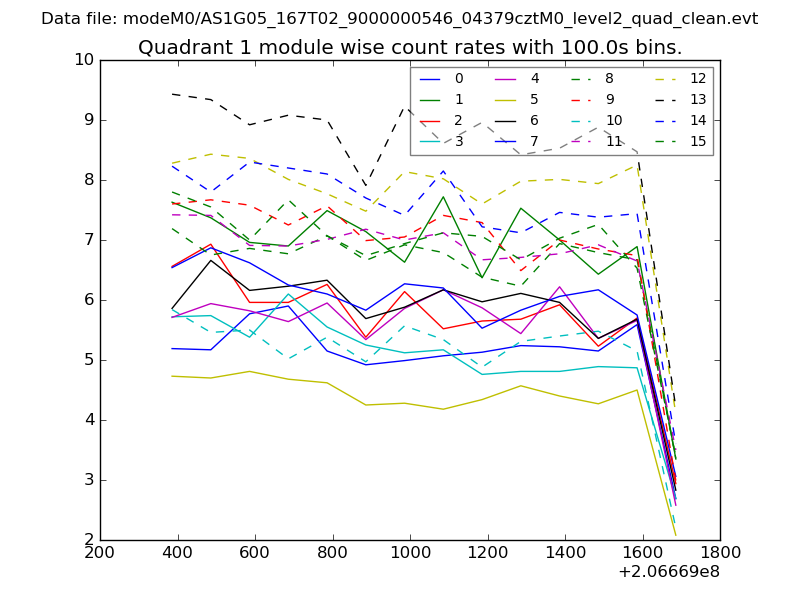
| Module-wise count rates for Quadrant A Data is divided into 100 sec bins |
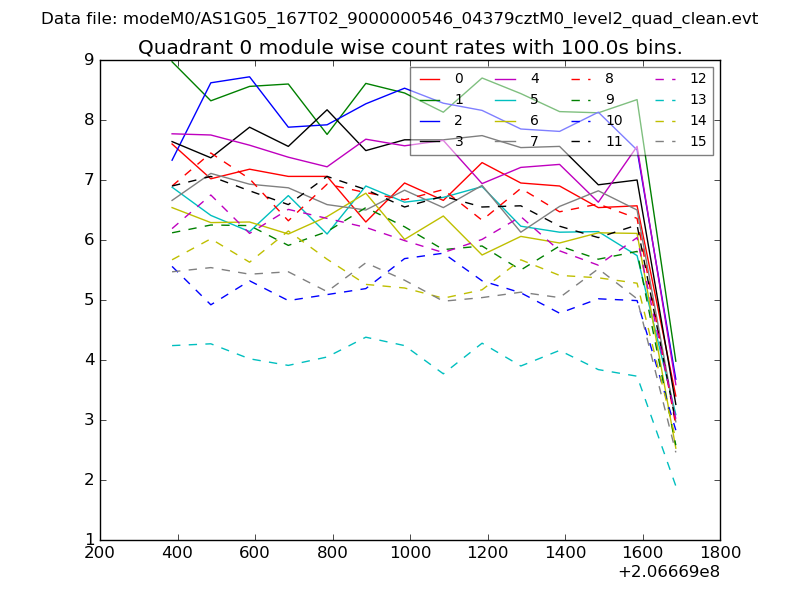 |
 |
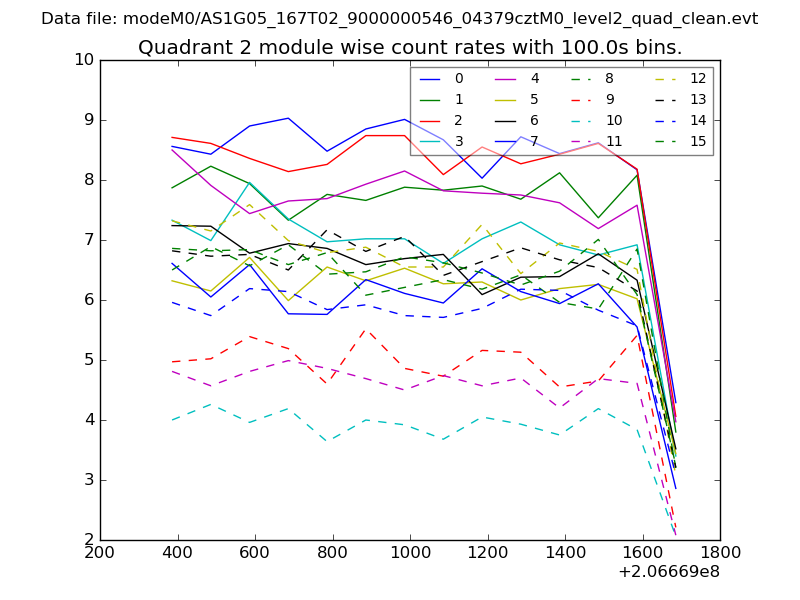
| Module-wise count rates for Quadrant B Data is divided into 100 sec bins |
 |
 |
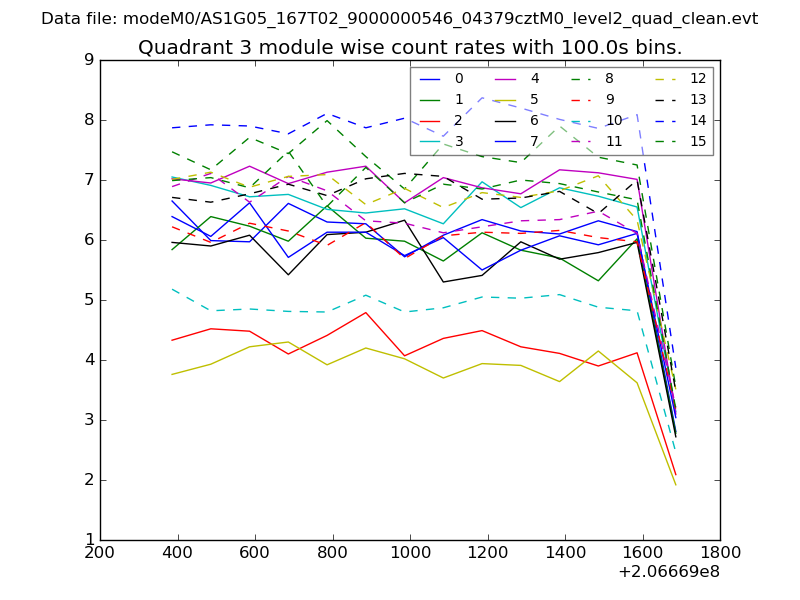
| Module-wise count rates for Quadrant C Data is divided into 100 sec bins |
 |
 |
| Module-wise count rates for Quadrant D Data is divided into 100 sec bins |
 |
 |
| Parameter | Plot |
|---|---|
| CZT HV Monitor | 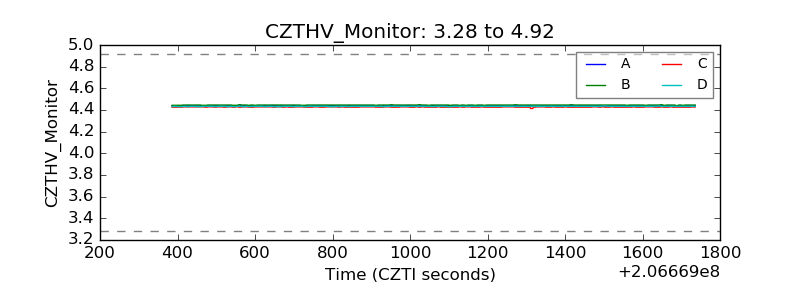 |
| D_VDD | 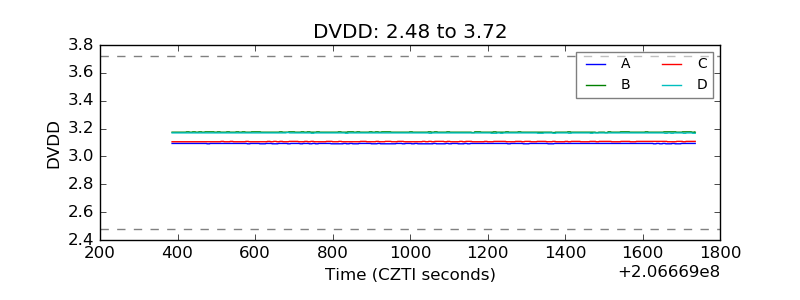 |
| Temperature 1 | 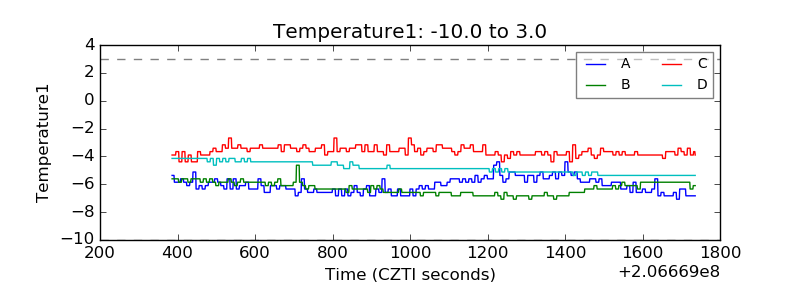 |
| Veto HV Monitor | 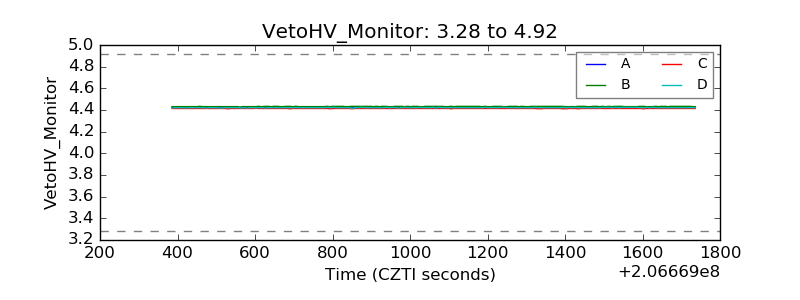 |
| Veto LLD | 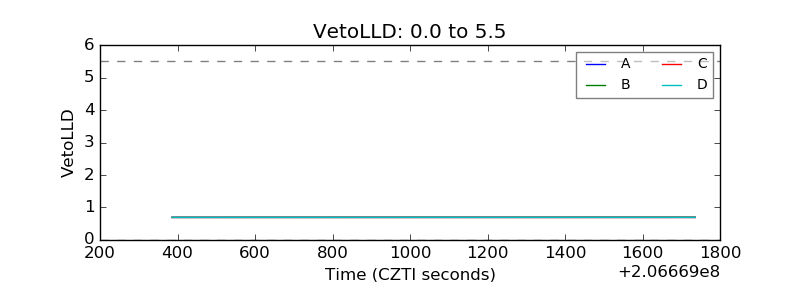 |
| Alpha Counter | 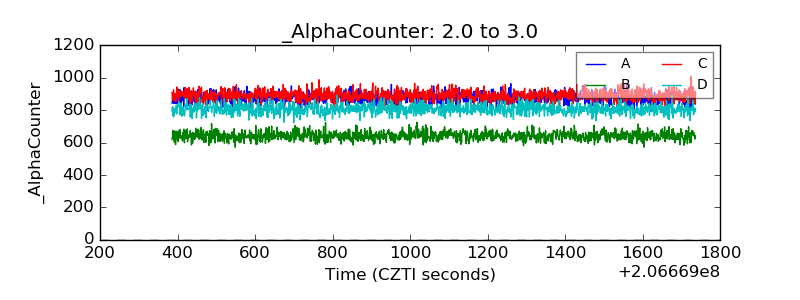 |
| _CPM_Rate | 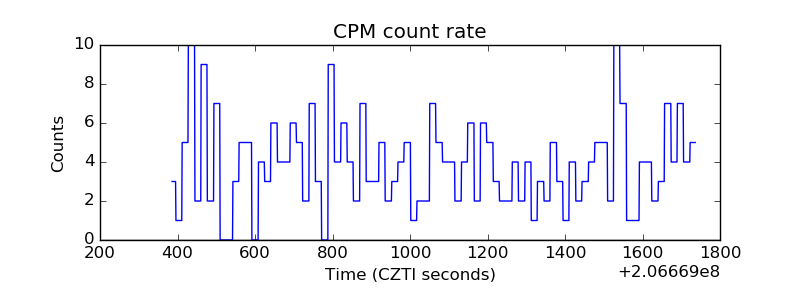 |
| CZT Counter | 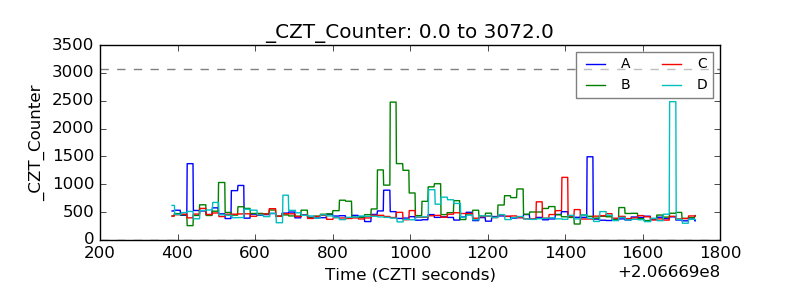 |
| +2.5 Volts monitor | 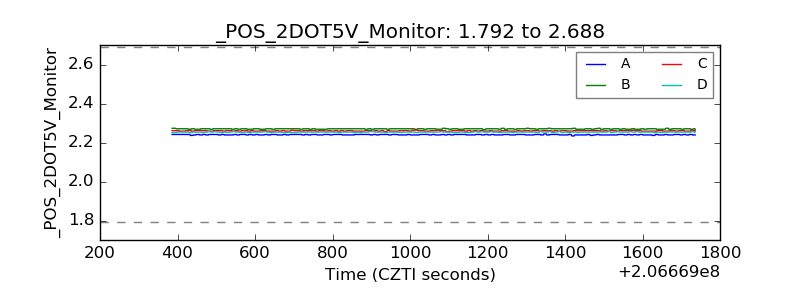 |
| +5 Volts monitor | 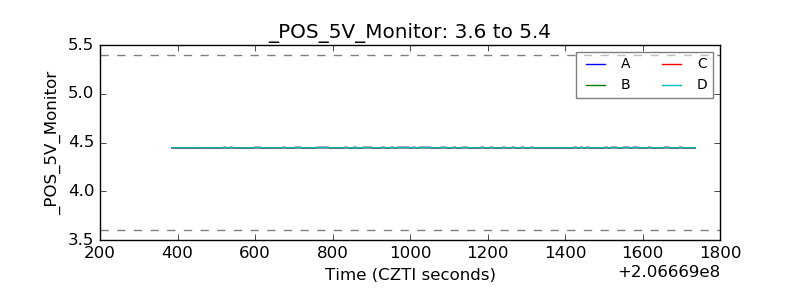 |
| _ROLL_ROT | 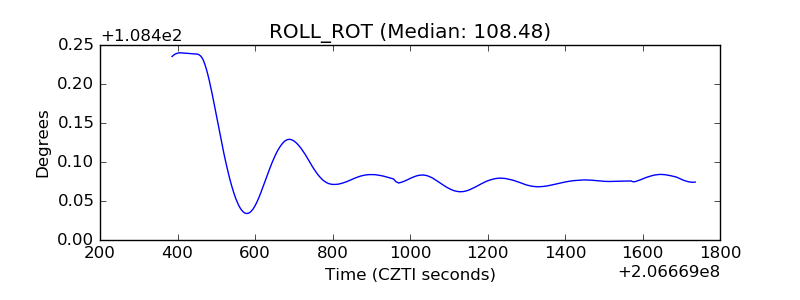 |
| _Roll_DEC | 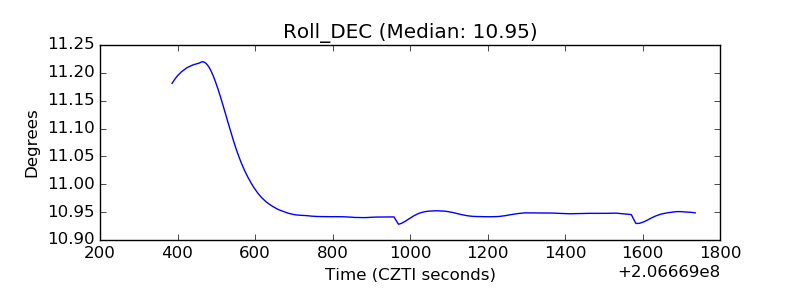 |
| _Roll_RA | 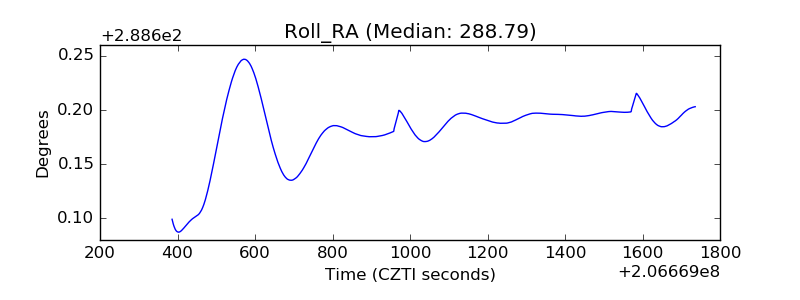 |
| Veto Counter | 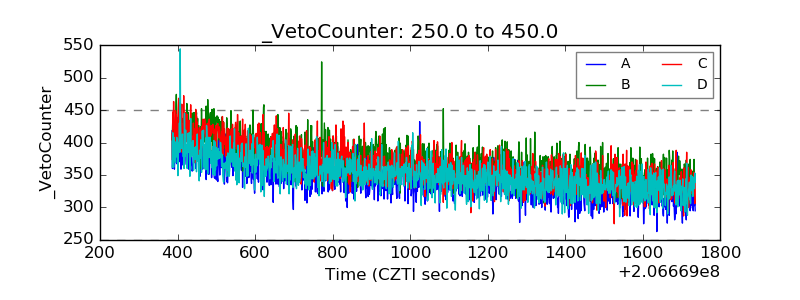 |