| Param | Original file | Final file |
|---|---|---|
| Filename | modeM0/AS1G05_167T02_9000000546_04383cztM0_level2.evt | modeM0/AS1G05_167T02_9000000546_04383cztM0_level2_quad_clean.evt |
| Size (bytes) | 426,044,160 | 66,962,880 |
| Size | 406.3 MB | 63.9 MB |
| Events in quadrant A | 3,100,261 | 395,866 |
| Events in quadrant B | 3,160,111 | 405,192 |
| Events in quadrant C | 3,074,872 | 398,294 |
| Events in quadrant D | 3,128,316 | 377,694 |
| Mode SS | |||
|---|---|---|---|
| Quadrant | BADHDUFLAG | Total packets | Discarded packets |
| A | 0 | 130 | 0 |
| B | 0 | 130 | 0 |
| C | 0 | 130 | 0 |
| D | 0 | 130 | 0 |
| Mode M0 | |||
|---|---|---|---|
| Quadrant | BADHDUFLAG | Total packets | Discarded packets |
| A | 0 | 13448 | 3 |
| B | 0 | 13515 | 2 |
| C | 0 | 13501 | 2 |
| D | 0 | 14035 | 2 |
| Mode M9 | |||
|---|---|---|---|
| Quadrant | BADHDUFLAG | Total packets | Discarded packets |
| A | 0 | 13 | 0 |
| B | 0 | 13 | 0 |
| C | 0 | 13 | 0 |
| D | 0 | 14 | 0 |
| Quadrant | Total seconds | Saturated seconds | Saturation percentage |
|---|---|---|---|
| A | 6462 | 38 | 0.588053% |
| B | 6462 | 53 | 0.820180% |
| C | 6462 | 25 | 0.386877% |
| D | 6462 | 56 | 0.866605% |
Noise dominated data is calculated using 1-second bins in cleaned event files. If a bin has >2000 counts, and if more than 50% of those come from <1% of pixels, then it is considered to be noise-dominated and hence unusable.
| Quadrant | # 1 sec bins | Bins with >0 counts | Bins with >2000 counts | High rate bins dominated by noise | Noise dominated (total time) | Noise dominated (detector-on time) | Marked lightcurve |
|---|---|---|---|---|---|---|---|
| A | 7612 | 6463 | 8 | 8 | 0.11% | 0.12% | 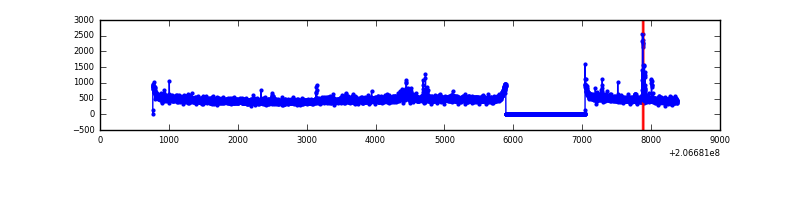 |
| B | 7612 | 6463 | 18 | 18 | 0.24% | 0.28% | 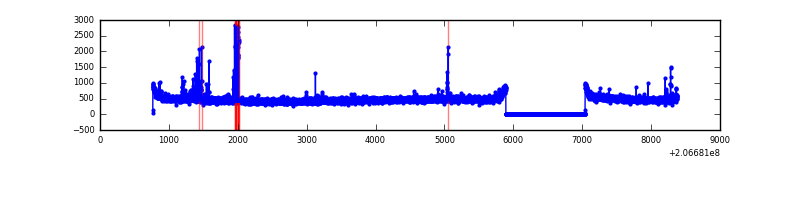 |
| C | 7612 | 6463 | 6 | 6 | 0.08% | 0.09% | 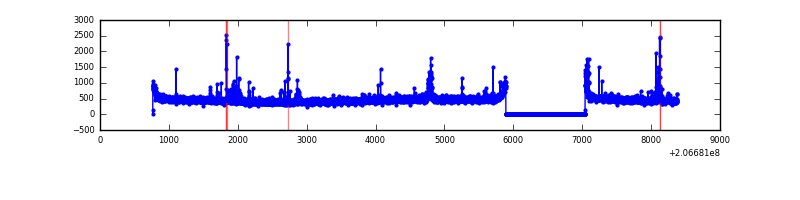 |
| D | 7612 | 6463 | 62 | 62 | 0.81% | 0.96% | 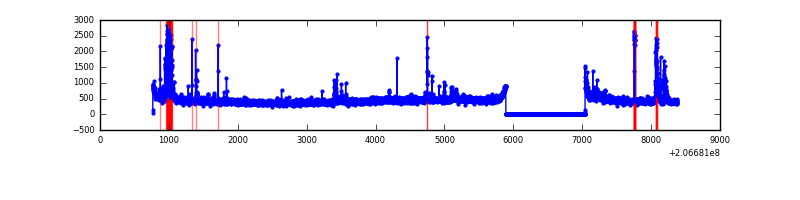 |
Top three noisy pixels from each quadrant. If the there are fewer than three noisy pixels in the level2.evt file, extra rows are filled as -1
| Pixel properties | Quadrant properties | ||||||
|---|---|---|---|---|---|---|---|
| Quadrant | DetID | PixID | Counts | Sigma | Mean | Median | Sigma |
| A | 15 | 234 | 43651 | 272.88 | 775 | 760 | 157.2 |
| A | 13 | 251 | 42555 | 265.91 | 775 | 760 | 157.2 |
| A | 8 | 15 | 22410 | 137.74 | 775 | 760 | 157.2 |
| B | 5 | 200 | 111691 | 740.95 | 783 | 767 | 149.7 |
| B | 14 | 167 | 15300 | 97.08 | 783 | 767 | 149.7 |
| B | 12 | 111 | 14293 | 90.35 | 783 | 767 | 149.7 |
| C | 9 | 247 | 92388 | 523.36 | 749 | 754 | 175.1 |
| C | 14 | 48 | 38316 | 214.53 | 749 | 754 | 175.1 |
| C | 9 | 16 | 16925 | 92.36 | 749 | 754 | 175.1 |
| D | 13 | 239 | 103516 | 573.87 | 738 | 717 | 179.1 |
| D | 13 | 112 | 64696 | 357.16 | 738 | 717 | 179.1 |
| D | 2 | 37 | 55613 | 306.45 | 738 | 717 | 179.1 |
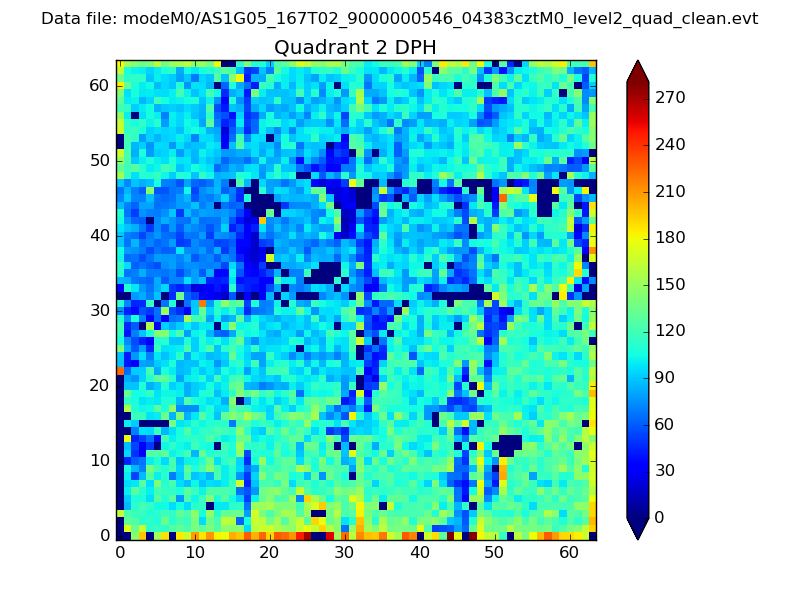
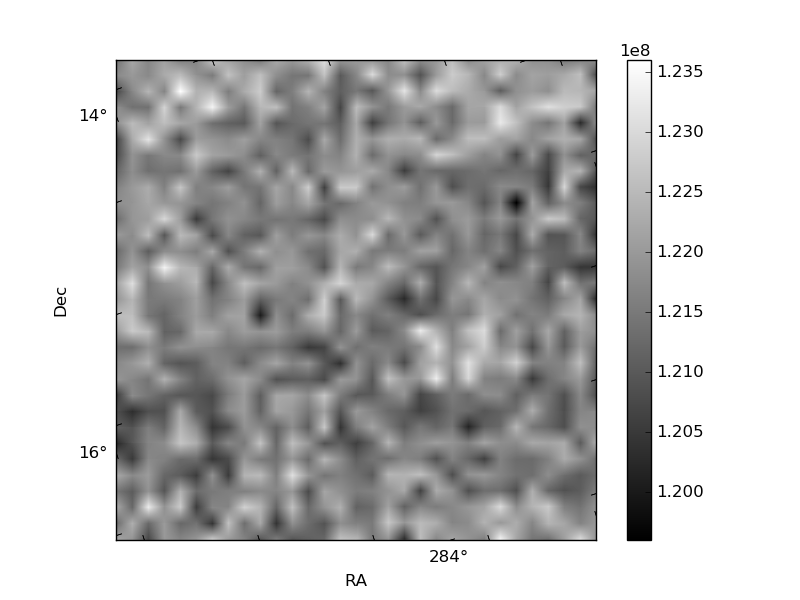
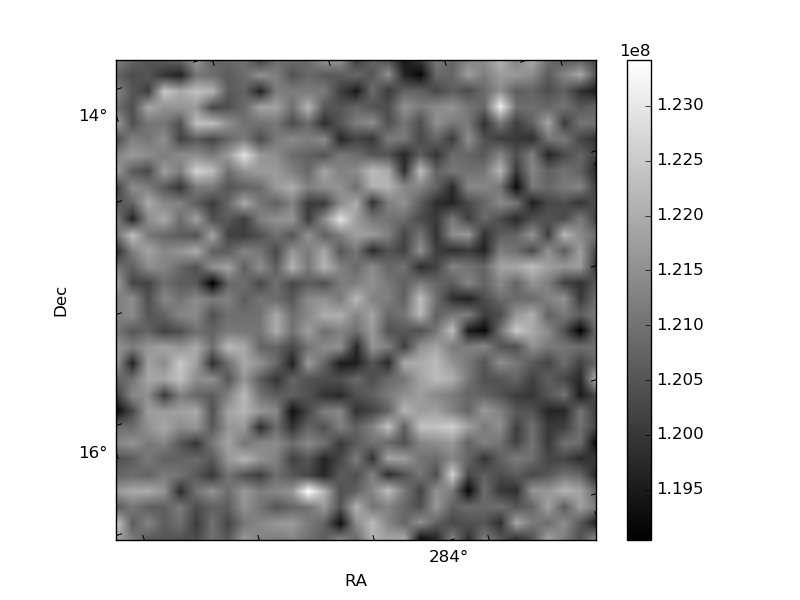
Histogram calculated using DETX and DETY for each event in the final _common_clean file
| Quadrant A | 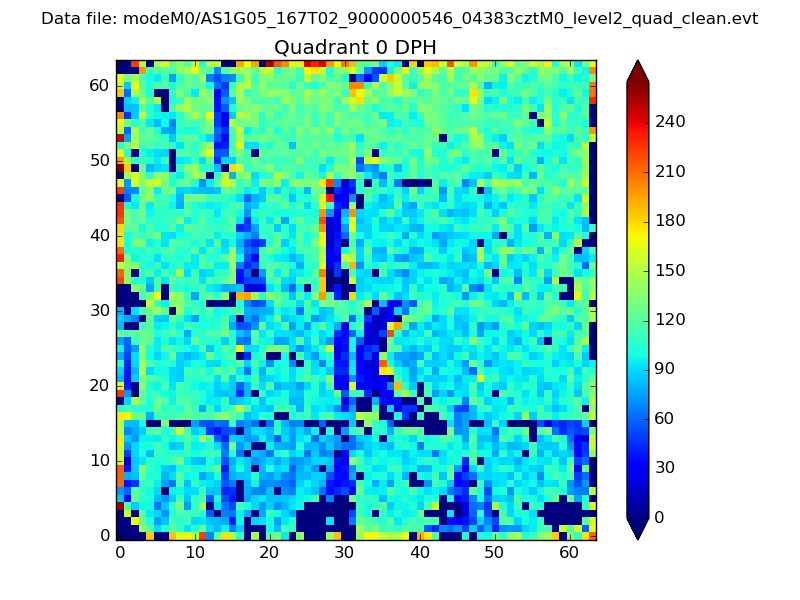 |
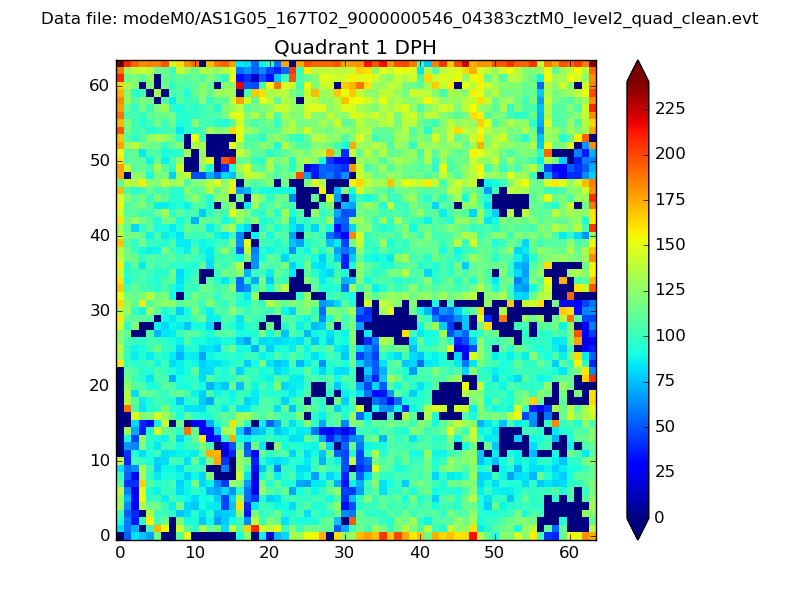 |
Quadrant B |
|---|---|---|---|
| Quadrant D | 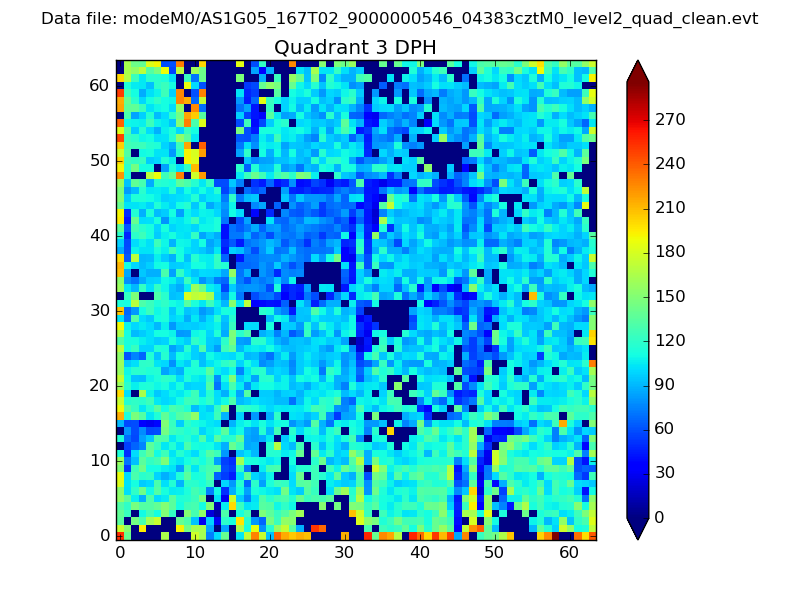 |
 |
Quadrant C |
| Plot type | Count rate plots | Images |
|---|---|---|
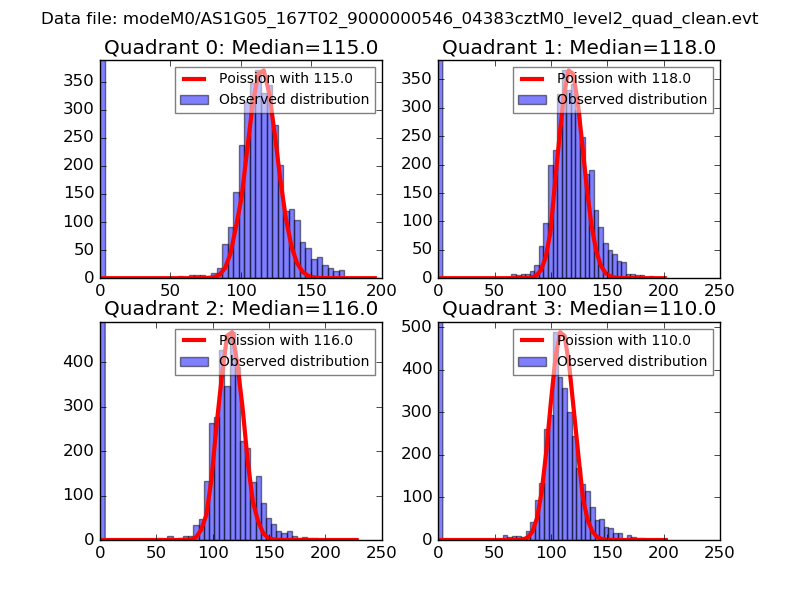
| Comparison with Poisson distribution Blue bars denote a histogram of data divided into 1 sec bins. Red curve is a Poisson curve with rate = median count rate of data. |
 |
 |
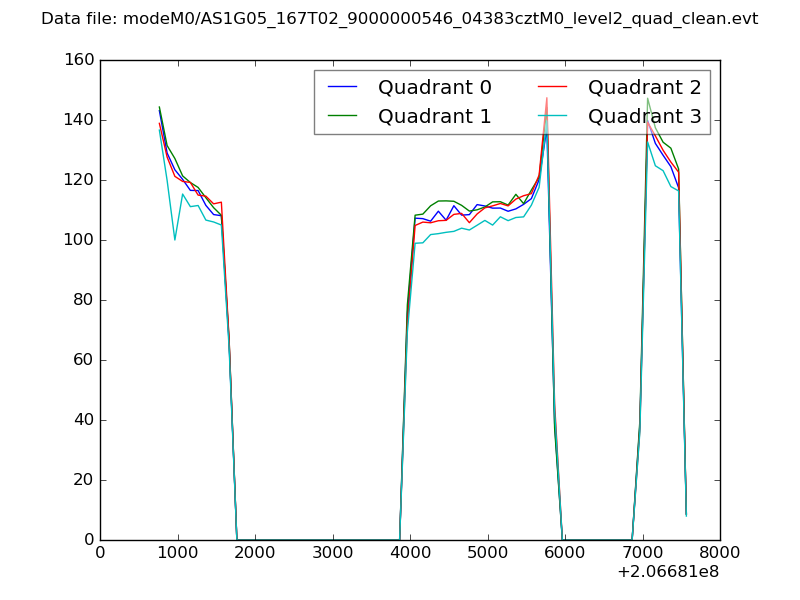
| Quadrant-wise count rates Data is divided into 100 sec bins |
 |
|
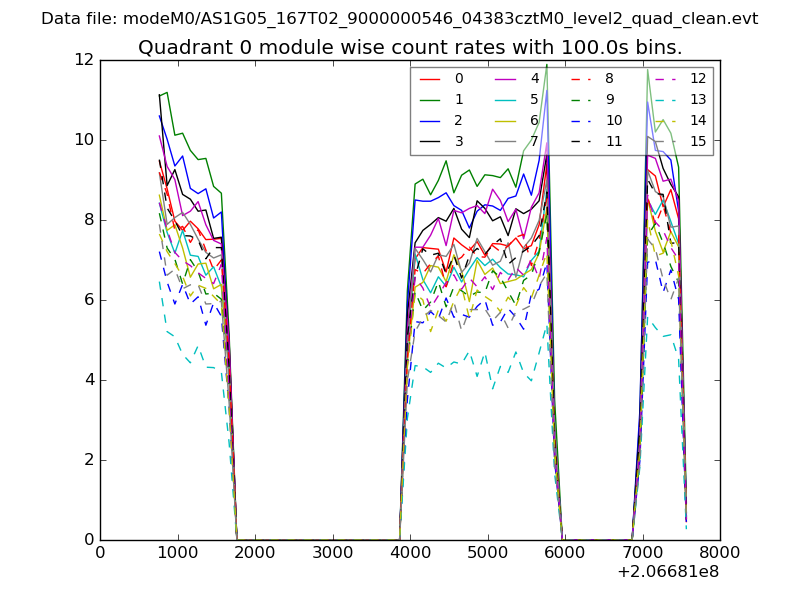
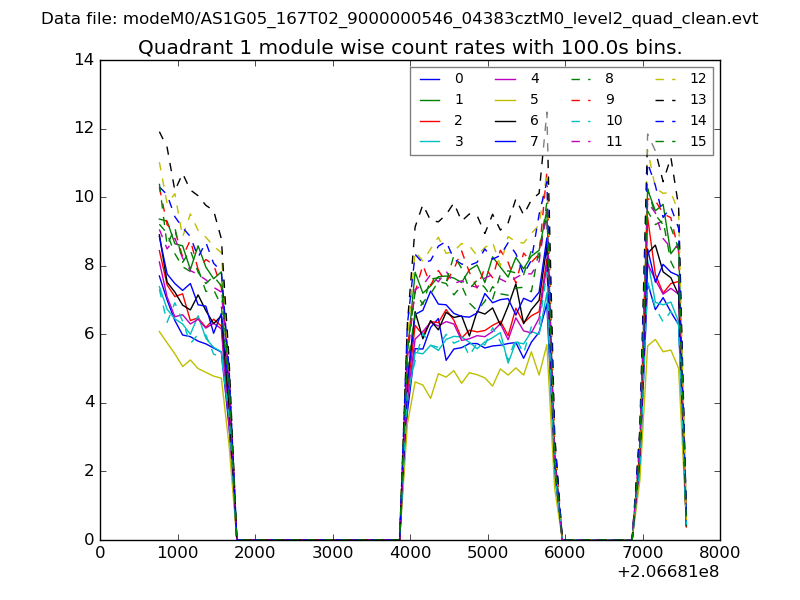
| Module-wise count rates for Quadrant A Data is divided into 100 sec bins |
 |
 |
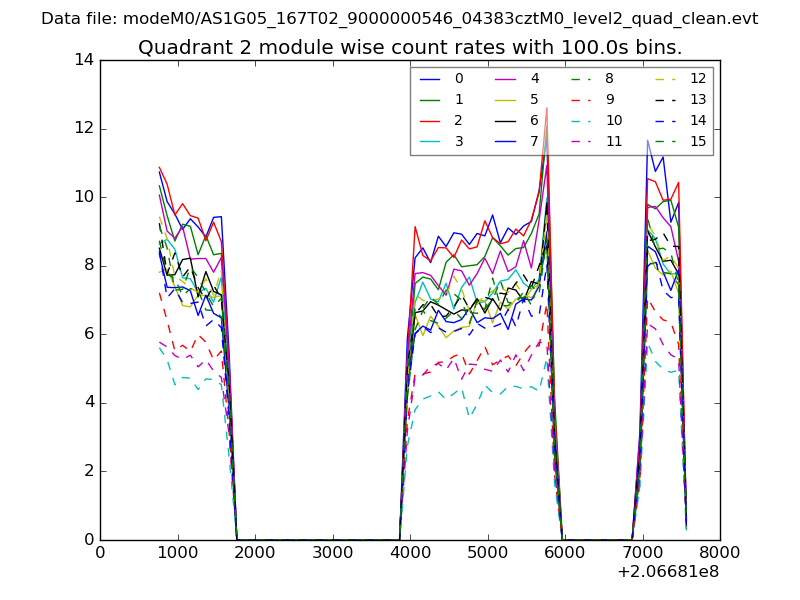
| Module-wise count rates for Quadrant B Data is divided into 100 sec bins |
 |
 |
| Module-wise count rates for Quadrant C Data is divided into 100 sec bins |
 |
 |
| Module-wise count rates for Quadrant D Data is divided into 100 sec bins |
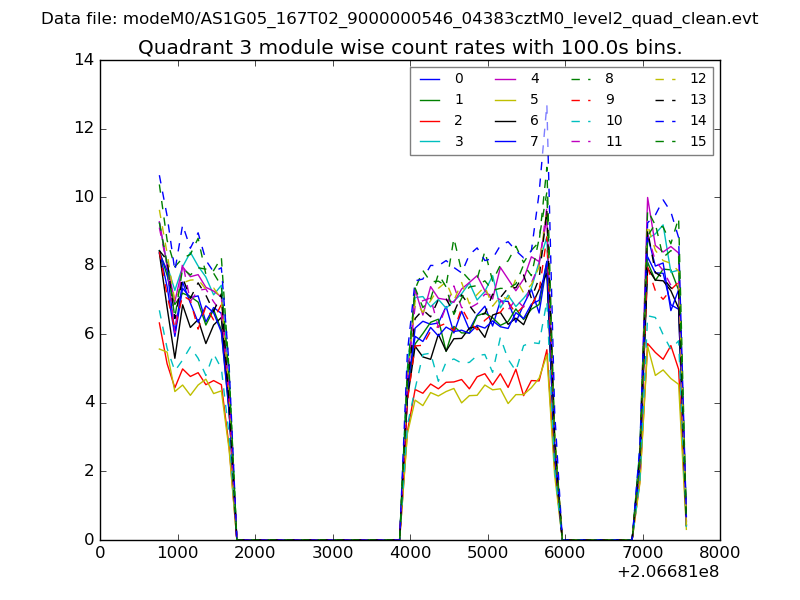 |
 |
| Parameter | Plot |
|---|---|
| CZT HV Monitor | 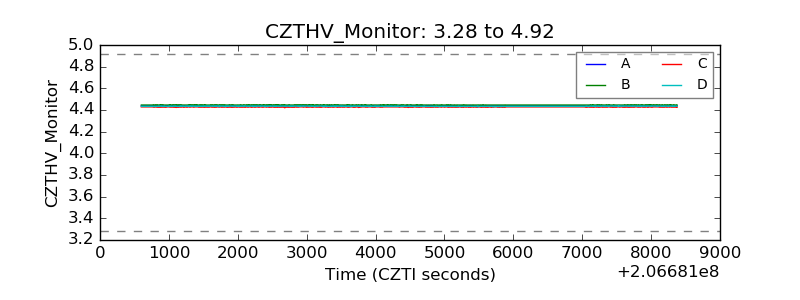 |
| D_VDD | 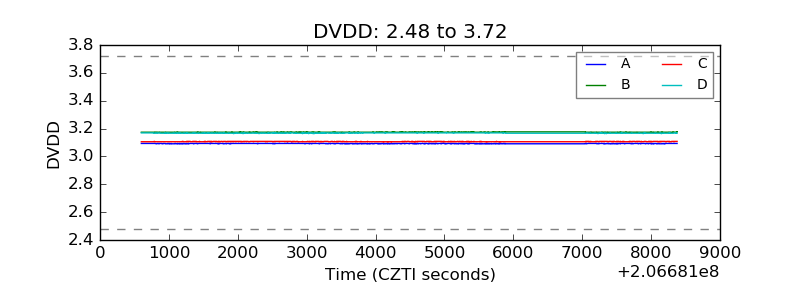 |
| Temperature 1 | 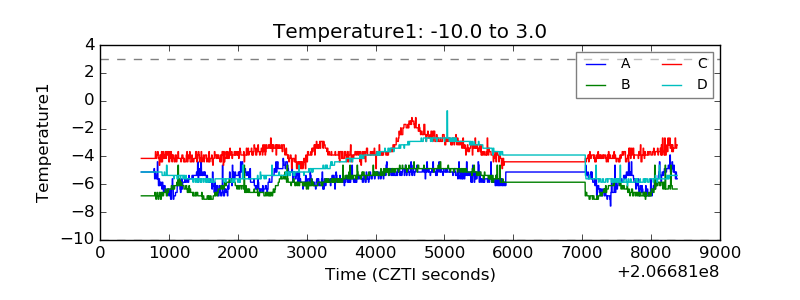 |
| Veto HV Monitor | 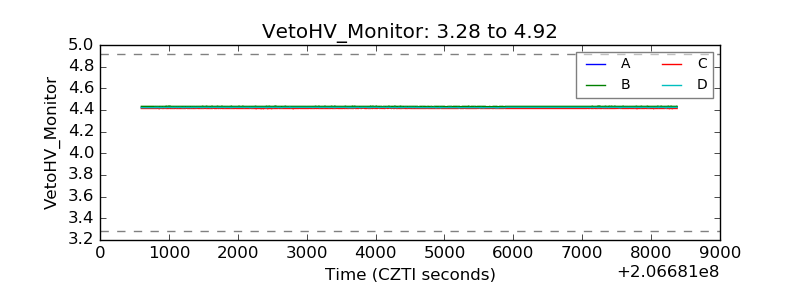 |
| Veto LLD | 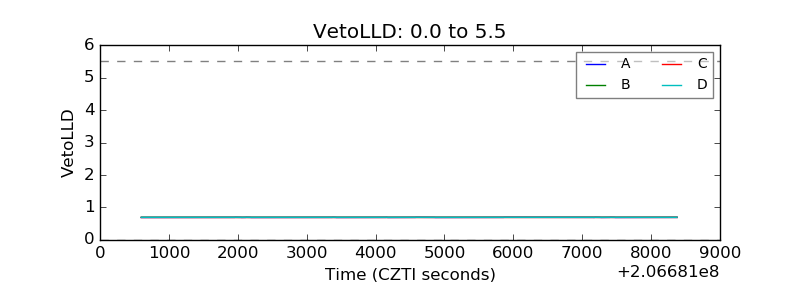 |
| Alpha Counter | 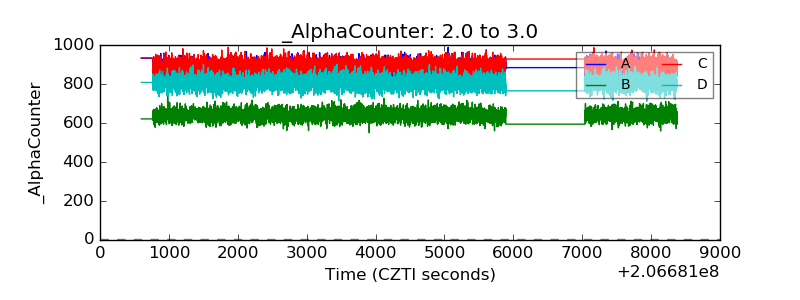 |
| _CPM_Rate | 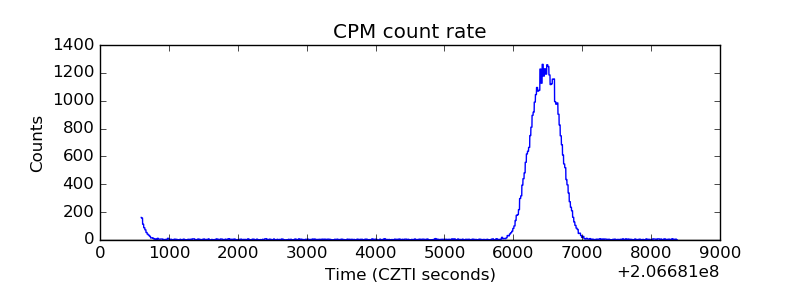 |
| CZT Counter | 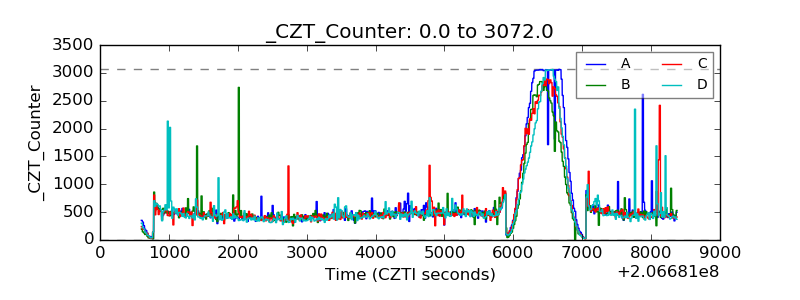 |
| +2.5 Volts monitor |  |
| +5 Volts monitor |  |
| _ROLL_ROT | 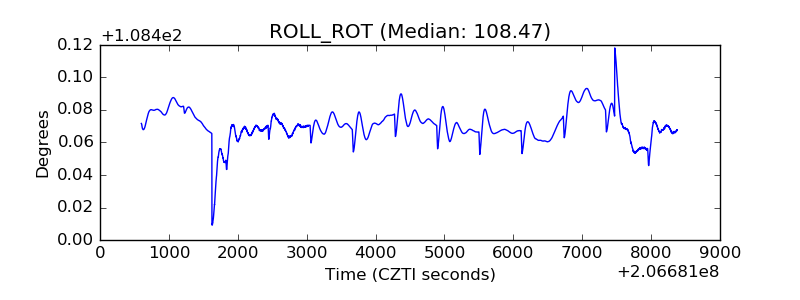 |
| _Roll_DEC | 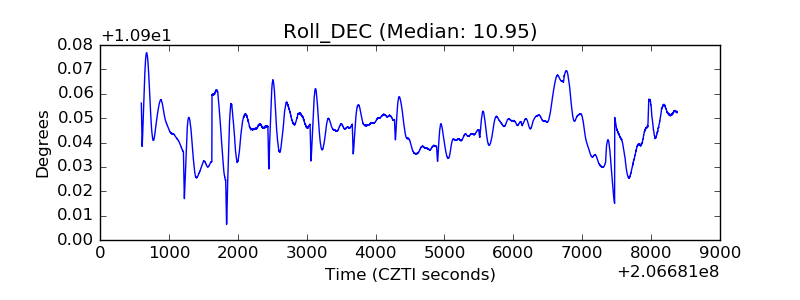 |
| _Roll_RA | 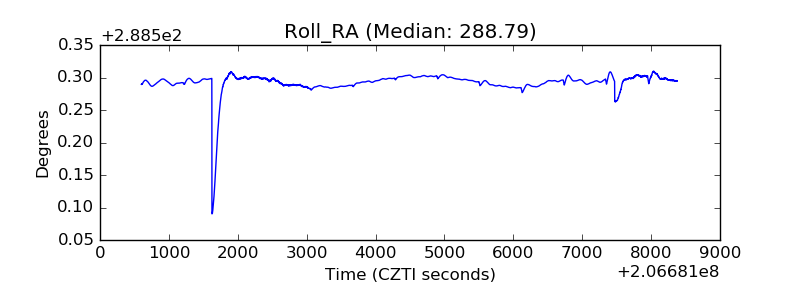 |
| Veto Counter | 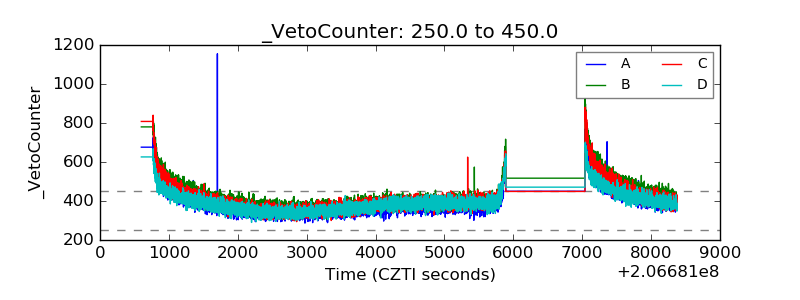 |