| Param | Original file | Final file |
|---|---|---|
| Filename | modeM0/AS1G05_167T02_9000000546_04386cztM0_level2.evt | modeM0/AS1G05_167T02_9000000546_04386cztM0_level2_quad_clean.evt |
| Size (bytes) | 254,376,000 | 42,747,840 |
| Size | 242.6 MB | 40.8 MB |
| Events in quadrant A | 1,933,419 | 259,156 |
| Events in quadrant B | 1,768,985 | 265,538 |
| Events in quadrant C | 1,865,660 | 257,775 |
| Events in quadrant D | 1,877,485 | 244,654 |
| Mode SS | |||
|---|---|---|---|
| Quadrant | BADHDUFLAG | Total packets | Discarded packets |
| A | 0 | 76 | 0 |
| B | 0 | 76 | 0 |
| C | 0 | 76 | 0 |
| D | 0 | 76 | 0 |
| Mode M0 | |||
|---|---|---|---|
| Quadrant | BADHDUFLAG | Total packets | Discarded packets |
| A | 0 | 8090 | 0 |
| B | 0 | 7609 | 0 |
| C | 0 | 8004 | 0 |
| D | 0 | 8198 | 0 |
| Quadrant | Total seconds | Saturated seconds | Saturation percentage |
|---|---|---|---|
| A | 3774 | 16 | 0.423953% |
| B | 3774 | 2 | 0.052994% |
| C | 3774 | 10 | 0.264971% |
| D | 3774 | 23 | 0.609433% |
Noise dominated data is calculated using 1-second bins in cleaned event files. If a bin has >2000 counts, and if more than 50% of those come from <1% of pixels, then it is considered to be noise-dominated and hence unusable.
| Quadrant | # 1 sec bins | Bins with >0 counts | Bins with >2000 counts | High rate bins dominated by noise | Noise dominated (total time) | Noise dominated (detector-on time) | Marked lightcurve |
|---|---|---|---|---|---|---|---|
| A | 3774 | 3774 | 12 | 12 | 0.32% | 0.32% | 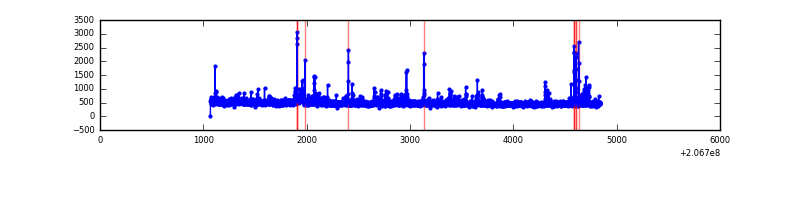 |
| B | 3774 | 3774 | 0 | 0 | 0.00% | 0.00% | 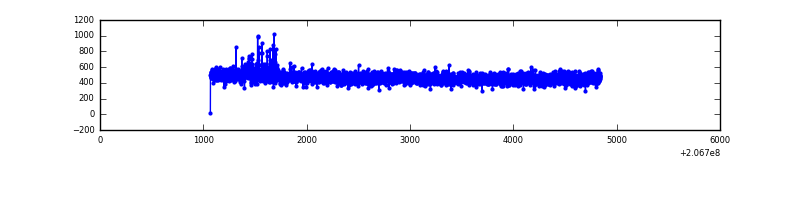 |
| C | 3774 | 3774 | 11 | 11 | 0.29% | 0.29% | 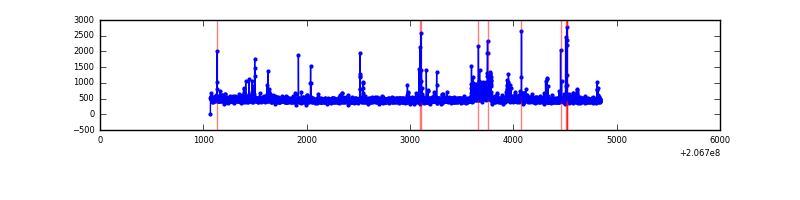 |
| D | 3774 | 3774 | 21 | 21 | 0.56% | 0.56% | 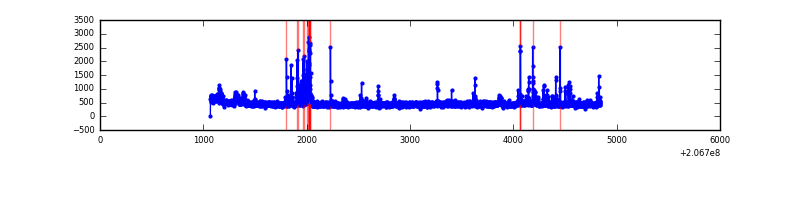 |
Top three noisy pixels from each quadrant. If the there are fewer than three noisy pixels in the level2.evt file, extra rows are filled as -1
| Pixel properties | Quadrant properties | ||||||
|---|---|---|---|---|---|---|---|
| Quadrant | DetID | PixID | Counts | Sigma | Mean | Median | Sigma |
| A | 13 | 251 | 140943 | 1531.05 | 449 | 441 | 91.8 |
| A | 15 | 234 | 43807 | 472.56 | 449 | 441 | 91.8 |
| A | 13 | 14 | 20526 | 218.87 | 449 | 441 | 91.8 |
| B | 0 | 228 | 12065 | 133.85 | 453 | 443 | 86.8 |
| B | 14 | 167 | 9193 | 100.77 | 453 | 443 | 86.8 |
| B | 12 | 111 | 8177 | 89.07 | 453 | 443 | 86.8 |
| C | 14 | 48 | 110666 | 1079.32 | 434 | 436 | 102.1 |
| C | 9 | 247 | 48532 | 470.93 | 434 | 436 | 102.1 |
| C | 12 | 4 | 5871 | 53.22 | 434 | 436 | 102.1 |
| D | 13 | 239 | 110116 | 1037.96 | 432 | 419 | 105.7 |
| D | 2 | 63 | 67126 | 631.18 | 432 | 419 | 105.7 |
| D | 13 | 238 | 57176 | 537.04 | 432 | 419 | 105.7 |
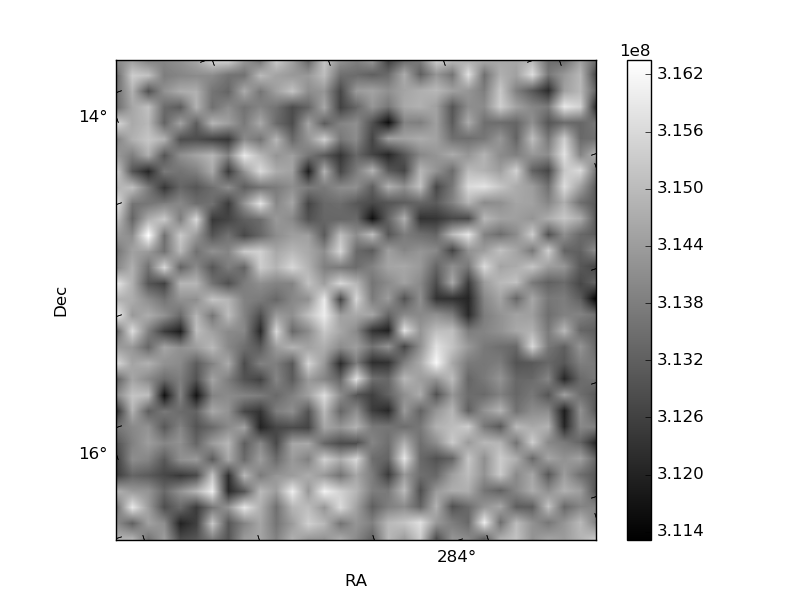
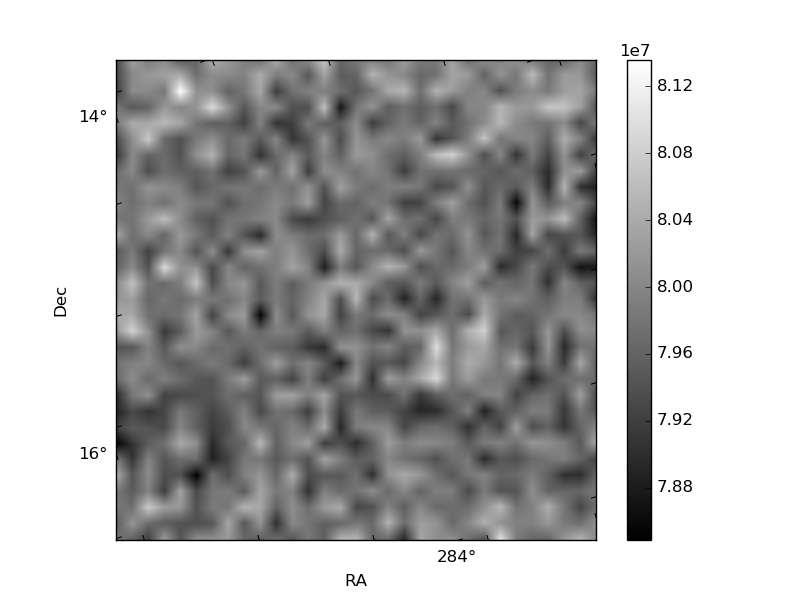
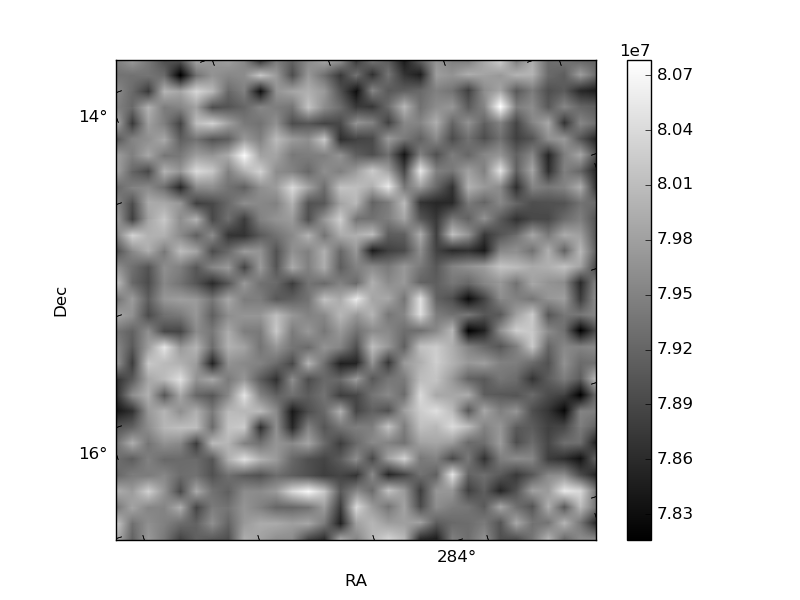
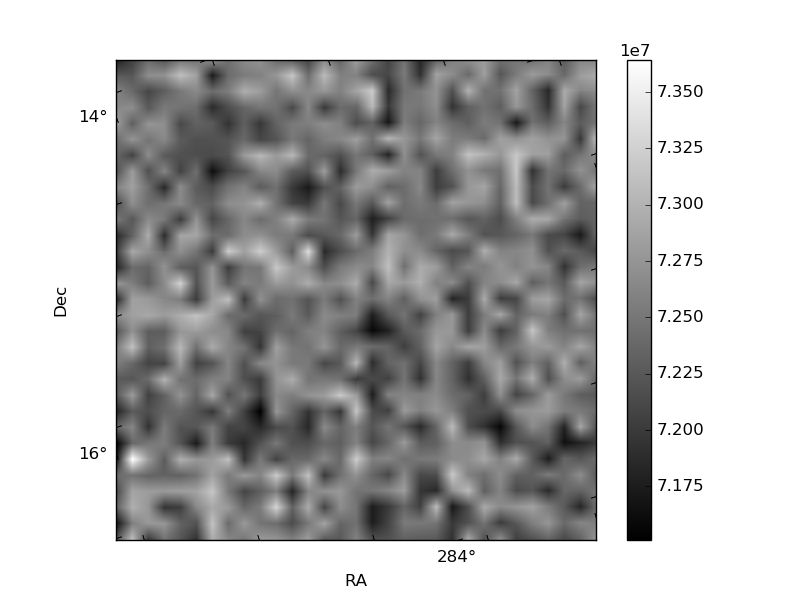
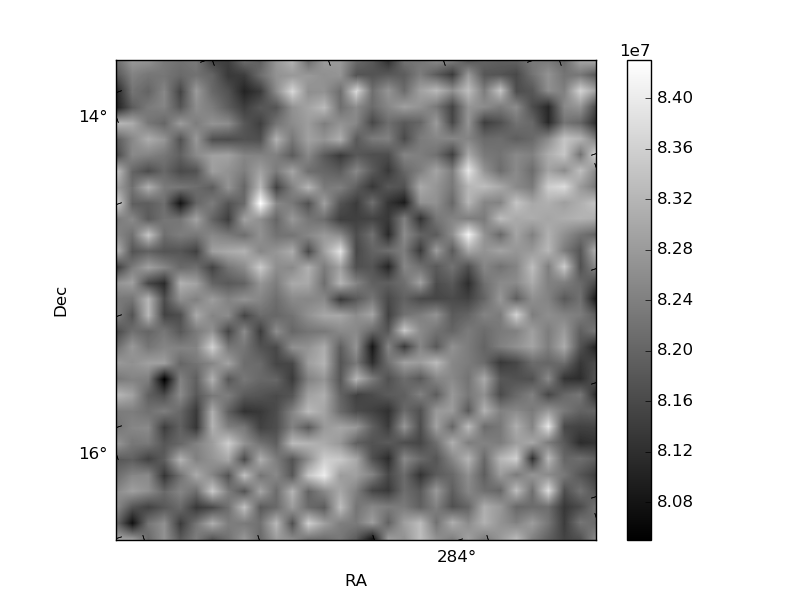
Histogram calculated using DETX and DETY for each event in the final _common_clean file
| Quadrant A | 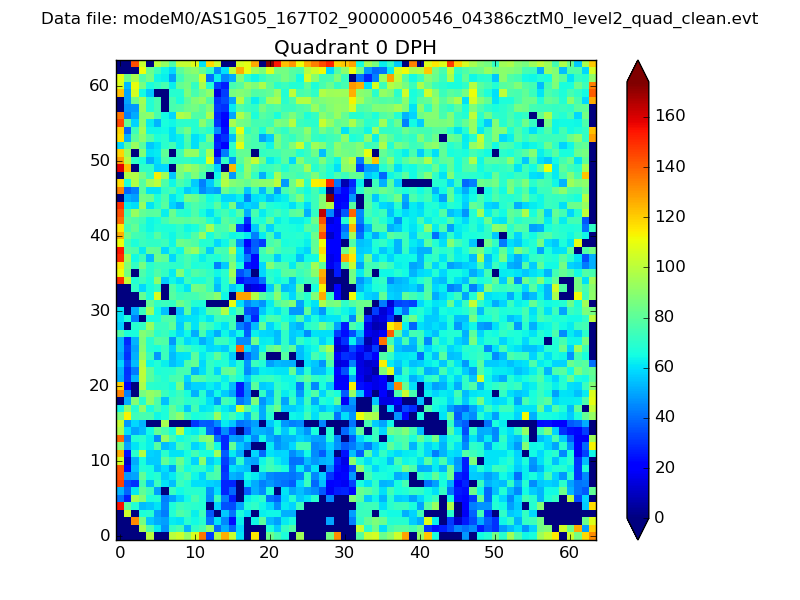 |
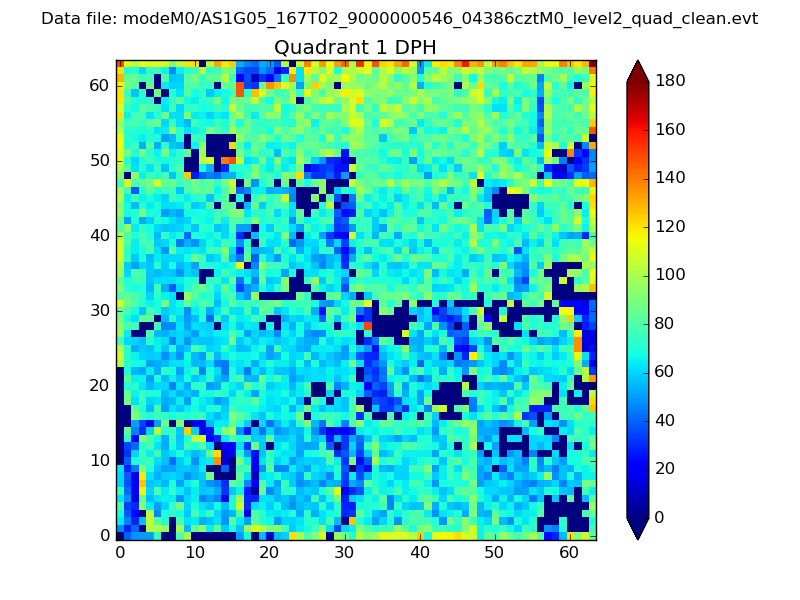 |
Quadrant B |
|---|---|---|---|
| Quadrant D | 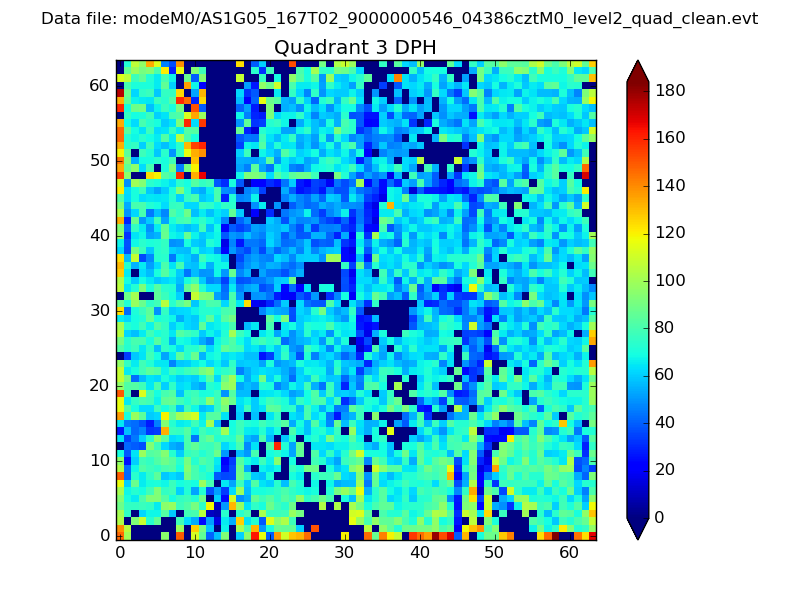 |
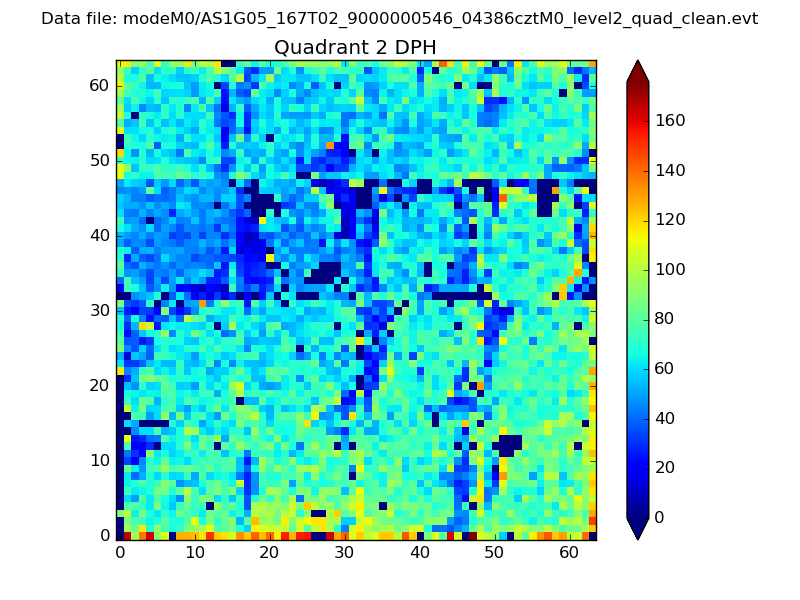 |
Quadrant C |
| Plot type | Count rate plots | Images |
|---|---|---|
| Comparison with Poisson distribution Blue bars denote a histogram of data divided into 1 sec bins. Red curve is a Poisson curve with rate = median count rate of data. |
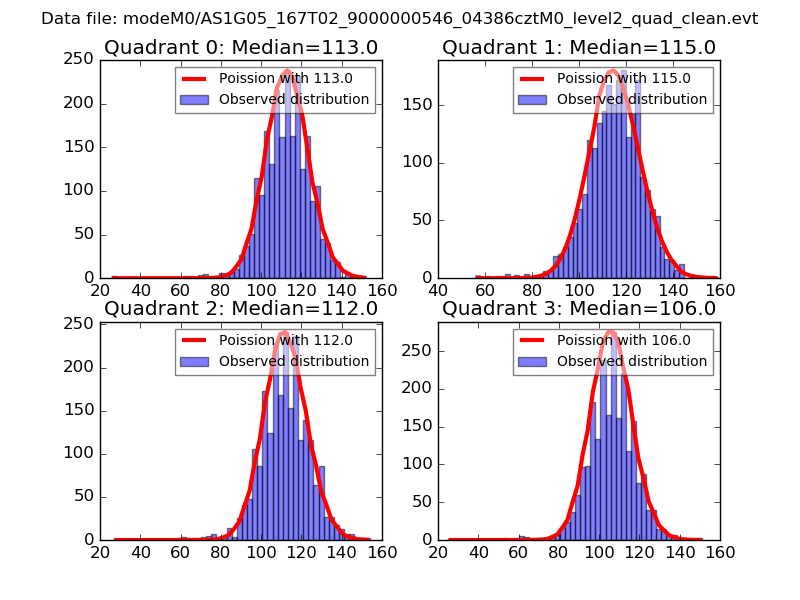 |
 |
| Quadrant-wise count rates Data is divided into 100 sec bins |
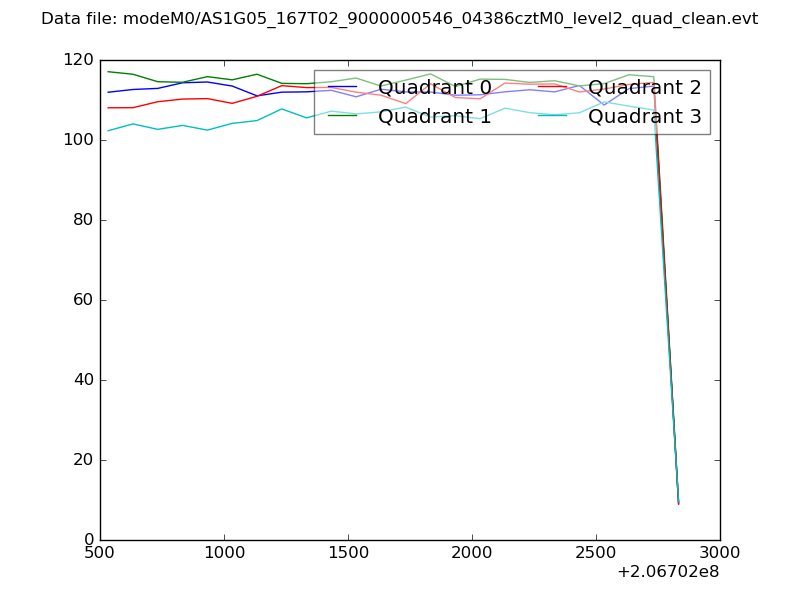 |
|
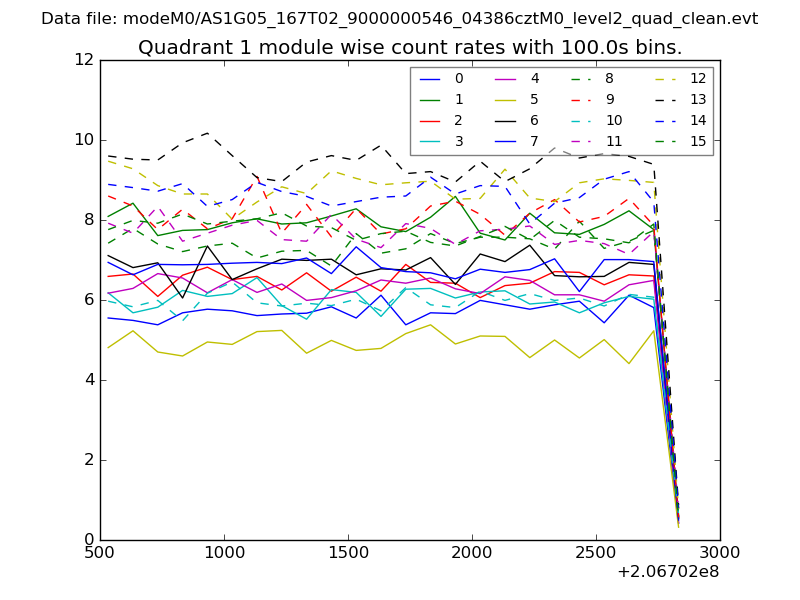
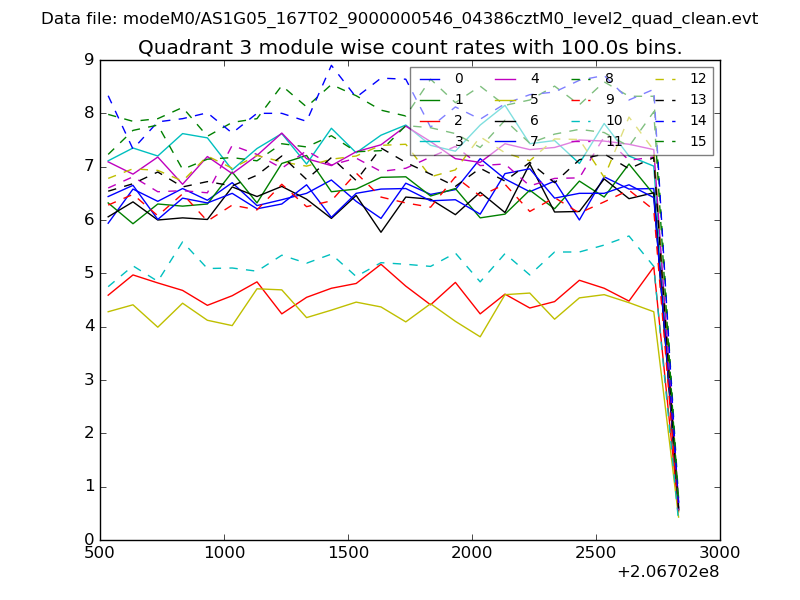
| Module-wise count rates for Quadrant A Data is divided into 100 sec bins |
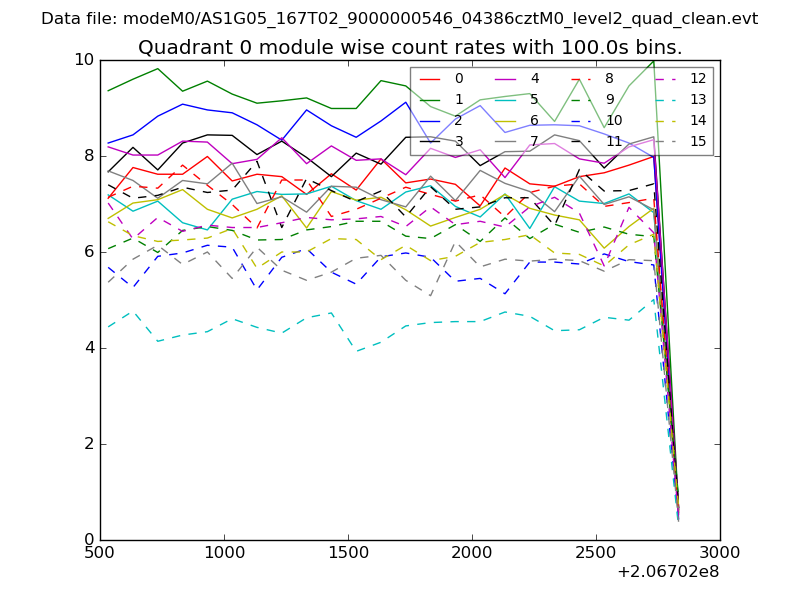 |
 |
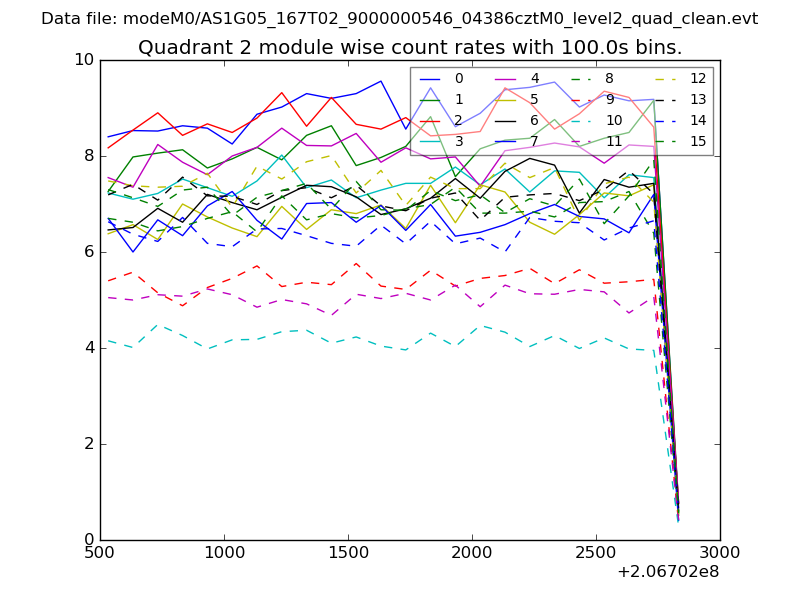
| Module-wise count rates for Quadrant B Data is divided into 100 sec bins |
 |
 |
| Module-wise count rates for Quadrant C Data is divided into 100 sec bins |
 |
 |
| Module-wise count rates for Quadrant D Data is divided into 100 sec bins |
 |
 |
| Parameter | Plot |
|---|---|
| CZT HV Monitor | 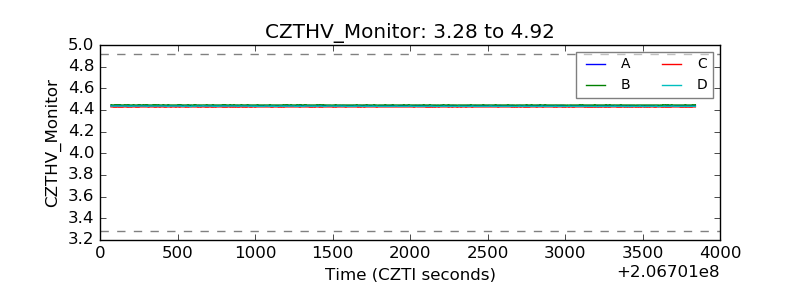 |
| D_VDD | 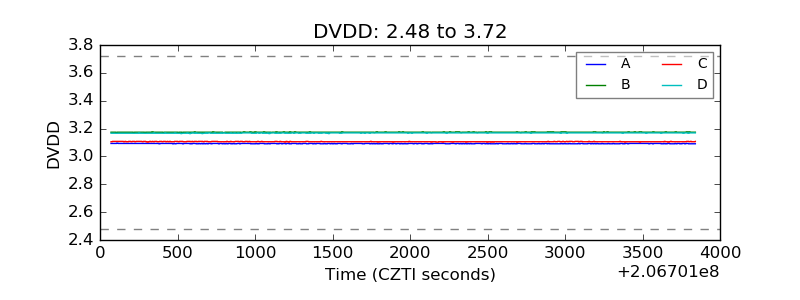 |
| Temperature 1 | 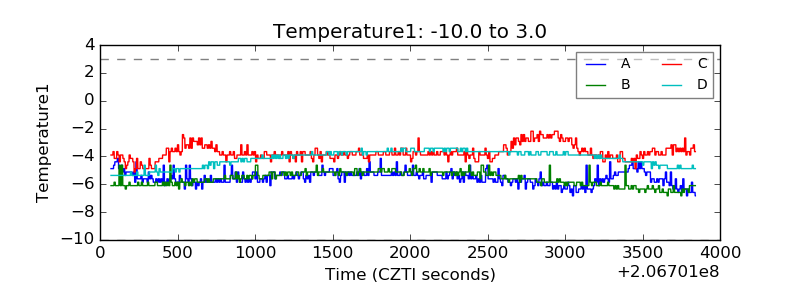 |
| Veto HV Monitor | 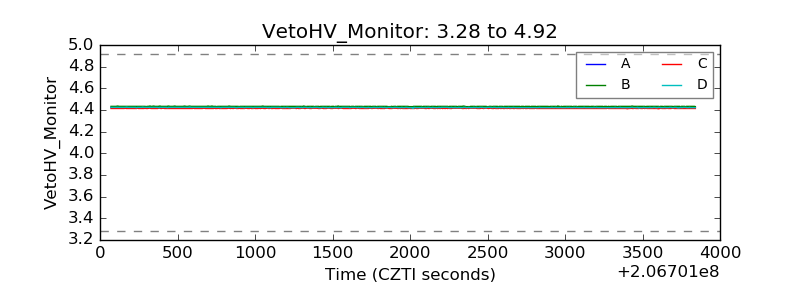 |
| Veto LLD | 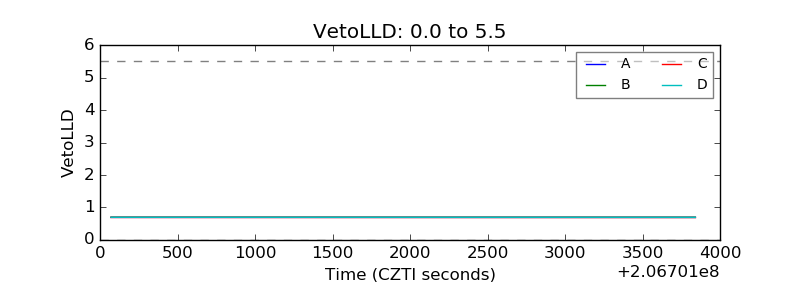 |
| Alpha Counter | 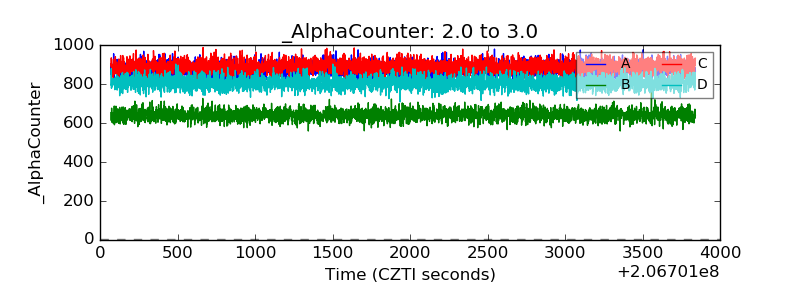 |
| _CPM_Rate | 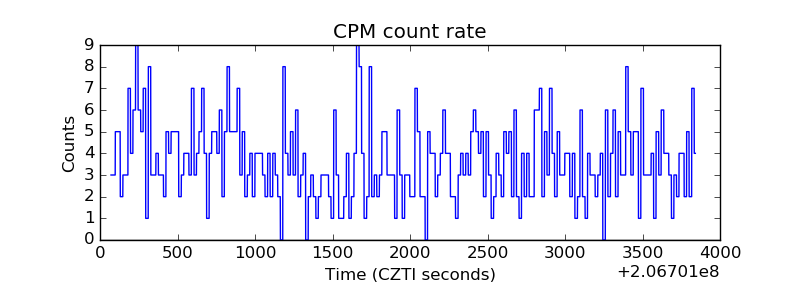 |
| CZT Counter | 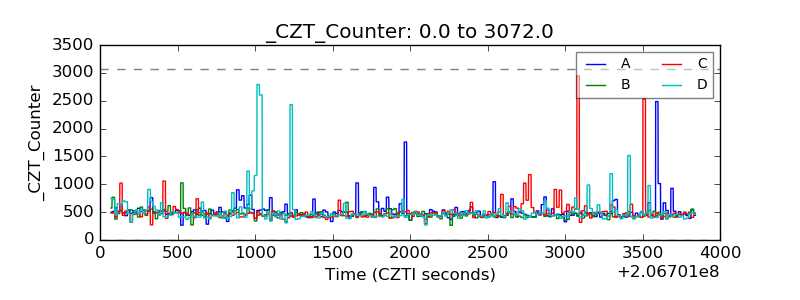 |
| +2.5 Volts monitor |  |
| +5 Volts monitor |  |
| _ROLL_ROT | 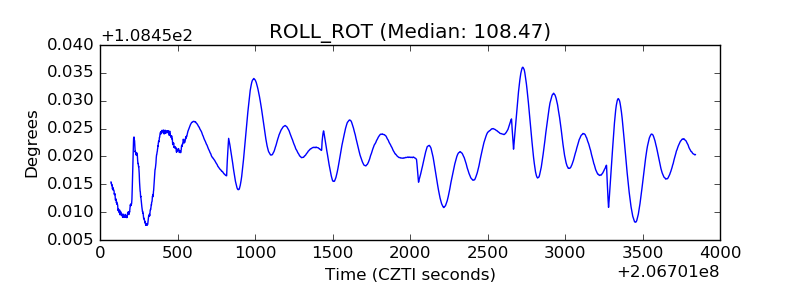 |
| _Roll_DEC | 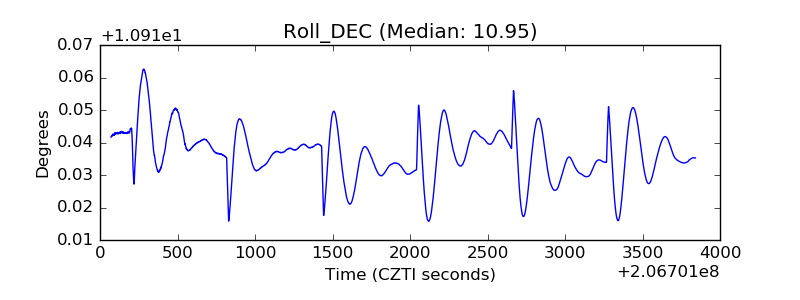 |
| _Roll_RA | 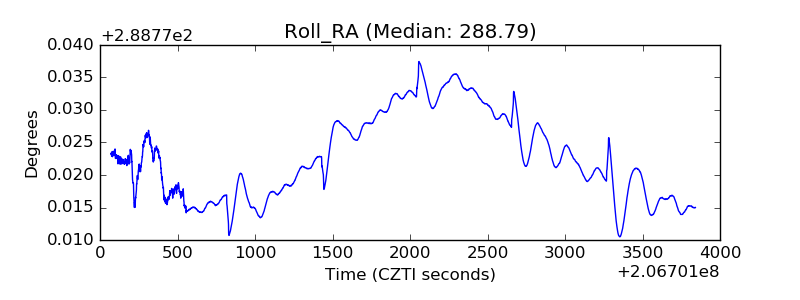 |
| Veto Counter | 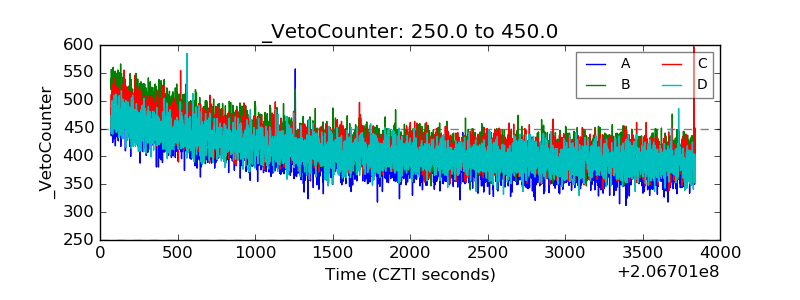 |