| Param | Original file | Final file |
|---|---|---|
| Filename | modeM0/AS1G05_230T02_9000000548cztM0_level2.fits | modeM0/AS1G05_230T02_9000000548cztM0_level2_quad_clean.evt |
| Size (bytes) | 1,000,558,080 | 1,143,722,880 |
| Size | 954.2 MB | 1.1 GB |
| Events in quadrant A | 5,971,996 | 7,047,421 |
| Events in quadrant B | 5,719,546 | 6,947,937 |
| Events in quadrant C | 5,852,252 | 6,729,348 |
| Events in quadrant D | 5,077,718 | 6,237,370 |
| Mode M9 | |||
|---|---|---|---|
| Quadrant | BADHDUFLAG | Total packets | Discarded packets |
| A | 0 | 153 | 0 |
| B | 0 | 152 | 0 |
| C | 0 | 152 | 0 |
| D | 0 | 153 | 0 |
| Mode SS | |||
|---|---|---|---|
| Quadrant | BADHDUFLAG | Total packets | Discarded packets |
| A | 0 | 2286 | 0 |
| B | 0 | 2286 | 0 |
| C | 0 | 2286 | 0 |
| D | 0 | 2286 | 0 |
| Mode M0 | |||
|---|---|---|---|
| Quadrant | BADHDUFLAG | Total packets | Discarded packets |
| A | 0 | 230897 | 0 |
| B | 0 | 245773 | 0 |
| C | 0 | 241630 | 0 |
| D | 0 | 259342 | 0 |
| Quadrant | Total seconds | Saturated seconds | Saturation percentage |
|---|---|---|---|
| A | 112032 | 1347 | 1.202335% |
| B | 112034 | 2148 | 1.917275% |
| C | 112033 | 1554 | 1.387091% |
| D | 112033 | 2146 | 1.915507% |
Noise dominated data is calculated using 1-second bins in cleaned event files. If a bin has >2000 counts, and if more than 50% of those come from <1% of pixels, then it is considered to be noise-dominated and hence unusable.
| Quadrant | # 1 sec bins | Bins with >0 counts | Bins with >2000 counts | High rate bins dominated by noise | Noise dominated (total time) | Noise dominated (detector-on time) | Marked lightcurve |
|---|---|---|---|---|---|---|---|
| A | 127103 | 112020 | 0 | 0 | 0.00% | 0.00% |  |
| B | 127103 | 112022 | 0 | 0 | 0.00% | 0.00% | 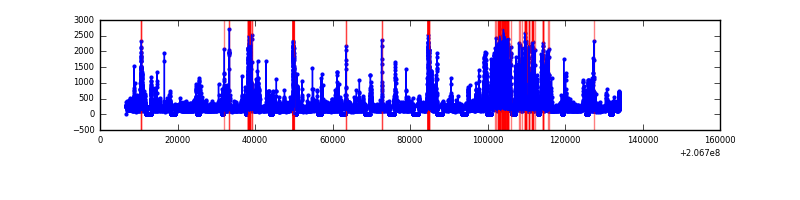 |
| C | 127102 | 112020 | 0 | 0 | 0.00% | 0.00% | 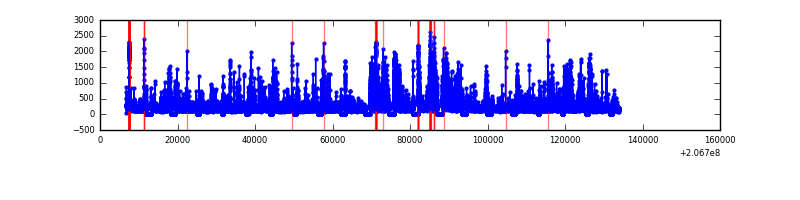 |
| D | 127102 | 112019 | 0 | 0 | 0.00% | 0.00% |  |
Top three noisy pixels from each quadrant. If the there are fewer than three noisy pixels in the level2.evt file, extra rows are filled as -1
| Pixel properties | Quadrant properties | ||||||
|---|---|---|---|---|---|---|---|
| Quadrant | DetID | PixID | Counts | Sigma | Mean | Median | Sigma |
| A | 14 | 188 | 5892 | 11.31 | 1550 | 1444 | 393.5 |
| A | 0 | 29 | 5824 | 11.13 | 1550 | 1444 | 393.5 |
| A | 14 | 204 | 5049 | 9.16 | 1550 | 1444 | 393.5 |
| B | 2 | 9 | 5012 | 11.66 | 1512 | 1438 | 306.5 |
| B | 12 | 226 | 4144 | 8.83 | 1512 | 1438 | 306.5 |
| B | 14 | 254 | 3922 | 8.1 | 1512 | 1438 | 306.5 |
| C | 1 | 80 | 4232 | 6.85 | 1545 | 1432 | 408.9 |
| C | 1 | 81 | 4198 | 6.76 | 1545 | 1432 | 408.9 |
| C | 12 | 241 | 4155 | 6.66 | 1545 | 1432 | 408.9 |
| D | 11 | 82 | 4305 | 7.58 | 1449 | 1313 | 394.6 |
| D | 6 | 231 | 3922 | 6.61 | 1449 | 1313 | 394.6 |
| D | 3 | 14 | 3918 | 6.6 | 1449 | 1313 | 394.6 |
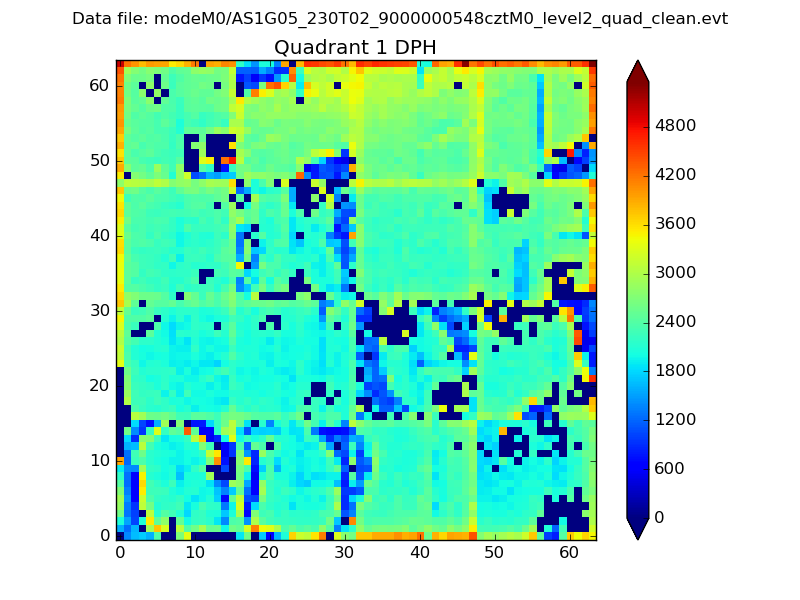
Histogram calculated using DETX and DETY for each event in the final _common_clean file
| Quadrant A |  |
 |
Quadrant B |
|---|---|---|---|
| Quadrant D |  |
 |
Quadrant C |
| Plot type | Count rate plots | Images |
|---|---|---|
| Comparison with Poisson distribution Blue bars denote a histogram of data divided into 1 sec bins. Red curve is a Poisson curve with rate = median count rate of data. |
 |
 |
| Quadrant-wise count rates Data is divided into 100 sec bins |
 |
|
| Module-wise count rates for Quadrant A Data is divided into 100 sec bins |
 |
 |
| Module-wise count rates for Quadrant B Data is divided into 100 sec bins |
 |
 |
| Module-wise count rates for Quadrant C Data is divided into 100 sec bins |
 |
 |
| Module-wise count rates for Quadrant D Data is divided into 100 sec bins |
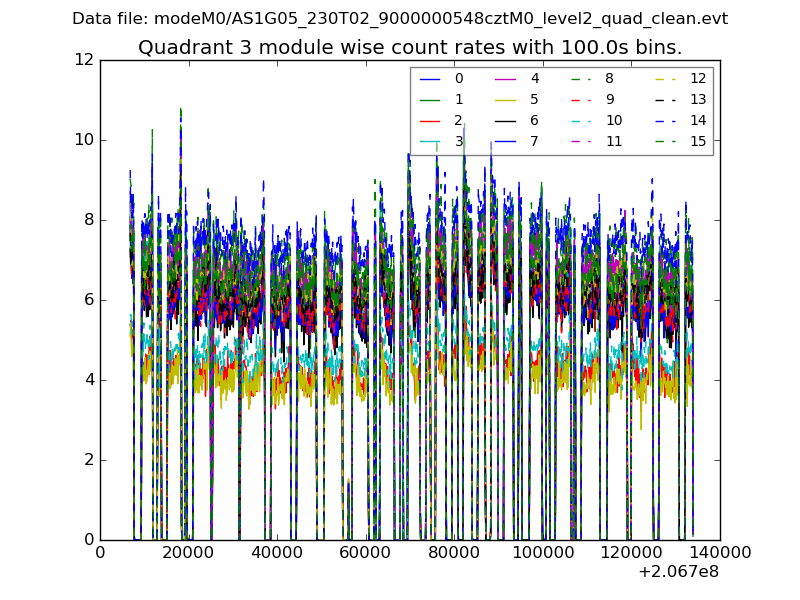 |
 |
| Parameter | Plot |
|---|---|
| CZT HV Monitor | 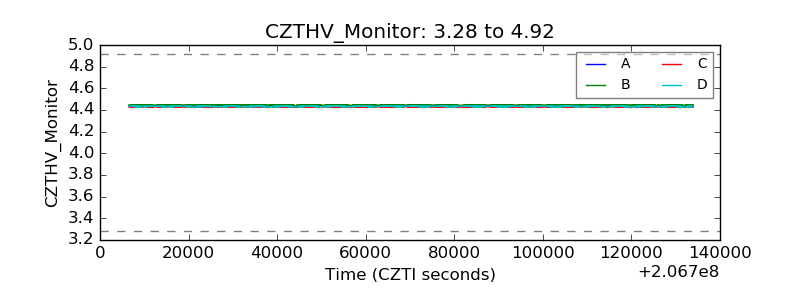 |
| D_VDD |  |
| Temperature 1 |  |
| Veto HV Monitor | 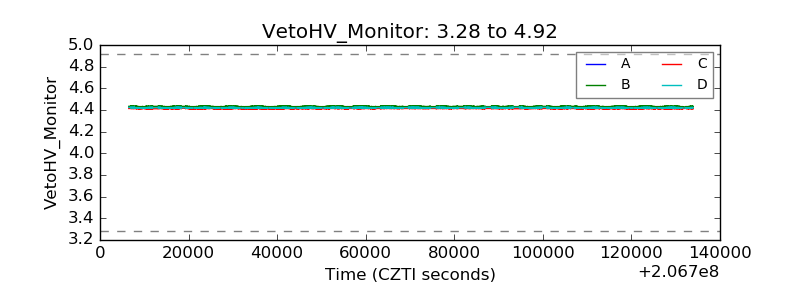 |
| Veto LLD |  |
| Alpha Counter |  |
| _CPM_Rate |  |
| CZT Counter | 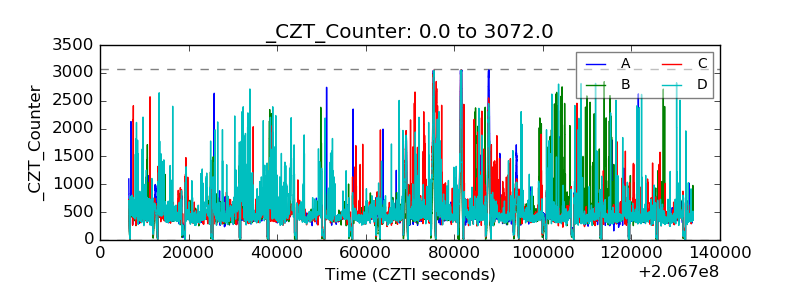 |
| +2.5 Volts monitor |  |
| +5 Volts monitor | 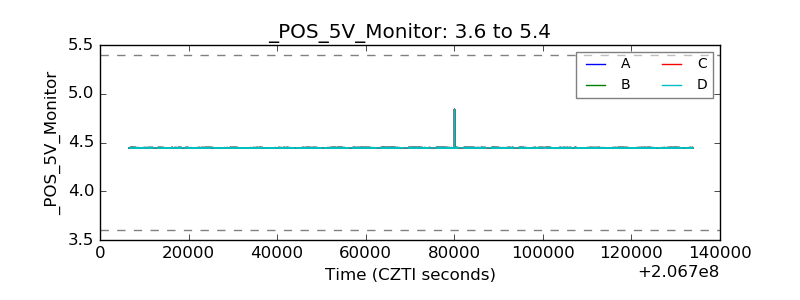 |
| _ROLL_ROT |  |
| _Roll_DEC |  |
| _Roll_RA |  |
| Veto Counter |  |