| Param | Original file | Final file |
|---|---|---|
| Filename | modeM0/AS1G05_230T02_9000000548_04387cztM0_level2.evt | modeM0/AS1G05_230T02_9000000548_04387cztM0_level2_quad_clean.evt |
| Size (bytes) | 405,783,360 | 66,029,760 |
| Size | 387.0 MB | 63.0 MB |
| Events in quadrant A | 2,736,674 | 404,910 |
| Events in quadrant B | 2,933,524 | 400,332 |
| Events in quadrant C | 2,676,680 | 397,492 |
| Events in quadrant D | 3,539,626 | 382,902 |
| Mode M9 | |||
|---|---|---|---|
| Quadrant | BADHDUFLAG | Total packets | Discarded packets |
| A | 0 | 11 | 0 |
| B | 0 | 11 | 0 |
| C | 0 | 11 | 0 |
| D | 0 | 11 | 0 |
| Mode SS | |||
|---|---|---|---|
| Quadrant | BADHDUFLAG | Total packets | Discarded packets |
| A | 0 | 120 | 0 |
| B | 0 | 120 | 0 |
| C | 0 | 120 | 0 |
| D | 0 | 120 | 0 |
| Mode M0 | |||
|---|---|---|---|
| Quadrant | BADHDUFLAG | Total packets | Discarded packets |
| A | 0 | 12229 | 2 |
| B | 0 | 12750 | 1 |
| C | 0 | 12278 | 1 |
| D | 0 | 14610 | 1 |
| Quadrant | Total seconds | Saturated seconds | Saturation percentage |
|---|---|---|---|
| A | 5919 | 116 | 1.959791% |
| B | 5919 | 110 | 1.858422% |
| C | 5919 | 103 | 1.740159% |
| D | 5919 | 173 | 2.922791% |
Noise dominated data is calculated using 1-second bins in cleaned event files. If a bin has >2000 counts, and if more than 50% of those come from <1% of pixels, then it is considered to be noise-dominated and hence unusable.
| Quadrant | # 1 sec bins | Bins with >0 counts | Bins with >2000 counts | High rate bins dominated by noise | Noise dominated (total time) | Noise dominated (detector-on time) | Marked lightcurve |
|---|---|---|---|---|---|---|---|
| A | 7019 | 5920 | 6 | 6 | 0.09% | 0.10% | 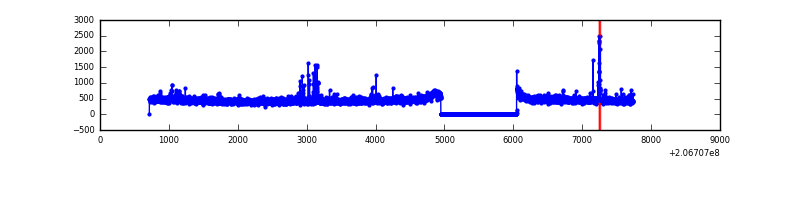 |
| B | 7019 | 5920 | 13 | 13 | 0.19% | 0.22% | 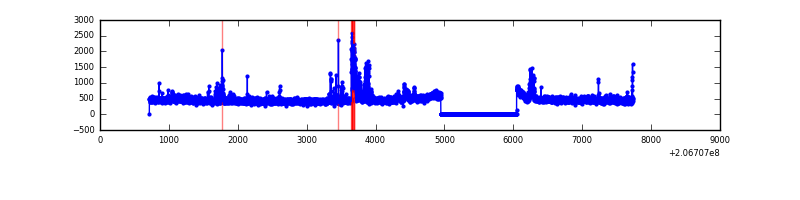 |
| C | 7019 | 5920 | 21 | 21 | 0.30% | 0.35% | 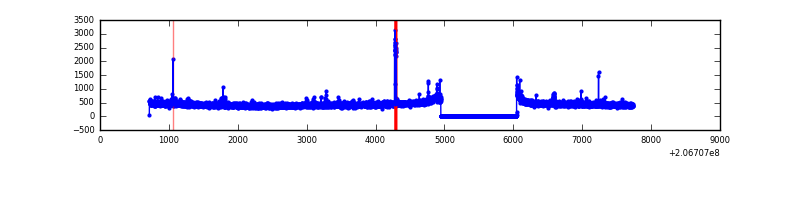 |
| D | 7019 | 5920 | 67 | 67 | 0.95% | 1.13% | 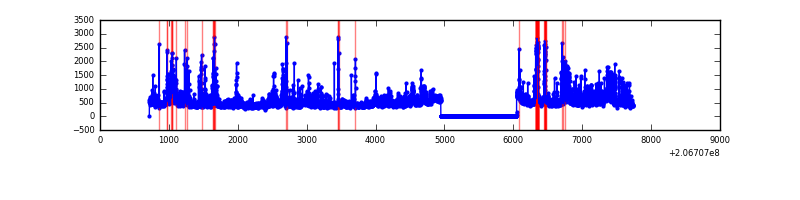 |
Top three noisy pixels from each quadrant. If the there are fewer than three noisy pixels in the level2.evt file, extra rows are filled as -1
| Pixel properties | Quadrant properties | ||||||
|---|---|---|---|---|---|---|---|
| Quadrant | DetID | PixID | Counts | Sigma | Mean | Median | Sigma |
| A | 15 | 234 | 38709 | 275.95 | 682 | 667 | 137.9 |
| A | 13 | 251 | 18877 | 132.09 | 682 | 667 | 137.9 |
| A | 8 | 15 | 12370 | 84.89 | 682 | 667 | 137.9 |
| B | 14 | 167 | 205763 | 1587.91 | 682 | 667 | 129.2 |
| B | 4 | 48 | 34323 | 260.57 | 682 | 667 | 129.2 |
| B | 15 | 54 | 12800 | 93.94 | 682 | 667 | 129.2 |
| C | 9 | 247 | 78144 | 509.11 | 657 | 658 | 152.2 |
| C | 14 | 48 | 22164 | 141.3 | 657 | 658 | 152.2 |
| C | 9 | 16 | 8079 | 48.76 | 657 | 658 | 152.2 |
| D | 2 | 63 | 362759 | 2318.95 | 657 | 638 | 156.2 |
| D | 12 | 233 | 185562 | 1184.22 | 657 | 638 | 156.2 |
| D | 13 | 223 | 135022 | 860.57 | 657 | 638 | 156.2 |
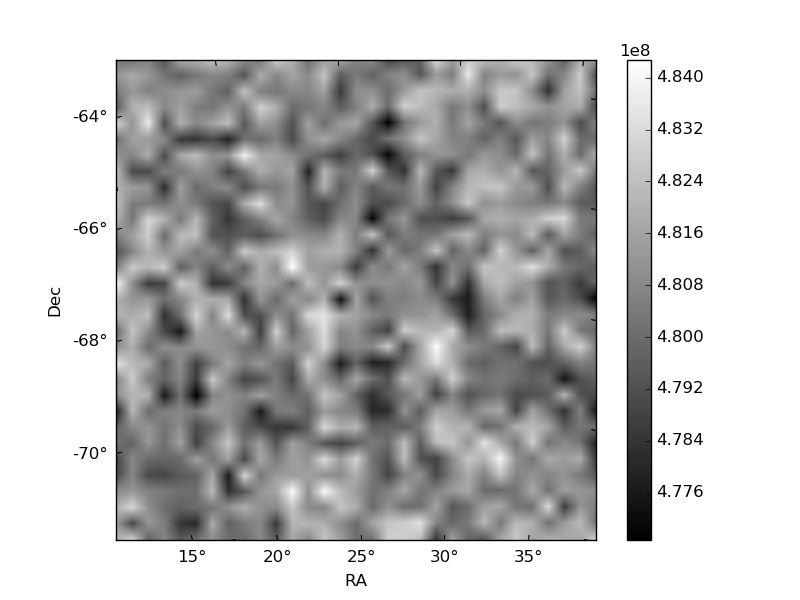
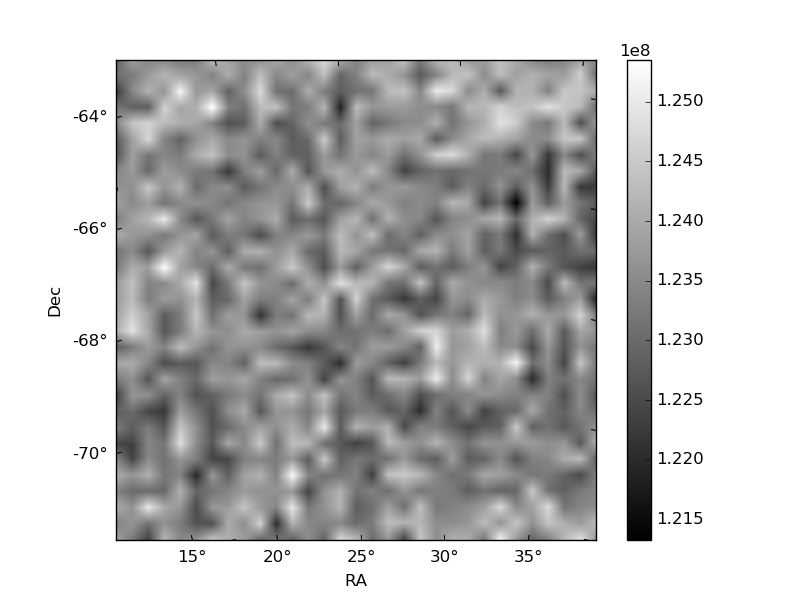
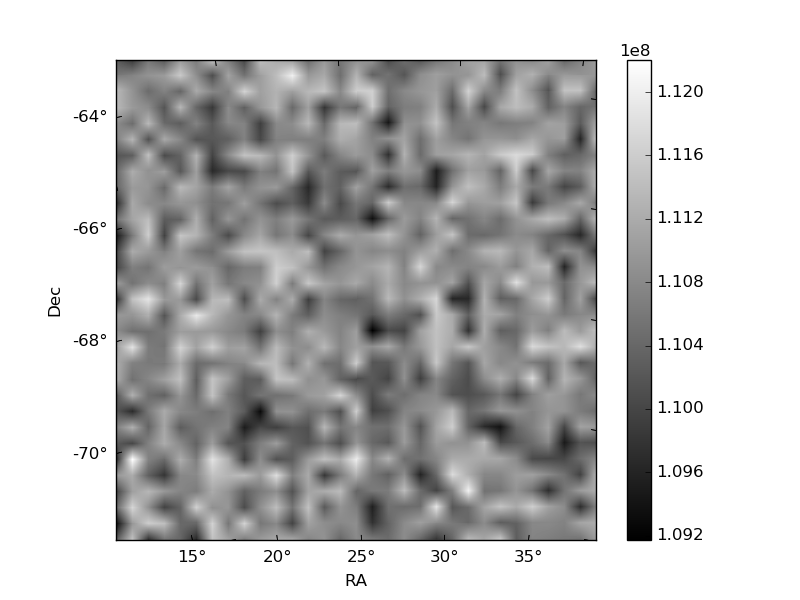
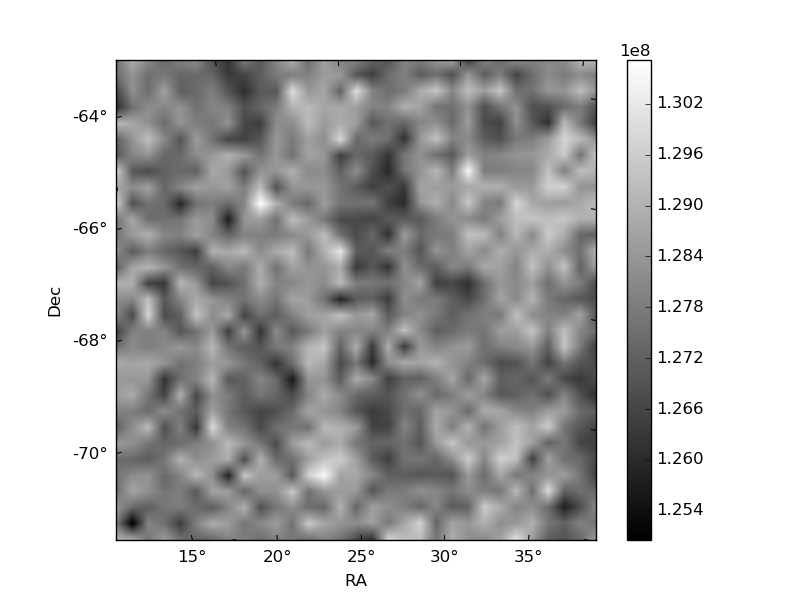
Histogram calculated using DETX and DETY for each event in the final _common_clean file
| Quadrant A | 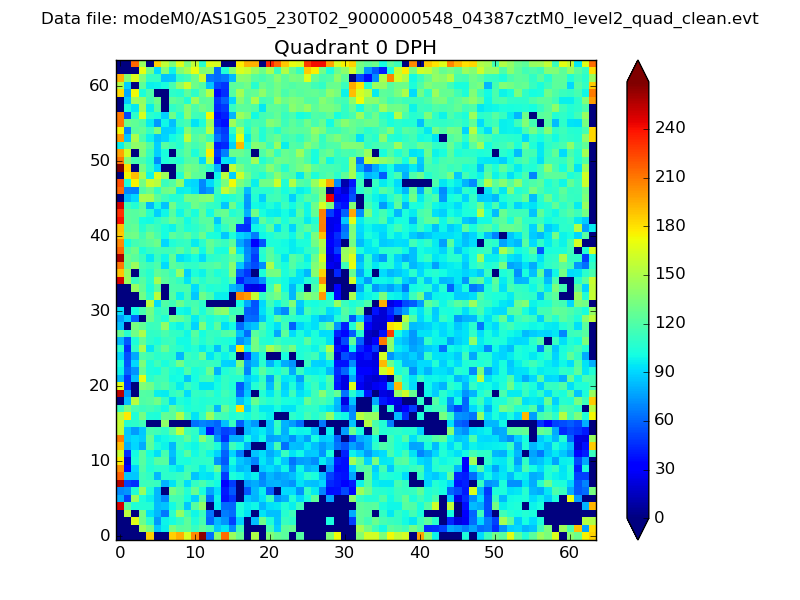 |
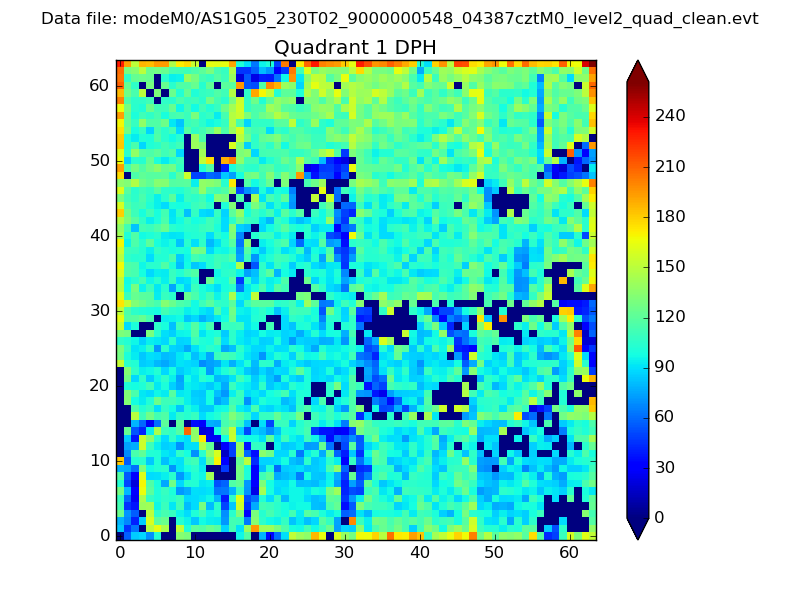 |
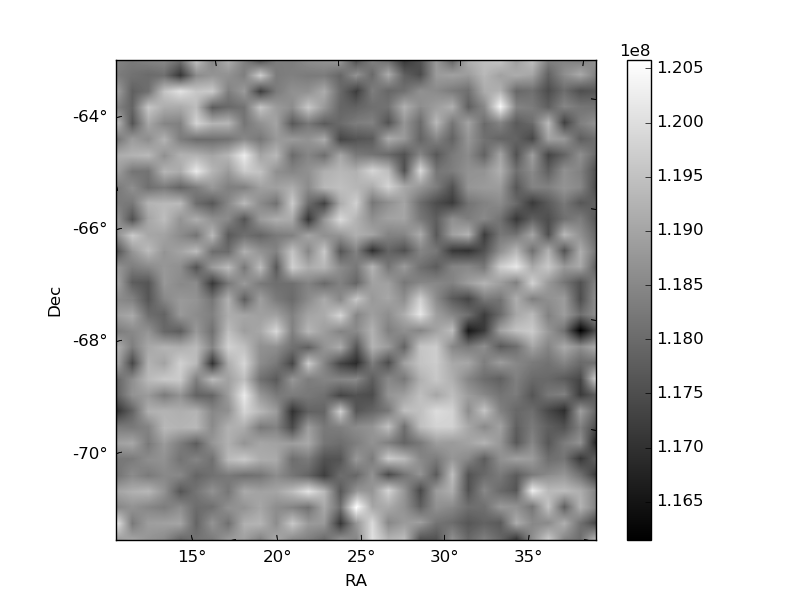
Quadrant B |
|---|---|---|---|
| Quadrant D | 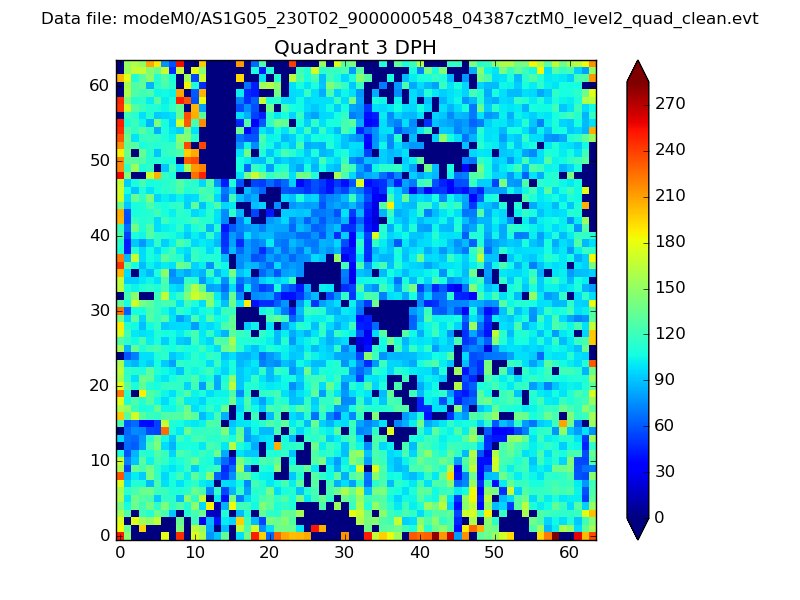 |
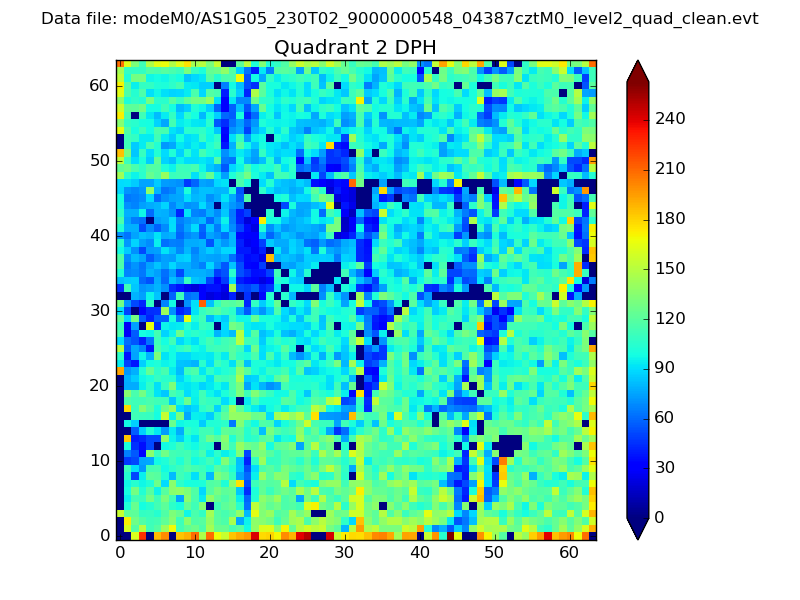 |
Quadrant C |
| Plot type | Count rate plots | Images |
|---|---|---|
| Comparison with Poisson distribution Blue bars denote a histogram of data divided into 1 sec bins. Red curve is a Poisson curve with rate = median count rate of data. |
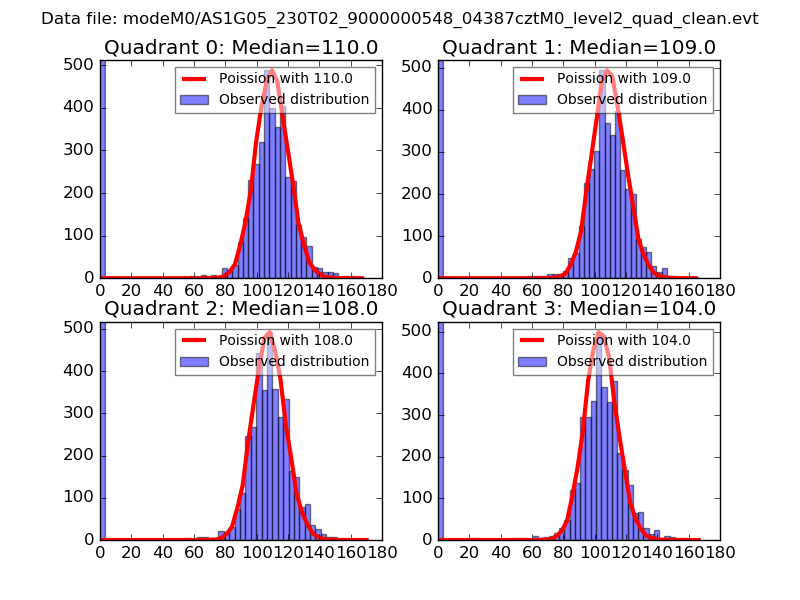 |
 |
| Quadrant-wise count rates Data is divided into 100 sec bins |
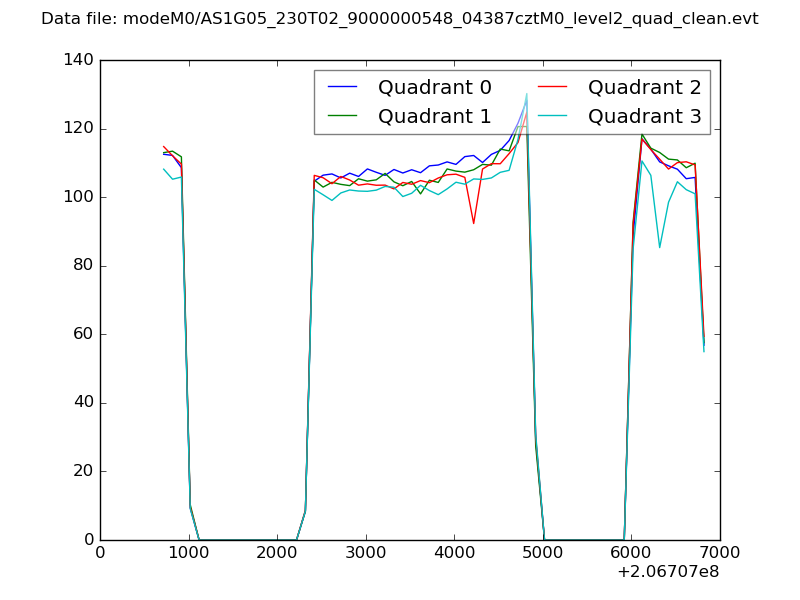 |
|
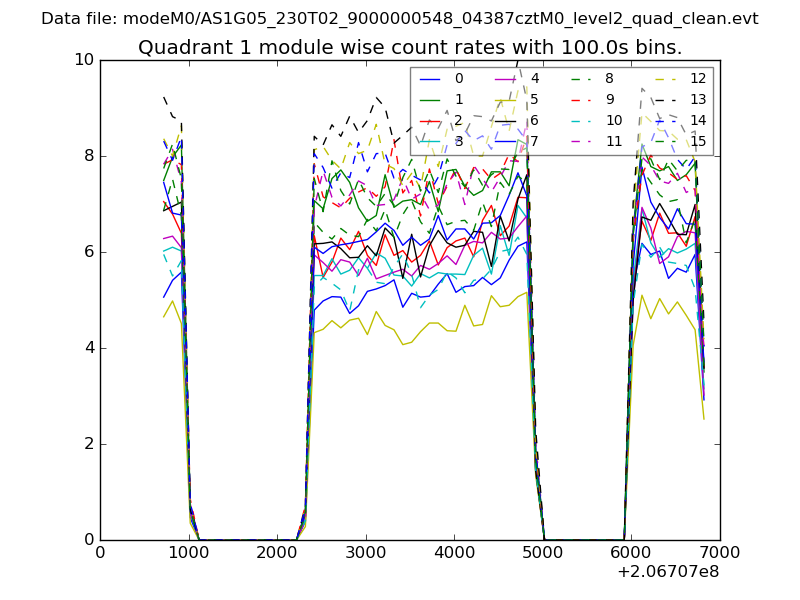
| Module-wise count rates for Quadrant A Data is divided into 100 sec bins |
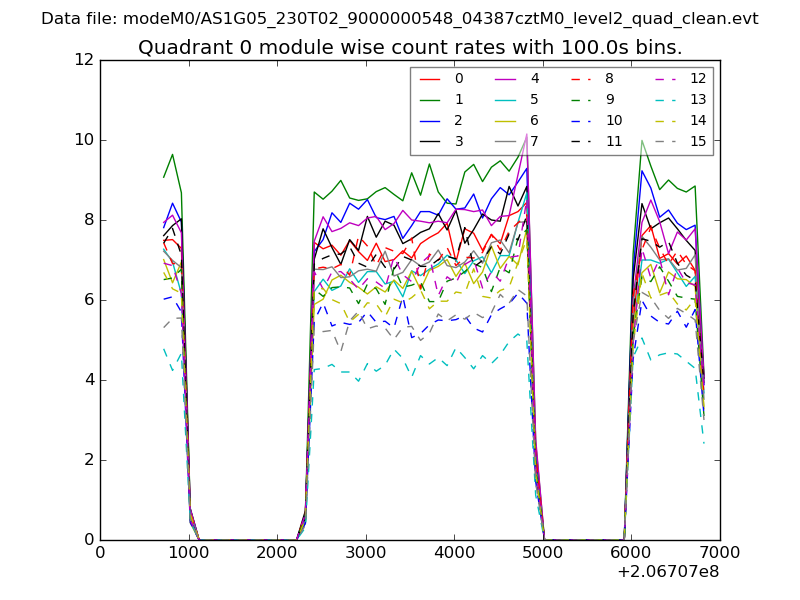 |
 |
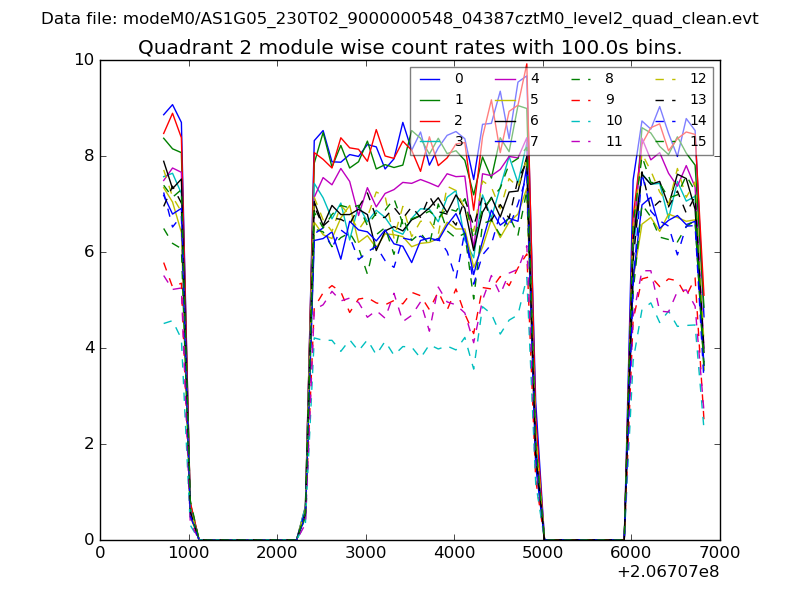
| Module-wise count rates for Quadrant B Data is divided into 100 sec bins |
 |
 |
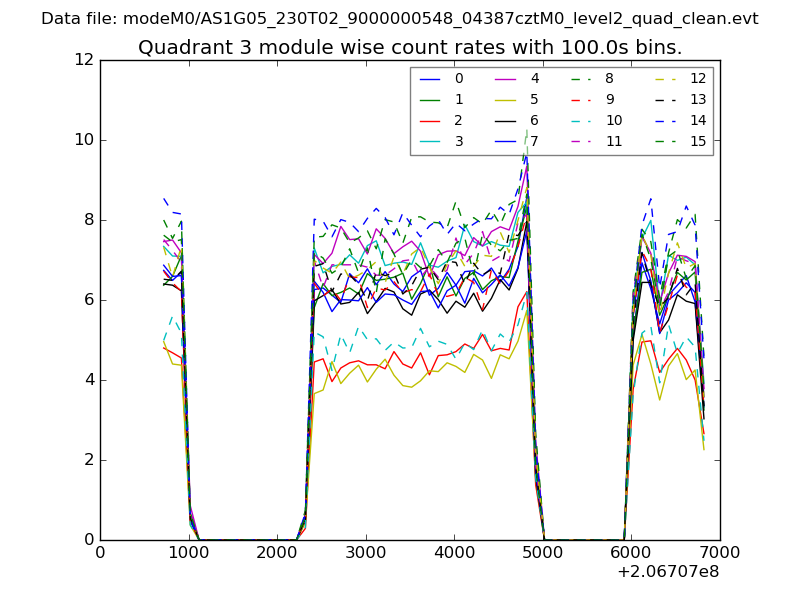
| Module-wise count rates for Quadrant C Data is divided into 100 sec bins |
 |
 |
| Module-wise count rates for Quadrant D Data is divided into 100 sec bins |
 |
 |
| Parameter | Plot |
|---|---|
| CZT HV Monitor | 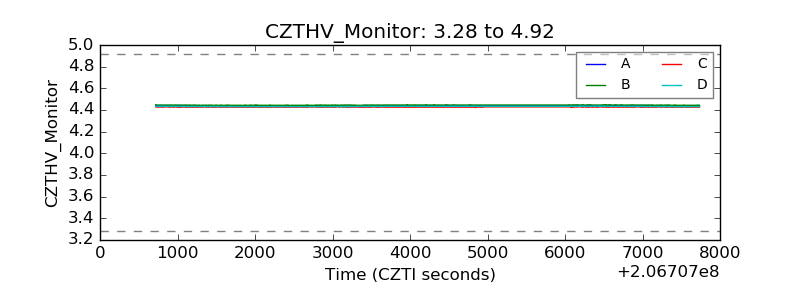 |
| D_VDD | 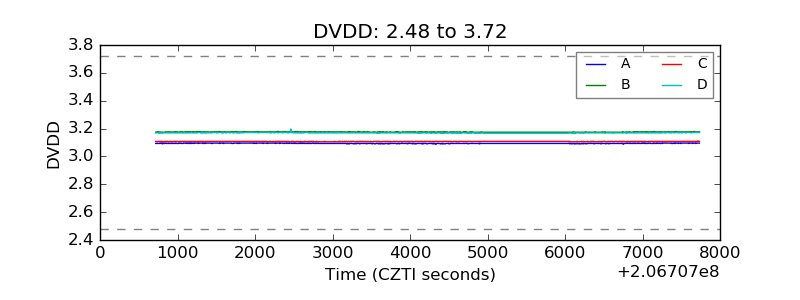 |
| Temperature 1 | 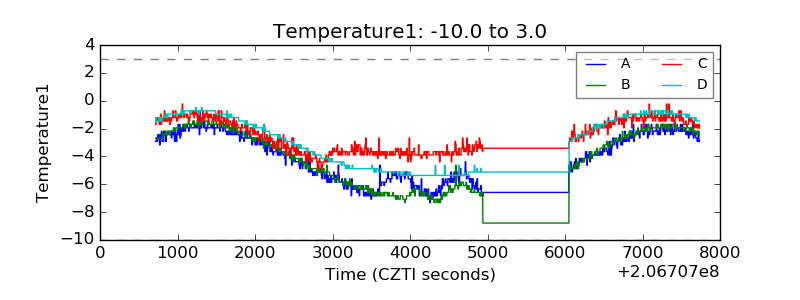 |
| Veto HV Monitor | 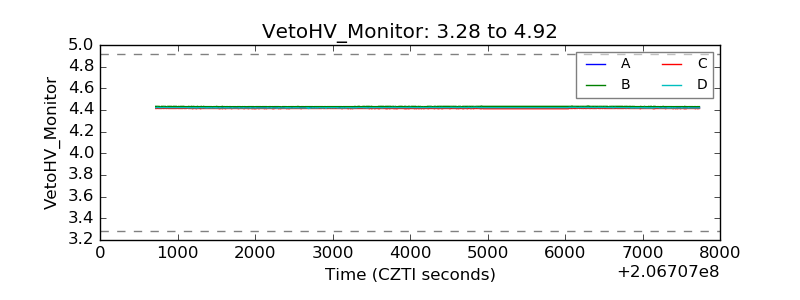 |
| Veto LLD | 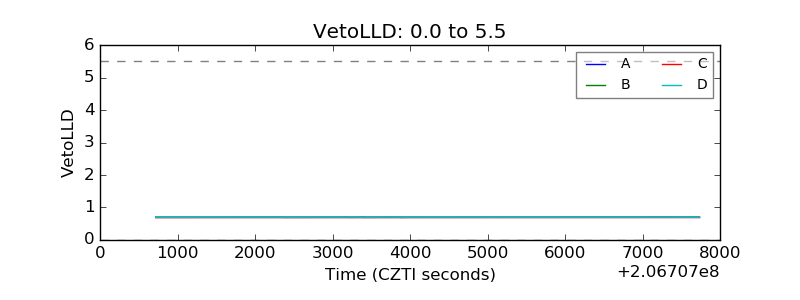 |
| Alpha Counter | 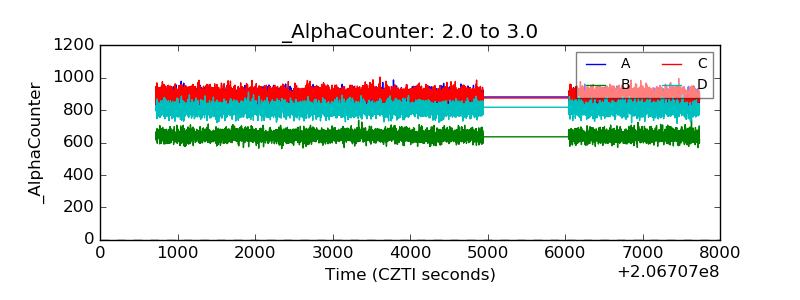 |
| _CPM_Rate | 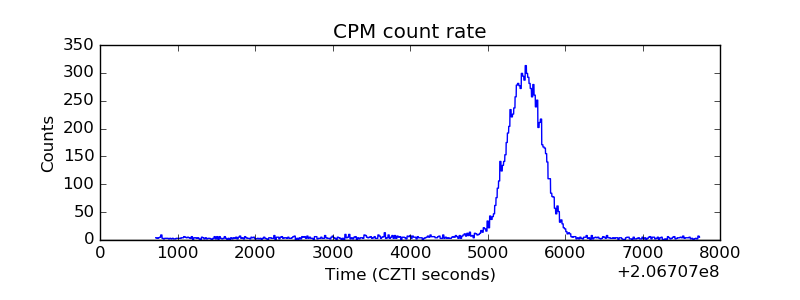 |
| CZT Counter | 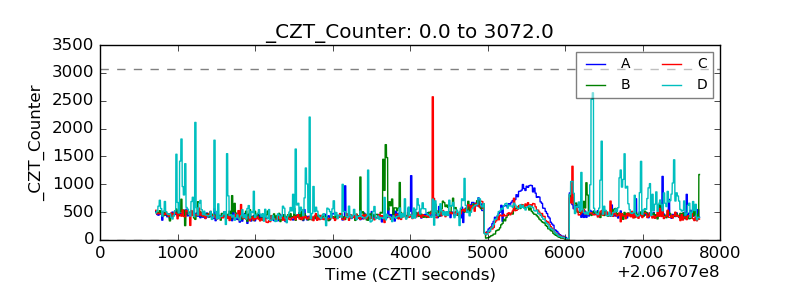 |
| +2.5 Volts monitor |  |
| +5 Volts monitor |  |
| _ROLL_ROT | 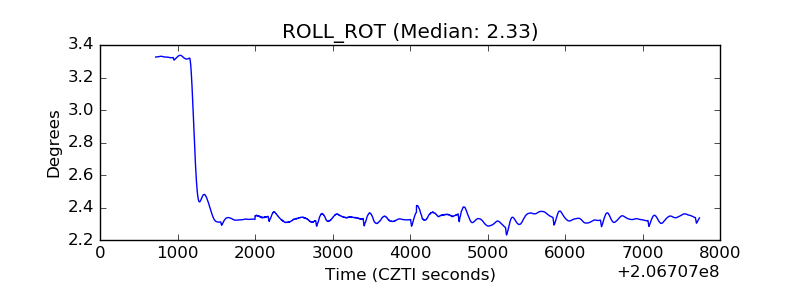 |
| _Roll_DEC | 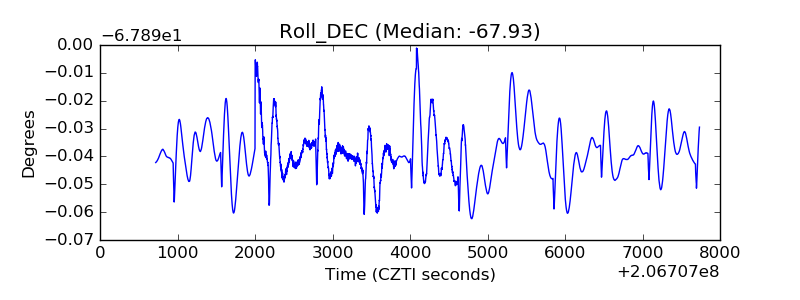 |
| _Roll_RA | 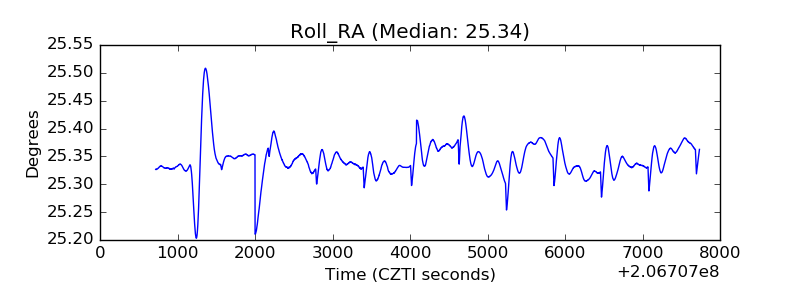 |
| Veto Counter | 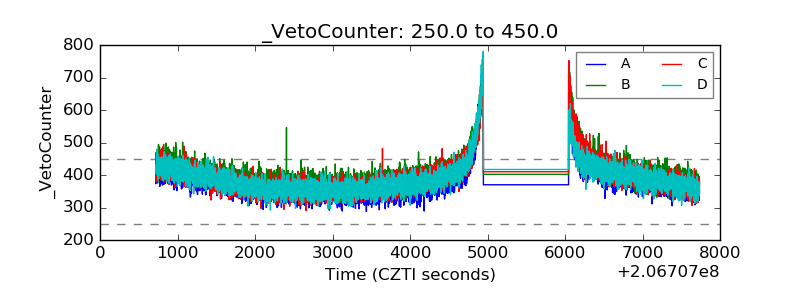 |