| Param | Original file | Final file |
|---|---|---|
| Filename | modeM0/AS1G05_230T02_9000000548_04389cztM0_level2.evt | modeM0/AS1G05_230T02_9000000548_04389cztM0_level2_quad_clean.evt |
| Size (bytes) | 461,422,080 | 74,836,800 |
| Size | 440.0 MB | 71.4 MB |
| Events in quadrant A | 3,224,573 | 450,433 |
| Events in quadrant B | 3,303,993 | 445,537 |
| Events in quadrant C | 3,190,111 | 442,647 |
| Events in quadrant D | 3,771,975 | 432,289 |
| Mode M9 | |||
|---|---|---|---|
| Quadrant | BADHDUFLAG | Total packets | Discarded packets |
| A | 0 | 4 | 0 |
| B | 0 | 4 | 0 |
| C | 0 | 4 | 0 |
| D | 0 | 4 | 0 |
| Mode SS | |||
|---|---|---|---|
| Quadrant | BADHDUFLAG | Total packets | Discarded packets |
| A | 0 | 144 | 0 |
| B | 0 | 144 | 0 |
| C | 0 | 144 | 0 |
| D | 0 | 144 | 0 |
| Mode M0 | |||
|---|---|---|---|
| Quadrant | BADHDUFLAG | Total packets | Discarded packets |
| A | 0 | 14774 | 2 |
| B | 0 | 14804 | 1 |
| C | 0 | 14773 | 1 |
| D | 0 | 16525 | 1 |
| Quadrant | Total seconds | Saturated seconds | Saturation percentage |
|---|---|---|---|
| A | 7109 | 129 | 1.814601% |
| B | 7109 | 125 | 1.758335% |
| C | 7109 | 59 | 0.829934% |
| D | 7109 | 140 | 1.969335% |
Noise dominated data is calculated using 1-second bins in cleaned event files. If a bin has >2000 counts, and if more than 50% of those come from <1% of pixels, then it is considered to be noise-dominated and hence unusable.
| Quadrant | # 1 sec bins | Bins with >0 counts | Bins with >2000 counts | High rate bins dominated by noise | Noise dominated (total time) | Noise dominated (detector-on time) | Marked lightcurve |
|---|---|---|---|---|---|---|---|
| A | 7569 | 7110 | 24 | 24 | 0.32% | 0.34% | 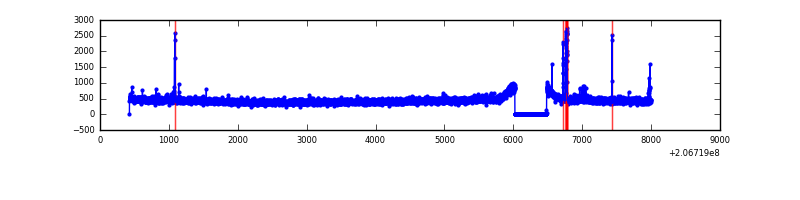 |
| B | 7569 | 7110 | 4 | 4 | 0.05% | 0.06% | 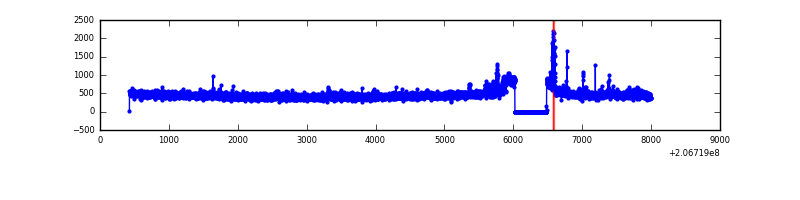 |
| C | 7569 | 7110 | 5 | 5 | 0.07% | 0.07% | 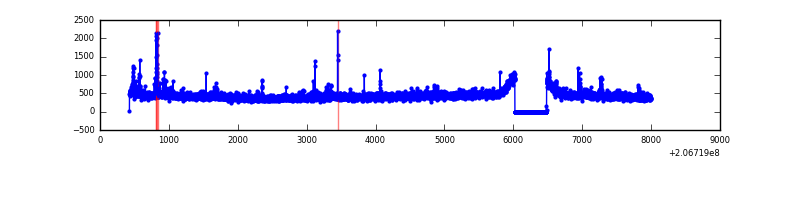 |
| D | 7569 | 7110 | 46 | 46 | 0.61% | 0.65% | 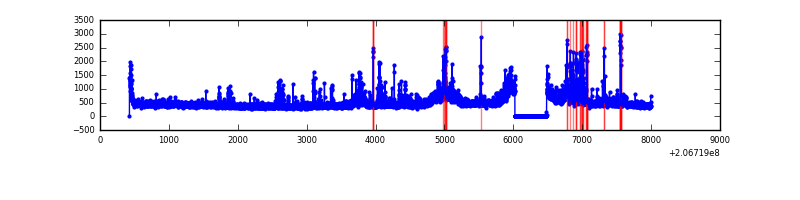 |
Top three noisy pixels from each quadrant. If the there are fewer than three noisy pixels in the level2.evt file, extra rows are filled as -1
| Pixel properties | Quadrant properties | ||||||
|---|---|---|---|---|---|---|---|
| Quadrant | DetID | PixID | Counts | Sigma | Mean | Median | Sigma |
| A | 13 | 248 | 73282 | 437.46 | 807 | 786 | 165.7 |
| A | 13 | 251 | 19997 | 115.92 | 807 | 786 | 165.7 |
| A | 8 | 15 | 14854 | 84.89 | 807 | 786 | 165.7 |
| B | 15 | 54 | 44157 | 280.64 | 808 | 788 | 154.5 |
| B | 15 | 204 | 42737 | 271.45 | 808 | 788 | 154.5 |
| B | 5 | 200 | 35951 | 227.54 | 808 | 788 | 154.5 |
| C | 9 | 247 | 57809 | 314.01 | 783 | 785 | 181.6 |
| C | 14 | 48 | 42743 | 231.04 | 783 | 785 | 181.6 |
| C | 9 | 16 | 25181 | 134.34 | 783 | 785 | 181.6 |
| D | 2 | 63 | 250874 | 1347.64 | 780 | 758 | 185.6 |
| D | 9 | 35 | 109932 | 588.24 | 780 | 758 | 185.6 |
| D | 2 | 136 | 86995 | 464.65 | 780 | 758 | 185.6 |
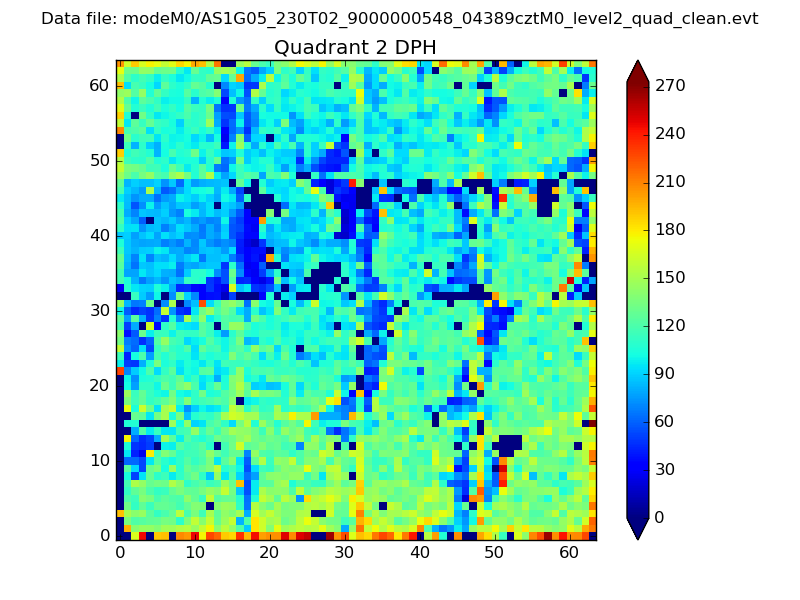
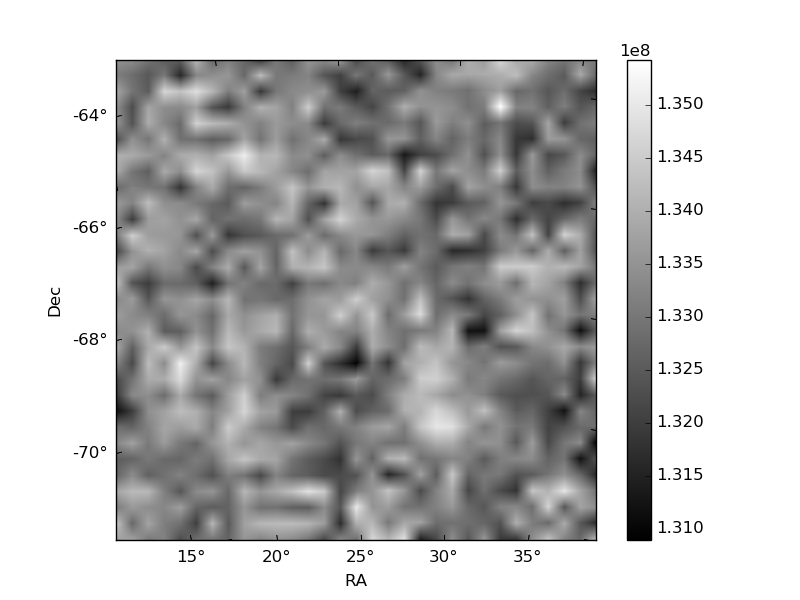
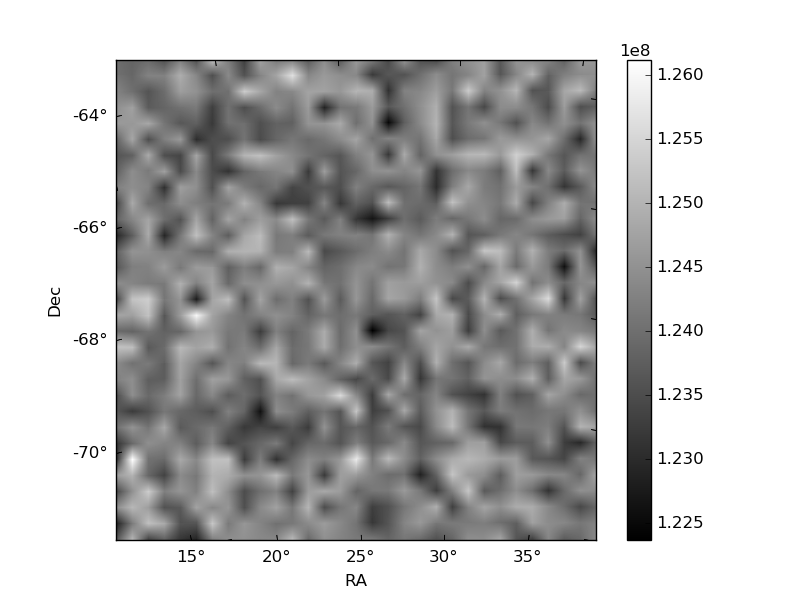
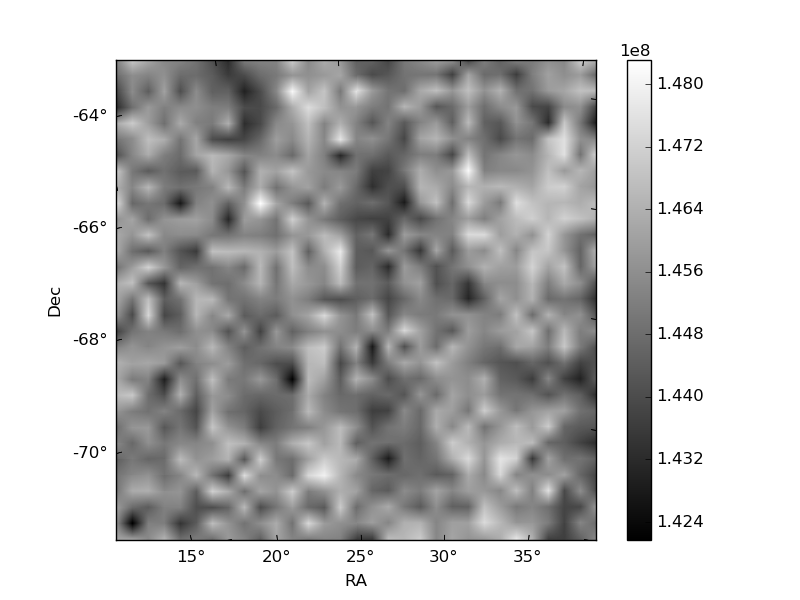
Histogram calculated using DETX and DETY for each event in the final _common_clean file
| Quadrant A |  |
 |
Quadrant B |
|---|---|---|---|
| Quadrant D | 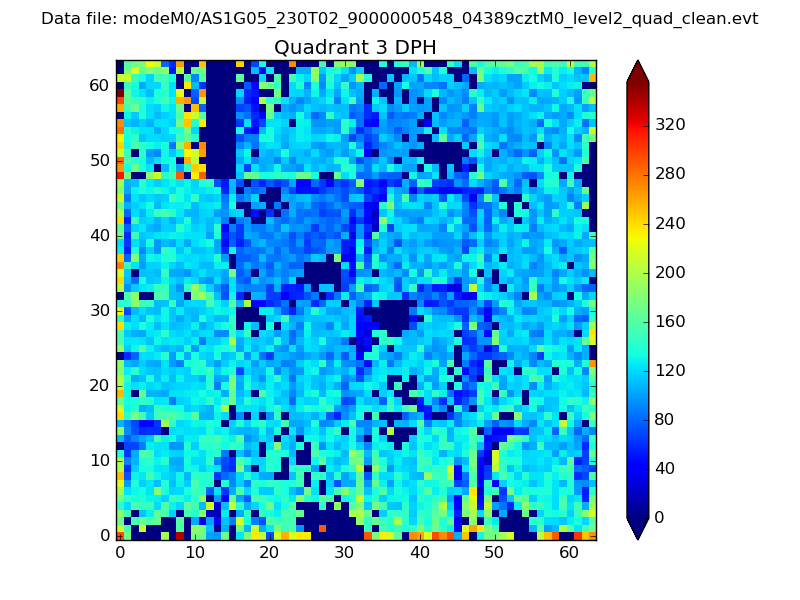 |
 |
Quadrant C |
| Plot type | Count rate plots | Images |
|---|---|---|
| Comparison with Poisson distribution Blue bars denote a histogram of data divided into 1 sec bins. Red curve is a Poisson curve with rate = median count rate of data. |
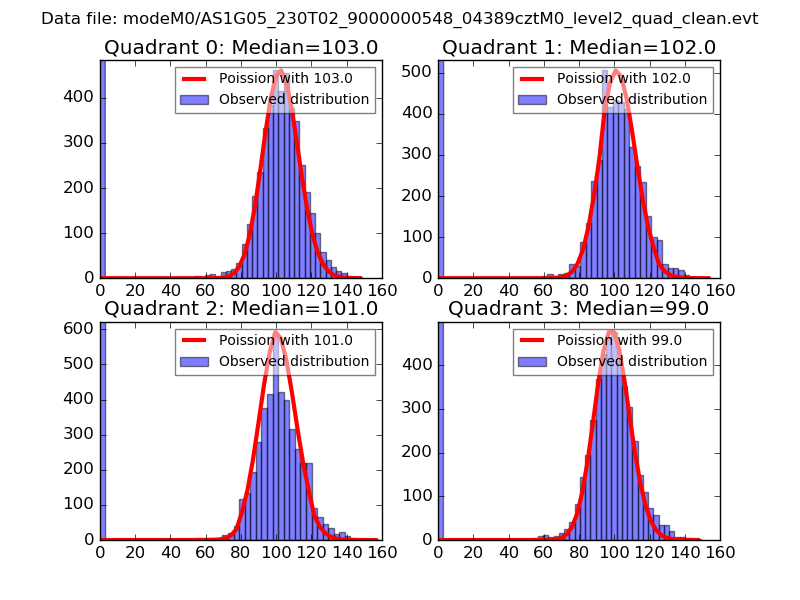 |
 |
| Quadrant-wise count rates Data is divided into 100 sec bins |
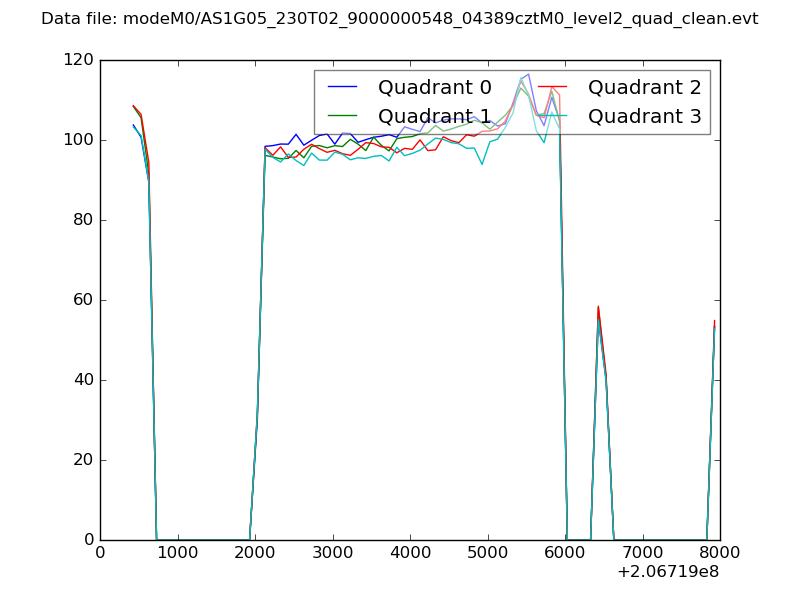 |
|
| Module-wise count rates for Quadrant A Data is divided into 100 sec bins |
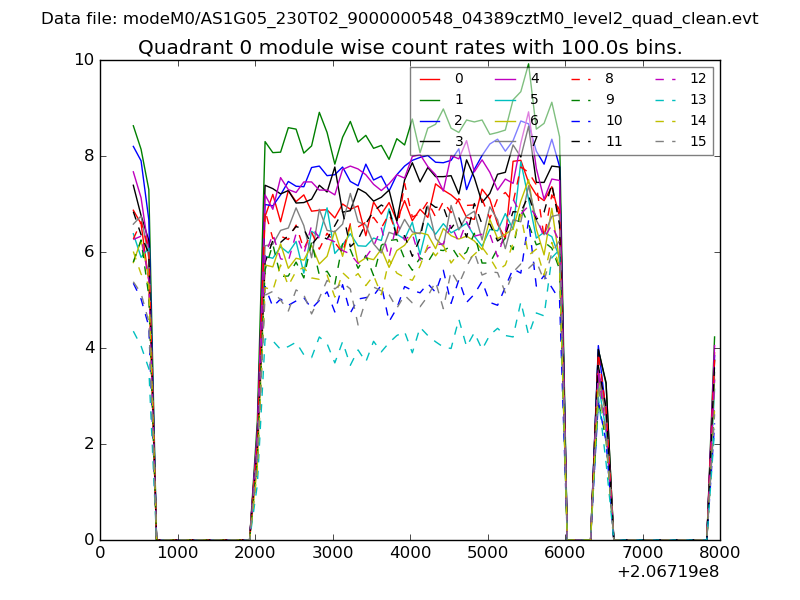 |
 |
| Module-wise count rates for Quadrant B Data is divided into 100 sec bins |
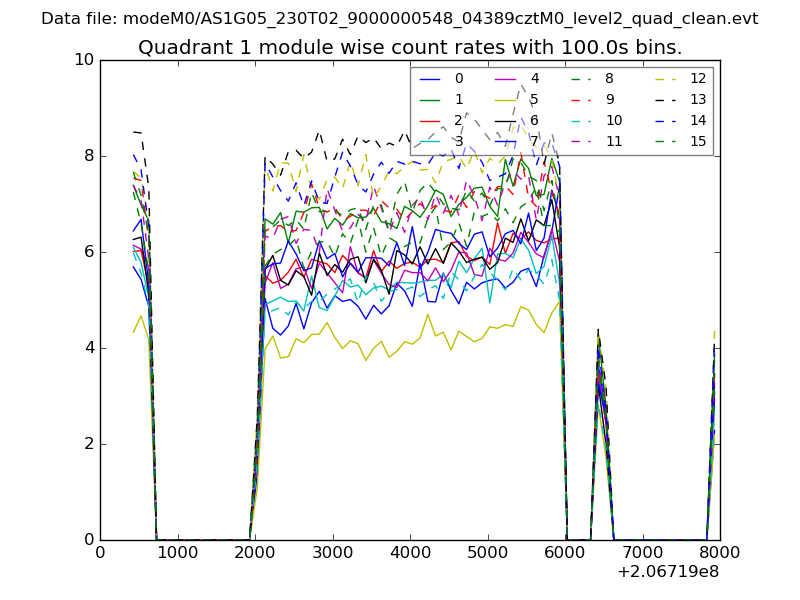 |
 |
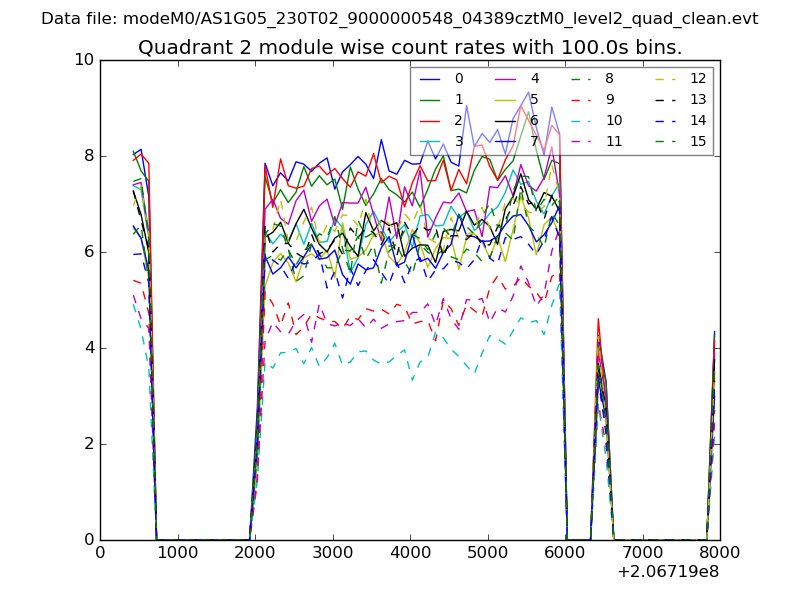
| Module-wise count rates for Quadrant C Data is divided into 100 sec bins |
 |
 |
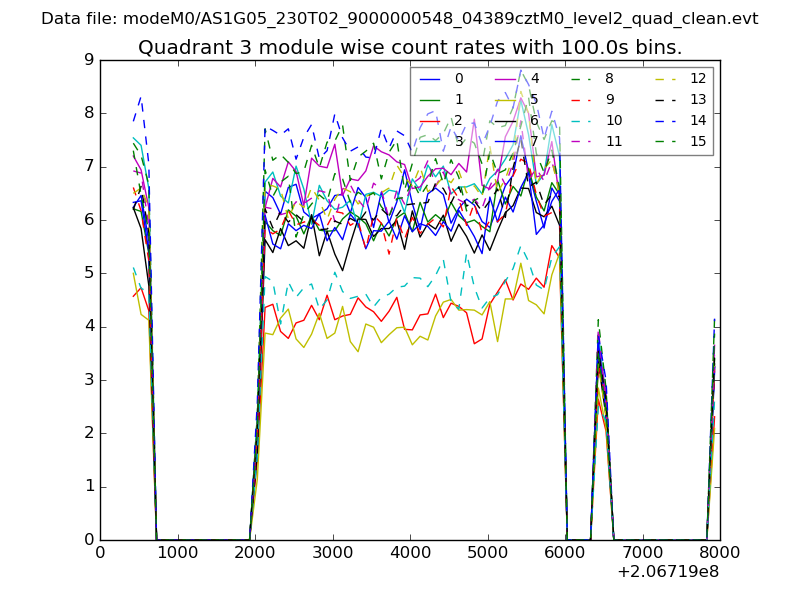
| Module-wise count rates for Quadrant D Data is divided into 100 sec bins |
 |
 |
| Parameter | Plot |
|---|---|
| CZT HV Monitor | 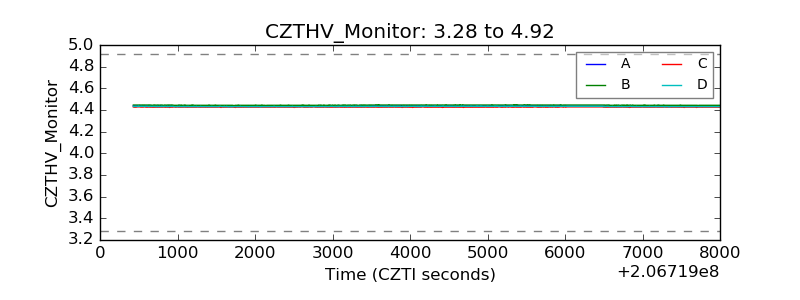 |
| D_VDD | 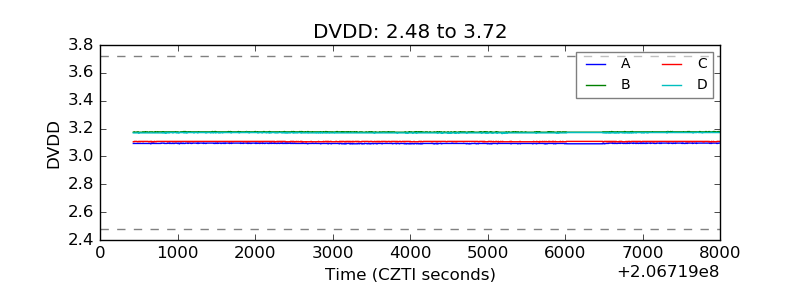 |
| Temperature 1 | 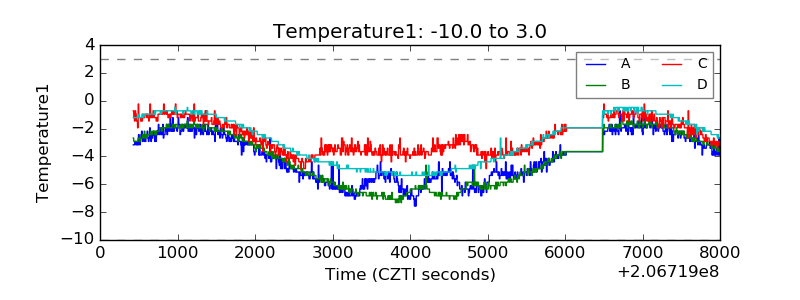 |
| Veto HV Monitor | 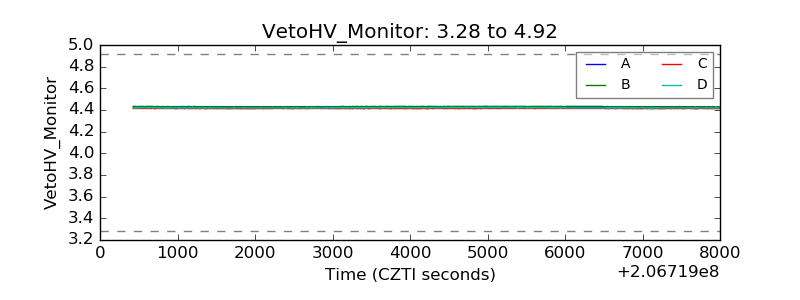 |
| Veto LLD | 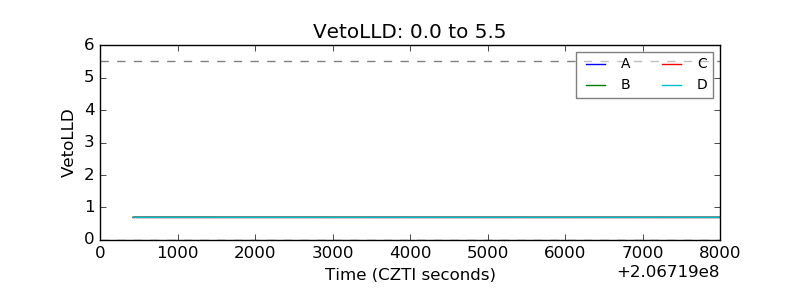 |
| Alpha Counter | 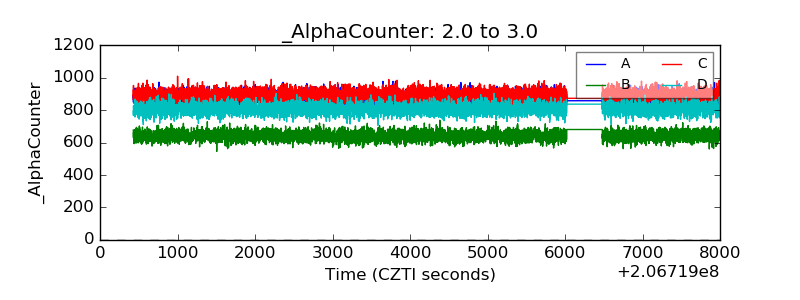 |
| _CPM_Rate | 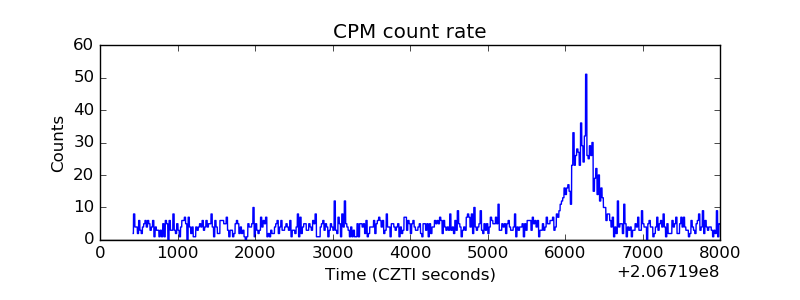 |
| CZT Counter | 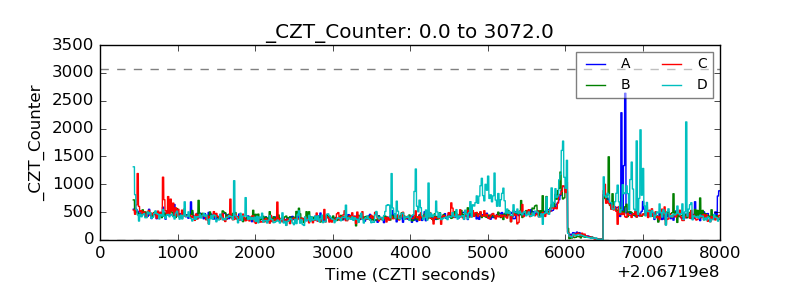 |
| +2.5 Volts monitor |  |
| +5 Volts monitor |  |
| _ROLL_ROT | 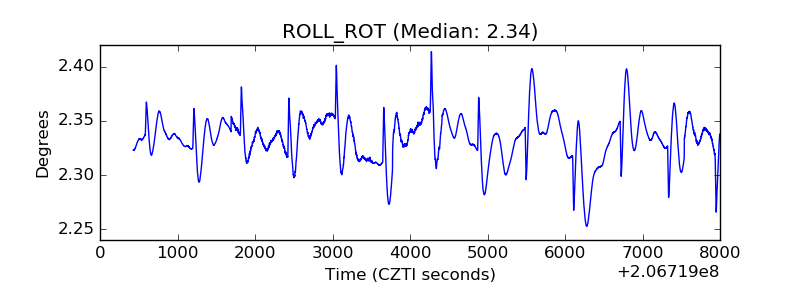 |
| _Roll_DEC | 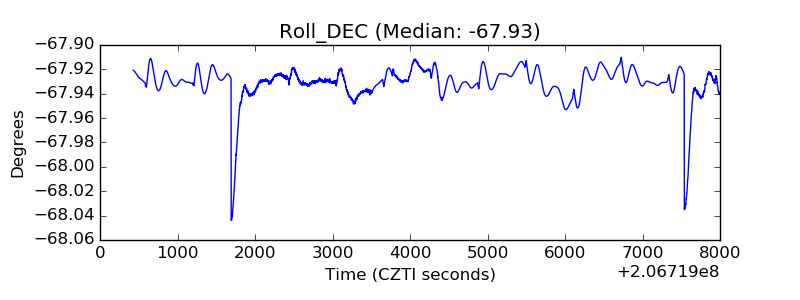 |
| _Roll_RA | 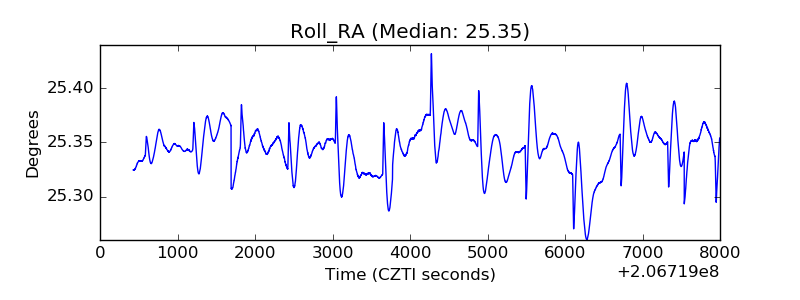 |
| Veto Counter | 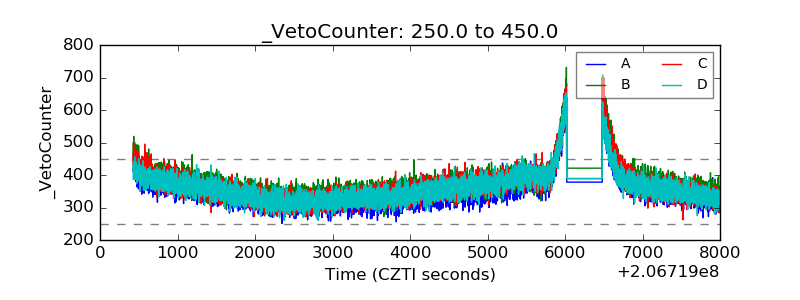 |