| Param | Original file | Final file |
|---|---|---|
| Filename | modeM0/AS1G05_230T02_9000000548_04390cztM0_level2.evt | modeM0/AS1G05_230T02_9000000548_04390cztM0_level2_quad_clean.evt |
| Size (bytes) | 499,291,200 | 81,417,600 |
| Size | 476.2 MB | 77.6 MB |
| Events in quadrant A | 3,340,593 | 495,030 |
| Events in quadrant B | 3,406,924 | 490,202 |
| Events in quadrant C | 3,274,501 | 490,337 |
| Events in quadrant D | 4,597,849 | 476,414 |
| Mode M9 | |||
|---|---|---|---|
| Quadrant | BADHDUFLAG | Total packets | Discarded packets |
| A | 0 | 3 | 0 |
| B | 0 | 3 | 0 |
| C | 0 | 3 | 0 |
| D | 0 | 3 | 0 |
| Mode SS | |||
|---|---|---|---|
| Quadrant | BADHDUFLAG | Total packets | Discarded packets |
| A | 0 | 150 | 0 |
| B | 0 | 150 | 0 |
| C | 0 | 150 | 0 |
| D | 0 | 150 | 0 |
| Mode M0 | |||
|---|---|---|---|
| Quadrant | BADHDUFLAG | Total packets | Discarded packets |
| A | 0 | 15329 | 2 |
| B | 0 | 15377 | 1 |
| C | 0 | 15246 | 1 |
| D | 0 | 18985 | 1 |
| Quadrant | Total seconds | Saturated seconds | Saturation percentage |
|---|---|---|---|
| A | 7382 | 133 | 1.801680% |
| B | 7382 | 100 | 1.354646% |
| C | 7382 | 38 | 0.514766% |
| D | 7382 | 215 | 2.912490% |
Noise dominated data is calculated using 1-second bins in cleaned event files. If a bin has >2000 counts, and if more than 50% of those come from <1% of pixels, then it is considered to be noise-dominated and hence unusable.
| Quadrant | # 1 sec bins | Bins with >0 counts | Bins with >2000 counts | High rate bins dominated by noise | Noise dominated (total time) | Noise dominated (detector-on time) | Marked lightcurve |
|---|---|---|---|---|---|---|---|
| A | 7617 | 7384 | 24 | 24 | 0.32% | 0.33% | 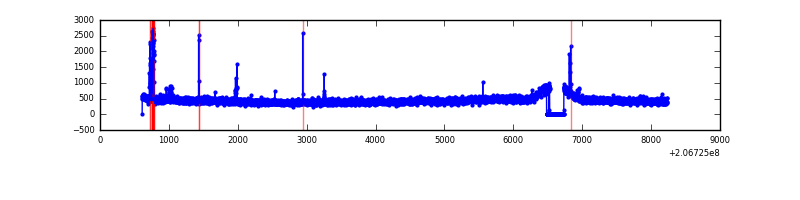 |
| B | 7617 | 7384 | 1 | 1 | 0.01% | 0.01% | 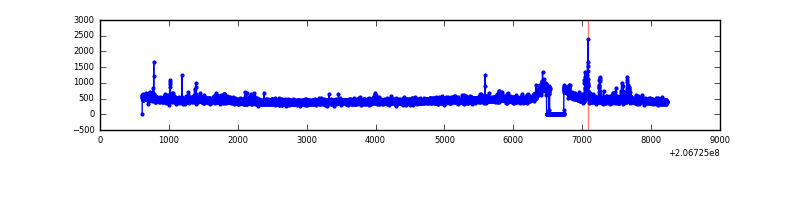 |
| C | 7617 | 7384 | 0 | 0 | 0.00% | 0.00% | 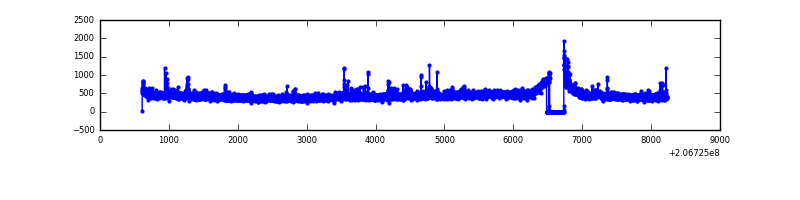 |
| D | 7617 | 7384 | 127 | 127 | 1.67% | 1.72% | 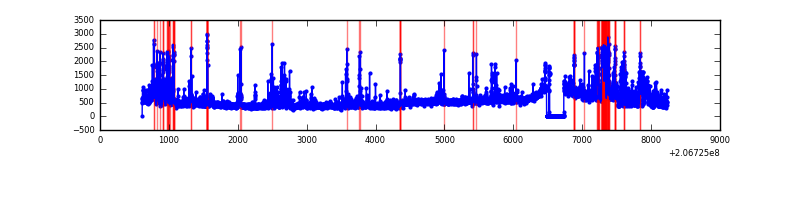 |
Top three noisy pixels from each quadrant. If the there are fewer than three noisy pixels in the level2.evt file, extra rows are filled as -1
| Pixel properties | Quadrant properties | ||||||
|---|---|---|---|---|---|---|---|
| Quadrant | DetID | PixID | Counts | Sigma | Mean | Median | Sigma |
| A | 13 | 248 | 62820 | 361.88 | 834 | 812 | 171.3 |
| A | 13 | 251 | 28190 | 159.78 | 834 | 812 | 171.3 |
| A | 13 | 14 | 12713 | 69.45 | 834 | 812 | 171.3 |
| B | 14 | 167 | 92751 | 570.24 | 839 | 817 | 161.2 |
| B | 15 | 204 | 38948 | 236.52 | 839 | 817 | 161.2 |
| B | 15 | 54 | 18641 | 110.56 | 839 | 817 | 161.2 |
| C | 9 | 16 | 62828 | 328.92 | 807 | 809 | 188.6 |
| C | 14 | 48 | 41462 | 215.61 | 807 | 809 | 188.6 |
| C | 9 | 247 | 16016 | 80.65 | 807 | 809 | 188.6 |
| D | 2 | 63 | 635768 | 3288.86 | 801 | 777 | 193.1 |
| D | 2 | 37 | 479652 | 2480.27 | 801 | 777 | 193.1 |
| D | 9 | 35 | 169694 | 874.88 | 801 | 777 | 193.1 |
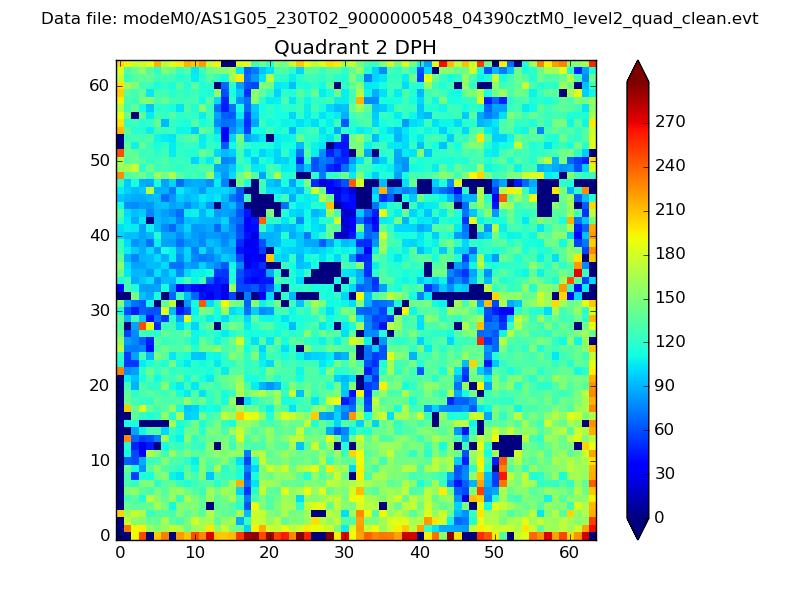
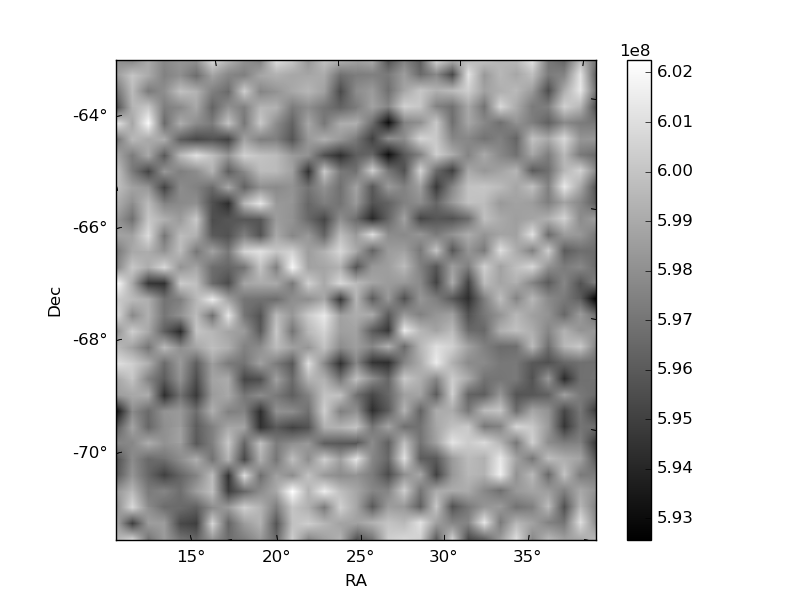
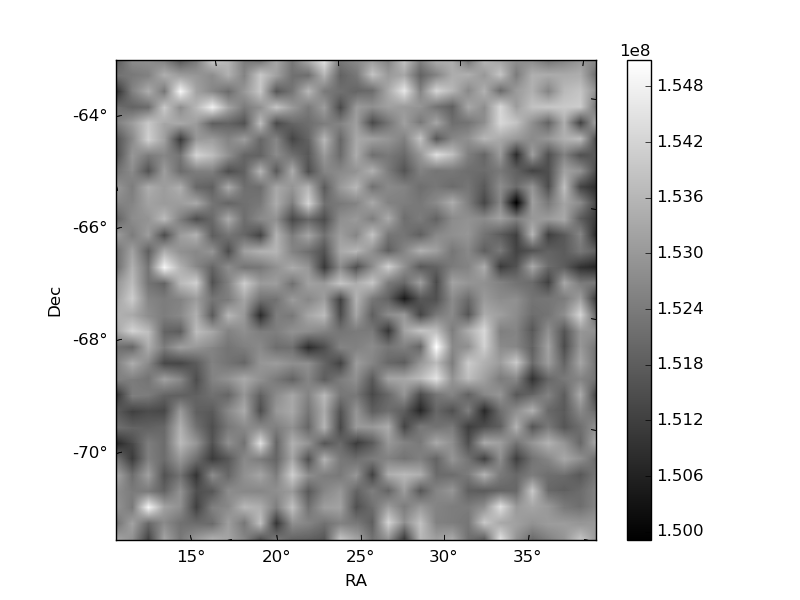
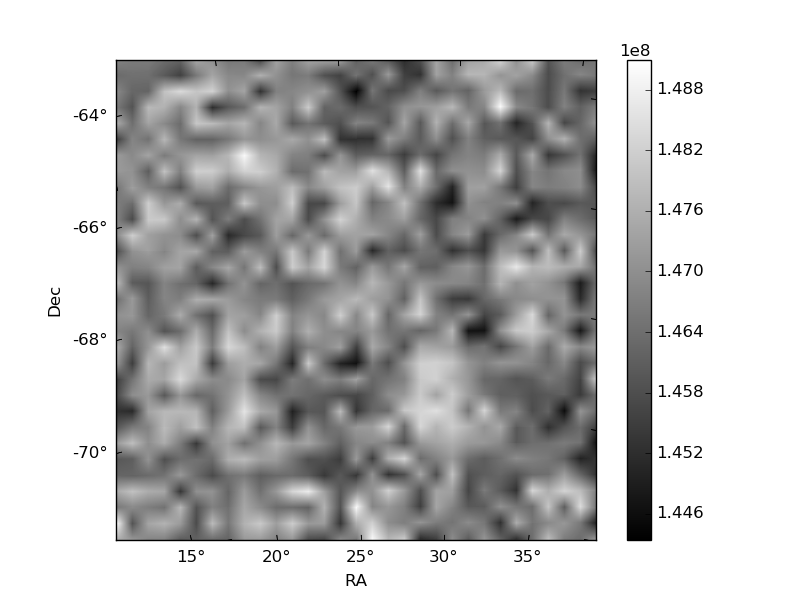
Histogram calculated using DETX and DETY for each event in the final _common_clean file
| Quadrant A | 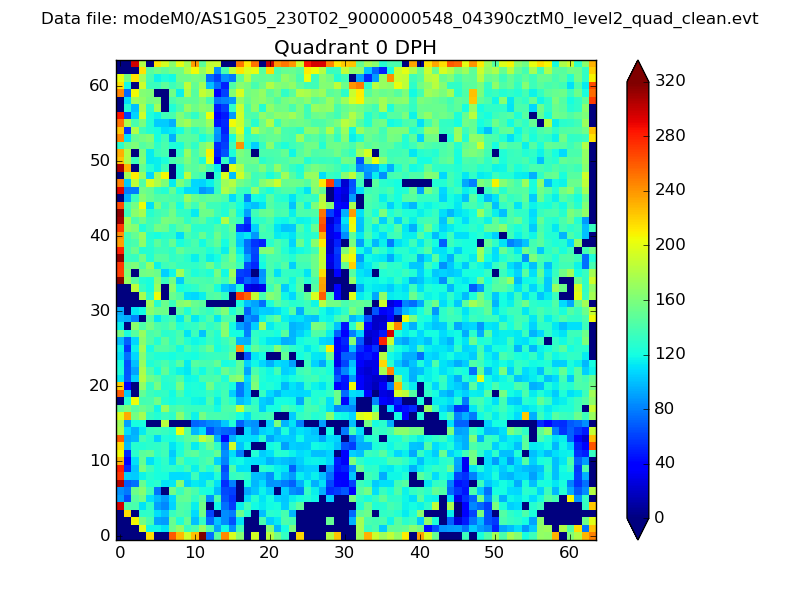 |
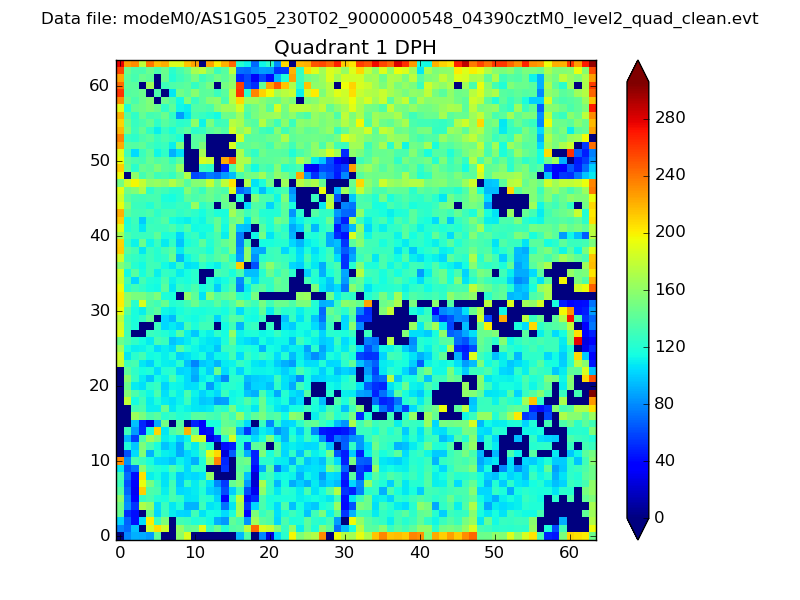 |
Quadrant B |
|---|---|---|---|
| Quadrant D | 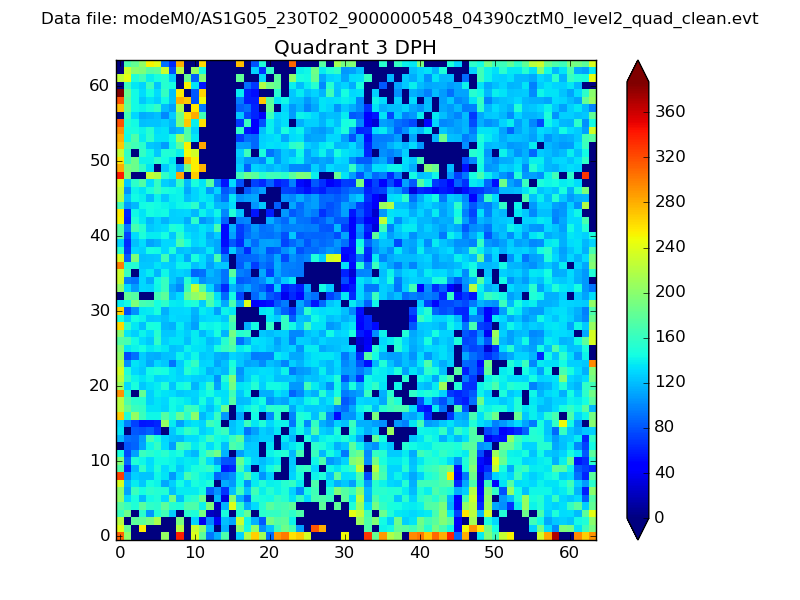 |
 |
Quadrant C |
| Plot type | Count rate plots | Images |
|---|---|---|
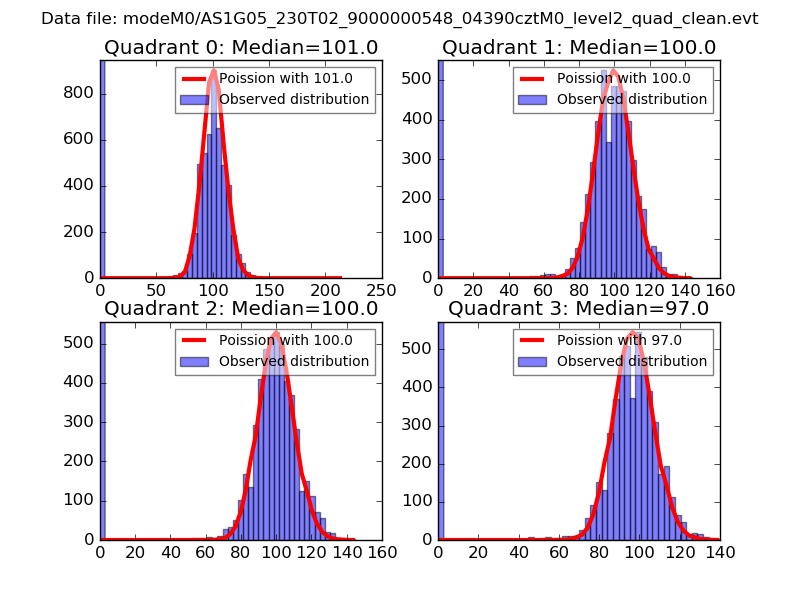
| Comparison with Poisson distribution Blue bars denote a histogram of data divided into 1 sec bins. Red curve is a Poisson curve with rate = median count rate of data. |
 |
 |
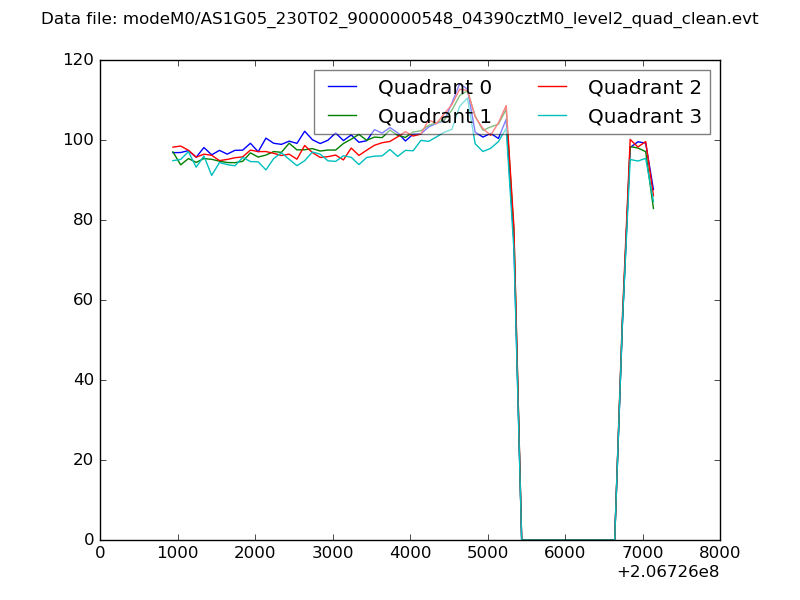
| Quadrant-wise count rates Data is divided into 100 sec bins |
 |
|
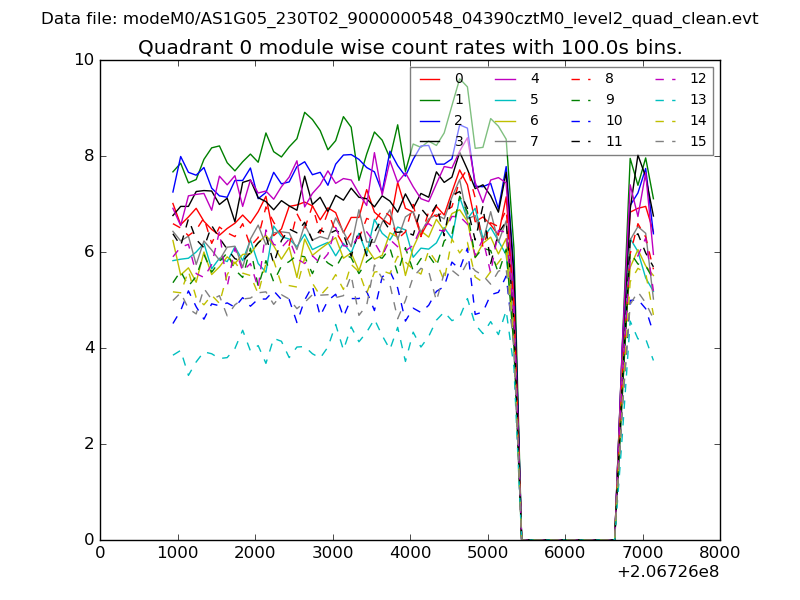
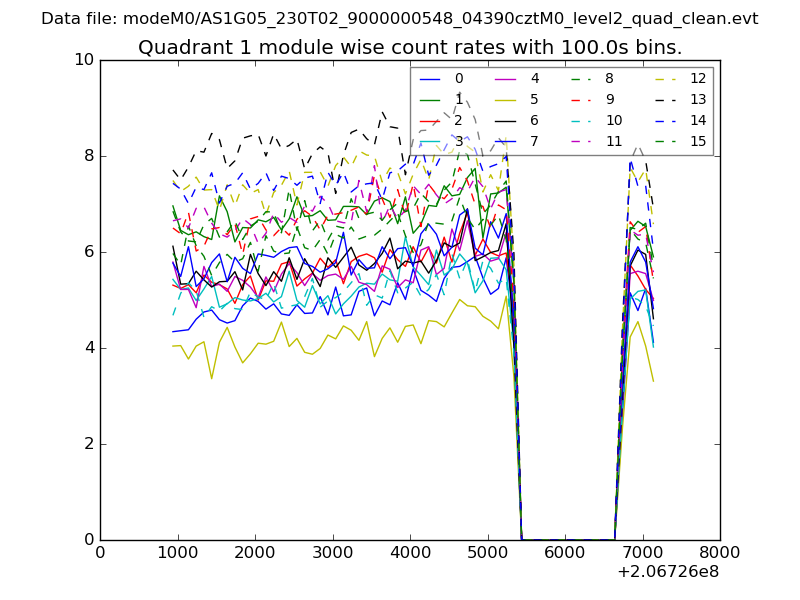
| Module-wise count rates for Quadrant A Data is divided into 100 sec bins |
 |
 |
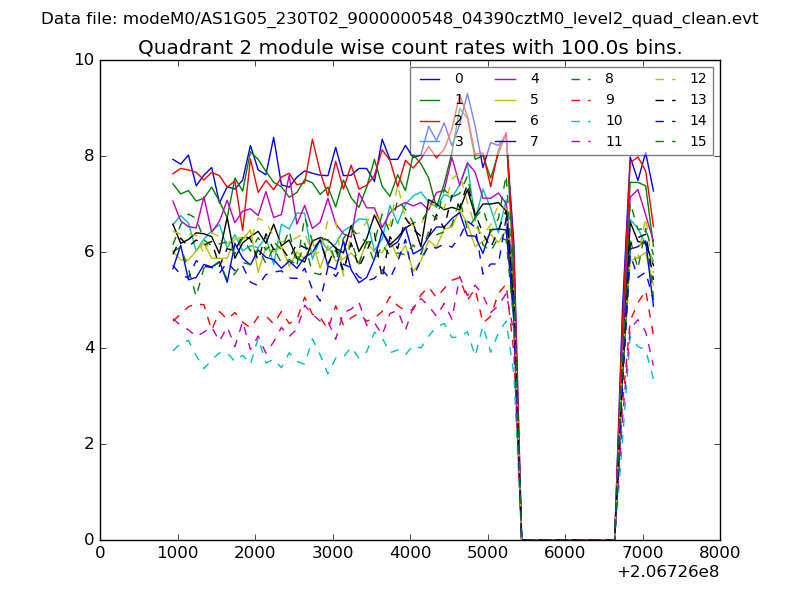
| Module-wise count rates for Quadrant B Data is divided into 100 sec bins |
 |
 |
| Module-wise count rates for Quadrant C Data is divided into 100 sec bins |
 |
 |
| Module-wise count rates for Quadrant D Data is divided into 100 sec bins |
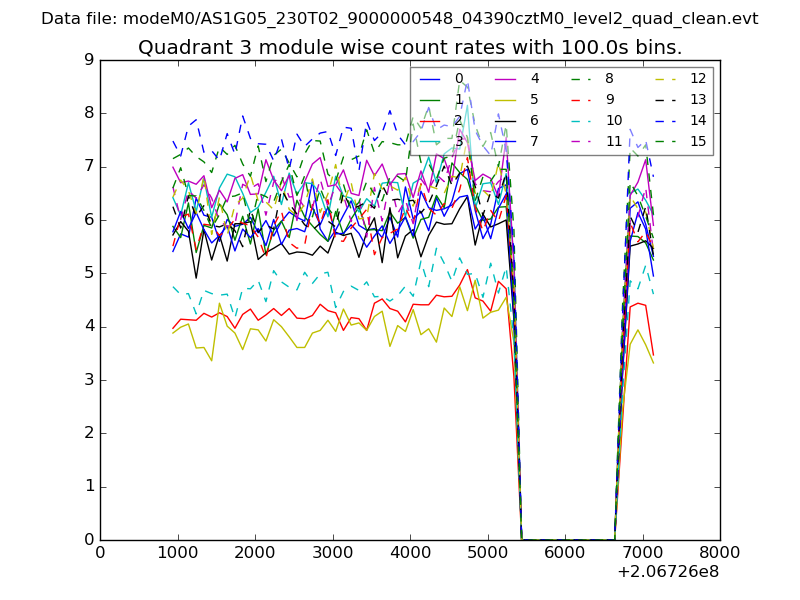 |
 |
| Parameter | Plot |
|---|---|
| CZT HV Monitor | 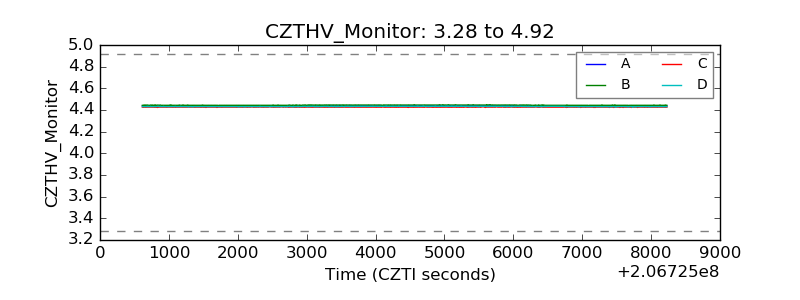 |
| D_VDD |  |
| Temperature 1 | 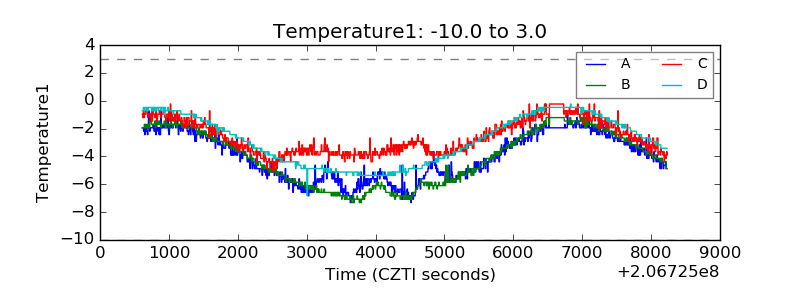 |
| Veto HV Monitor |  |
| Veto LLD | 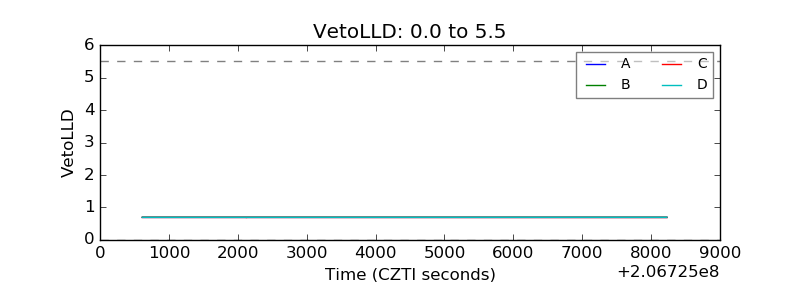 |
| Alpha Counter | 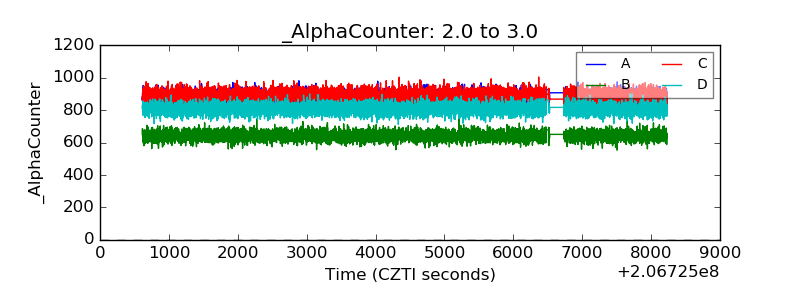 |
| _CPM_Rate | 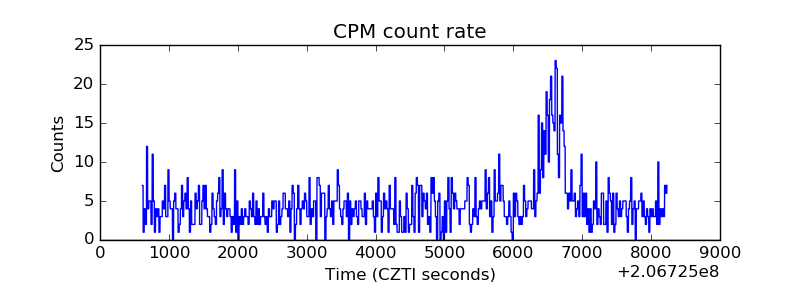 |
| CZT Counter | 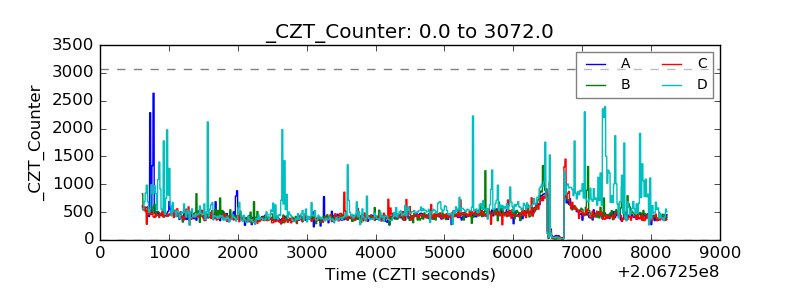 |
| +2.5 Volts monitor |  |
| +5 Volts monitor |  |
| _ROLL_ROT | 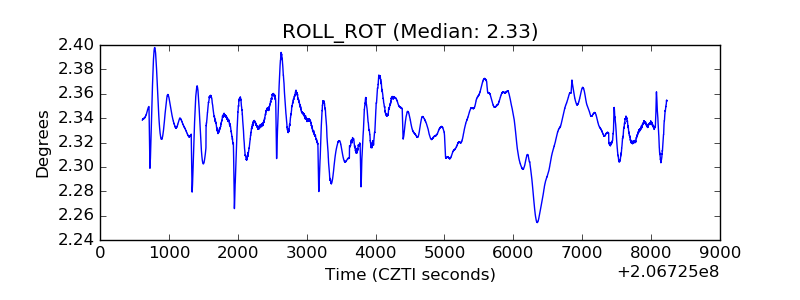 |
| _Roll_DEC | 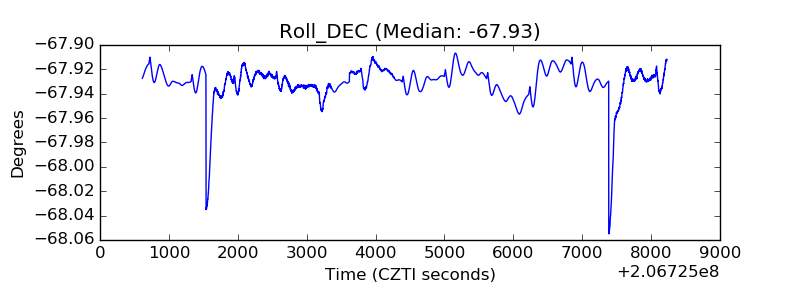 |
| _Roll_RA | 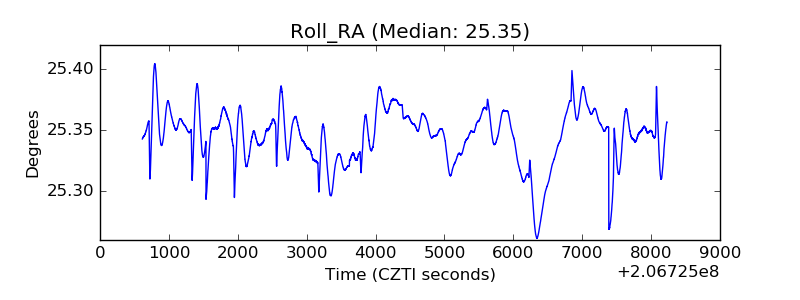 |
| Veto Counter | 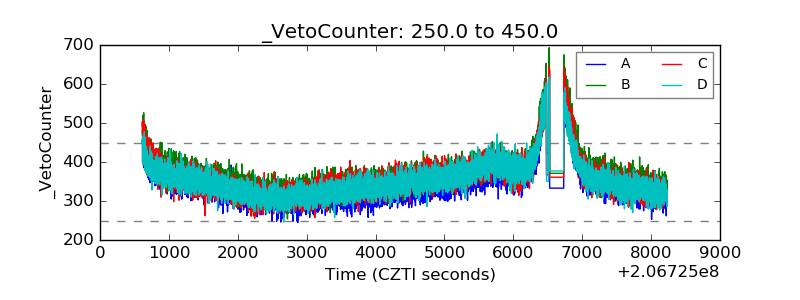 |