| Param | Original file | Final file |
|---|---|---|
| Filename | modeM0/AS1G05_230T02_9000000548_04391cztM0_level2.evt | modeM0/AS1G05_230T02_9000000548_04391cztM0_level2_quad_clean.evt |
| Size (bytes) | 564,416,640 | 90,123,840 |
| Size | 538.3 MB | 85.9 MB |
| Events in quadrant A | 3,392,716 | 559,867 |
| Events in quadrant B | 3,962,439 | 552,788 |
| Events in quadrant C | 3,431,204 | 552,725 |
| Events in quadrant D | 5,784,761 | 528,042 |
| Mode M9 | |||
|---|---|---|---|
| Quadrant | BADHDUFLAG | Total packets | Discarded packets |
| A | 0 | 3 | 0 |
| B | 0 | 3 | 0 |
| C | 0 | 3 | 0 |
| D | 0 | 3 | 0 |
| Mode SS | |||
|---|---|---|---|
| Quadrant | BADHDUFLAG | Total packets | Discarded packets |
| A | 0 | 156 | 0 |
| B | 0 | 156 | 0 |
| C | 0 | 156 | 0 |
| D | 0 | 156 | 0 |
| Mode M0 | |||
|---|---|---|---|
| Quadrant | BADHDUFLAG | Total packets | Discarded packets |
| A | 0 | 15814 | 8 |
| B | 0 | 17288 | 2 |
| C | 0 | 16016 | 7 |
| D | 0 | 22677 | 5 |
| Quadrant | Total seconds | Saturated seconds | Saturation percentage |
|---|---|---|---|
| A | 7700 | 88 | 1.142857% |
| B | 7702 | 181 | 2.350039% |
| C | 7700 | 46 | 0.597403% |
| D | 7701 | 285 | 3.700818% |
Noise dominated data is calculated using 1-second bins in cleaned event files. If a bin has >2000 counts, and if more than 50% of those come from <1% of pixels, then it is considered to be noise-dominated and hence unusable.
| Quadrant | # 1 sec bins | Bins with >0 counts | Bins with >2000 counts | High rate bins dominated by noise | Noise dominated (total time) | Noise dominated (detector-on time) | Marked lightcurve |
|---|---|---|---|---|---|---|---|
| A | 8002 | 7703 | 1 | 1 | 0.01% | 0.01% |  |
| B | 8002 | 7703 | 58 | 58 | 0.72% | 0.75% |  |
| C | 8002 | 7703 | 13 | 13 | 0.16% | 0.17% |  |
| D | 8002 | 7703 | 235 | 235 | 2.94% | 3.05% | 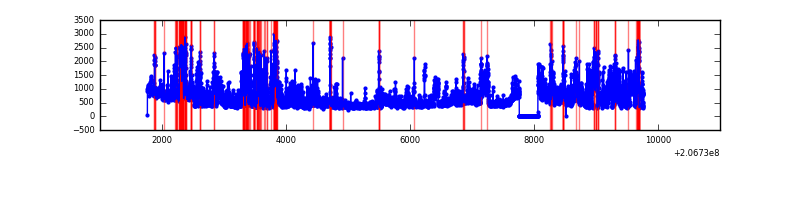 |
Top three noisy pixels from each quadrant. If the there are fewer than three noisy pixels in the level2.evt file, extra rows are filled as -1
| Pixel properties | Quadrant properties | ||||||
|---|---|---|---|---|---|---|---|
| Quadrant | DetID | PixID | Counts | Sigma | Mean | Median | Sigma |
| A | 13 | 14 | 20549 | 109.99 | 867 | 846 | 179.1 |
| A | 13 | 248 | 13924 | 73.0 | 867 | 846 | 179.1 |
| A | 13 | 251 | 12465 | 64.86 | 867 | 846 | 179.1 |
| B | 14 | 167 | 476766 | 2848.22 | 871 | 849 | 167.1 |
| B | 10 | 16 | 64054 | 378.26 | 871 | 849 | 167.1 |
| B | 0 | 187 | 24795 | 143.31 | 871 | 849 | 167.1 |
| C | 14 | 48 | 110695 | 567.3 | 836 | 835 | 193.7 |
| C | 9 | 16 | 23535 | 117.22 | 836 | 835 | 193.7 |
| C | 9 | 247 | 17855 | 87.89 | 836 | 835 | 193.7 |
| D | 2 | 63 | 1821813 | 9100.76 | 827 | 801 | 200.1 |
| D | 9 | 35 | 219825 | 1094.6 | 827 | 801 | 200.1 |
| D | 2 | 37 | 171863 | 854.91 | 827 | 801 | 200.1 |
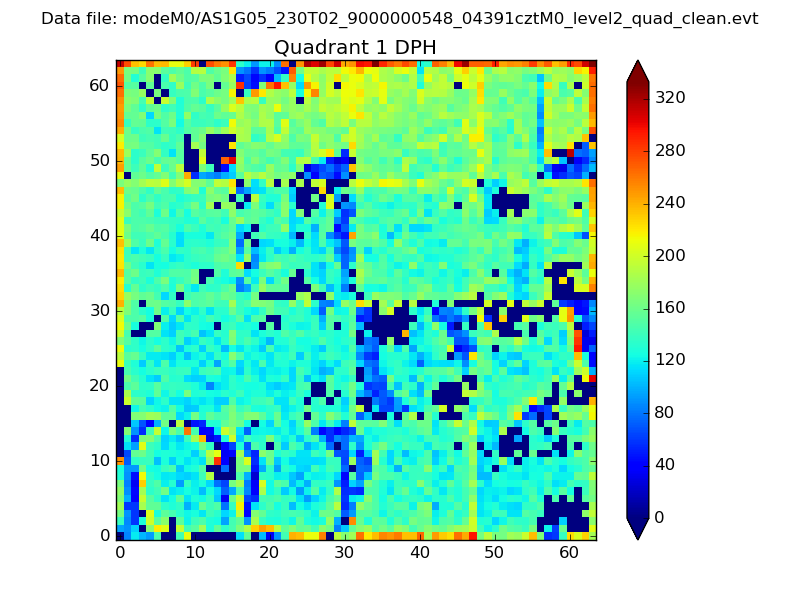
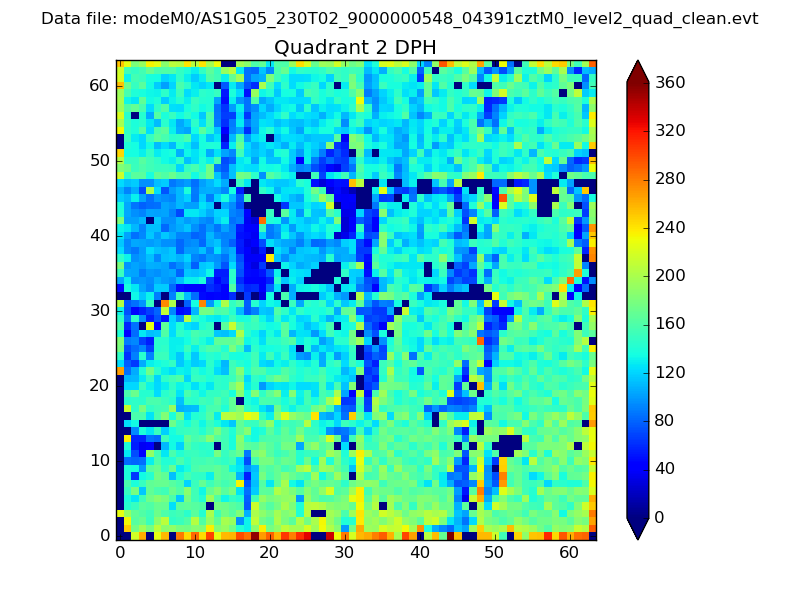
Histogram calculated using DETX and DETY for each event in the final _common_clean file
| Quadrant A | 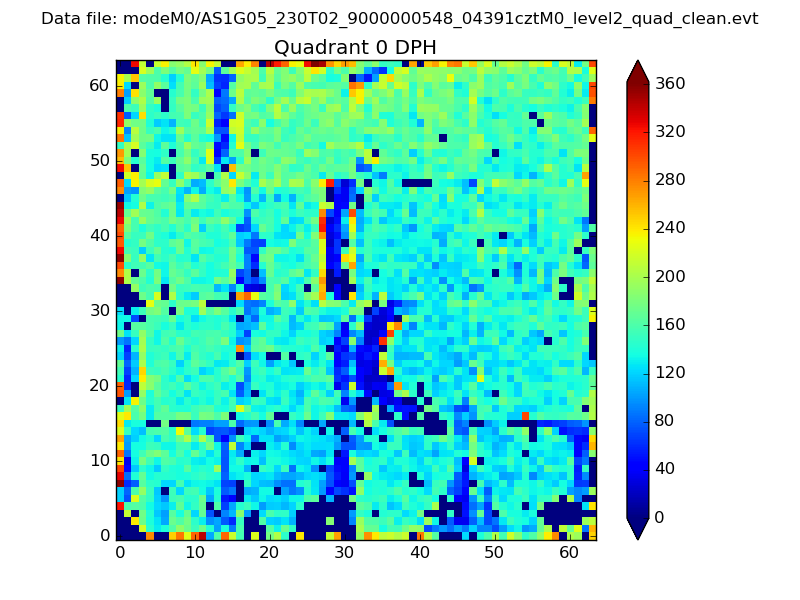 |
 |
Quadrant B |
|---|---|---|---|
| Quadrant D | 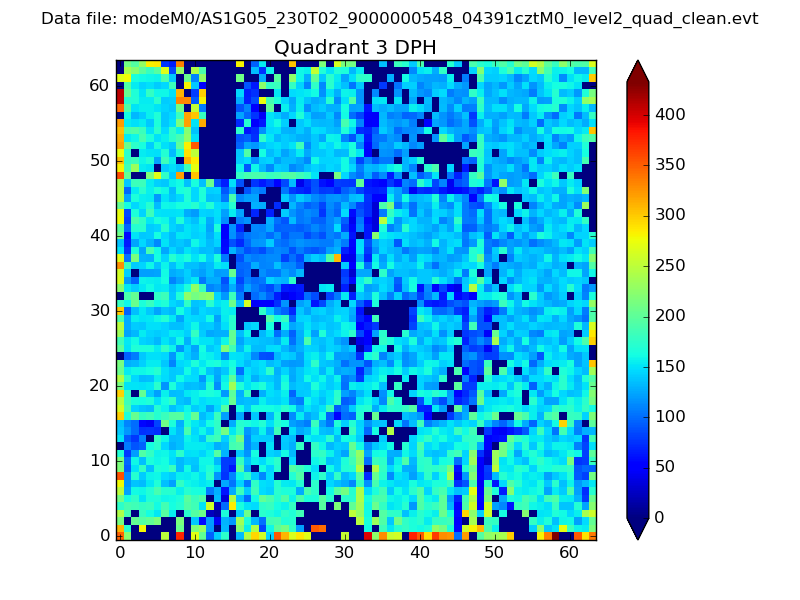 |
 |
Quadrant C |
| Plot type | Count rate plots | Images |
|---|---|---|
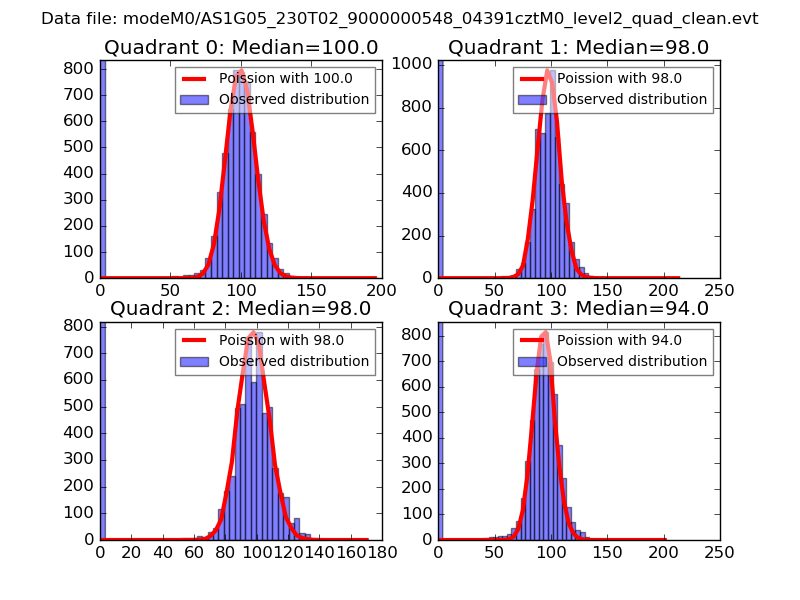
| Comparison with Poisson distribution Blue bars denote a histogram of data divided into 1 sec bins. Red curve is a Poisson curve with rate = median count rate of data. |
 |
 |
| Quadrant-wise count rates Data is divided into 100 sec bins |
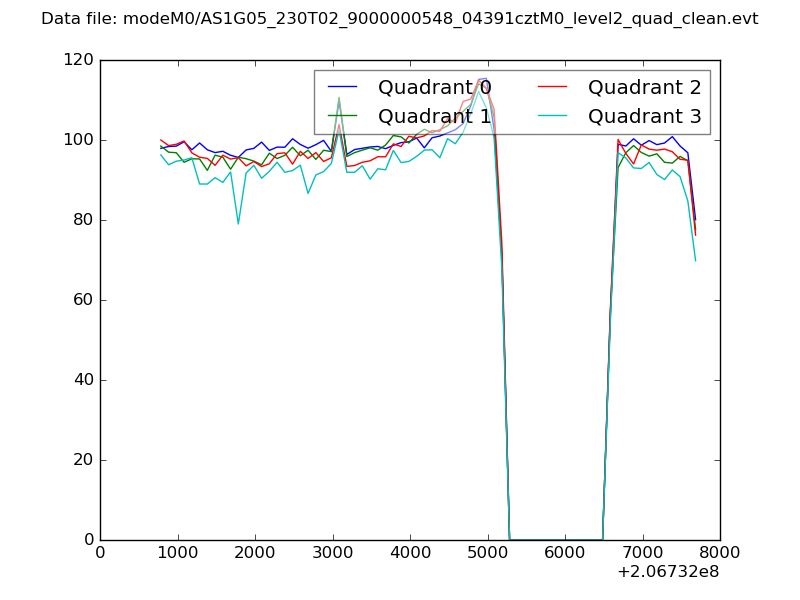 |
|
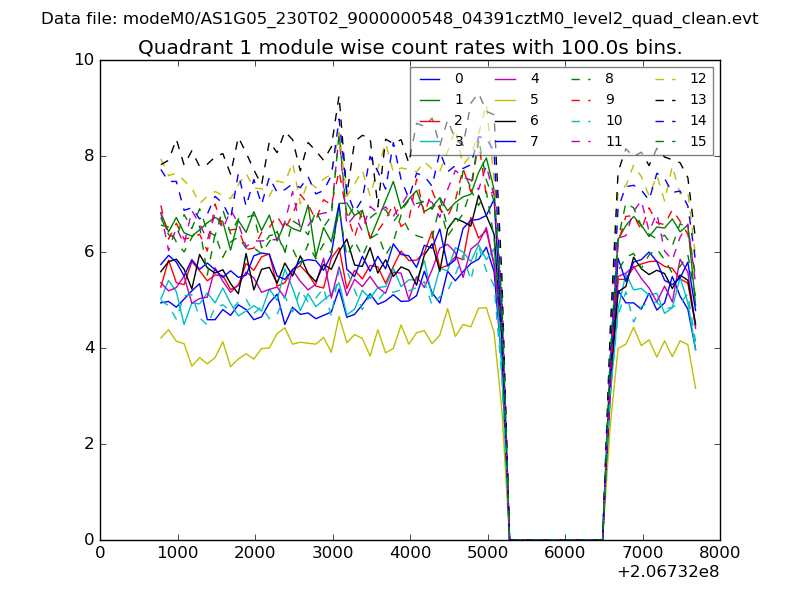
| Module-wise count rates for Quadrant A Data is divided into 100 sec bins |
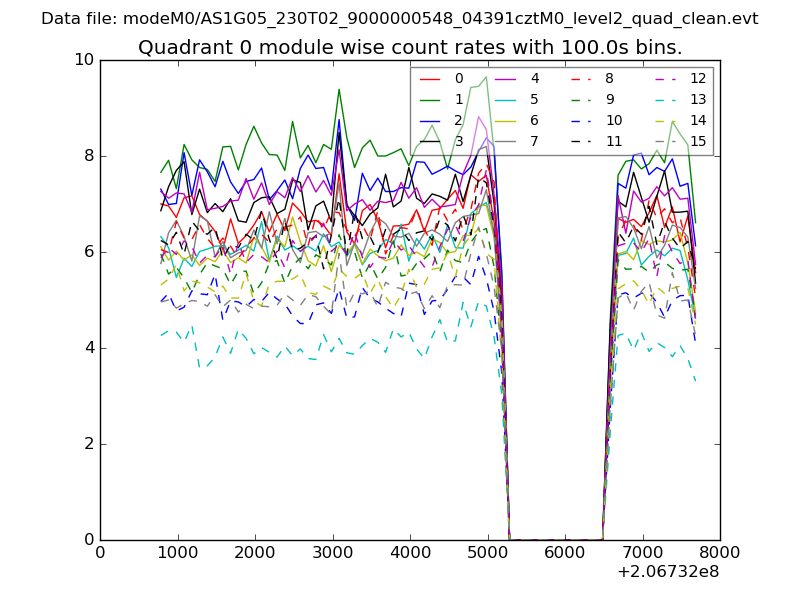 |
 |
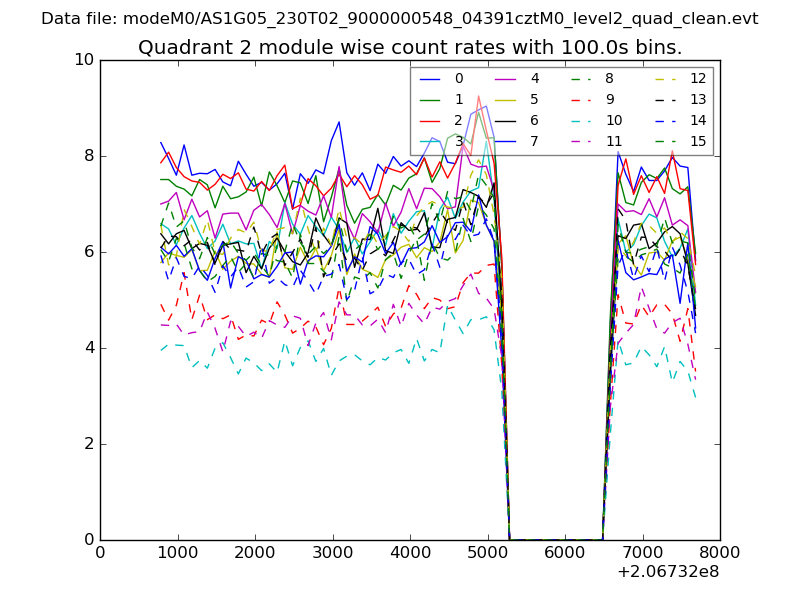
| Module-wise count rates for Quadrant B Data is divided into 100 sec bins |
 |
 |
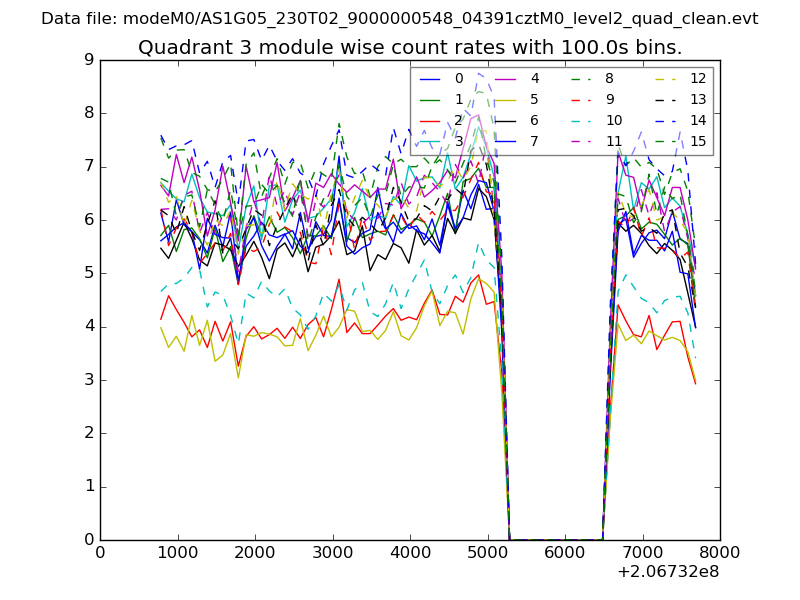
| Module-wise count rates for Quadrant C Data is divided into 100 sec bins |
 |
 |
| Module-wise count rates for Quadrant D Data is divided into 100 sec bins |
 |
 |
| Parameter | Plot |
|---|---|
| CZT HV Monitor | 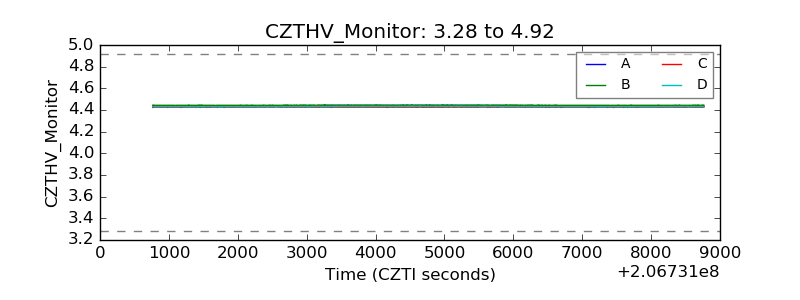 |
| D_VDD | 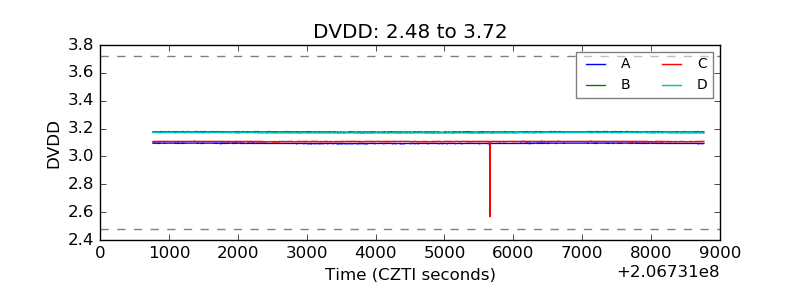 |
| Temperature 1 | 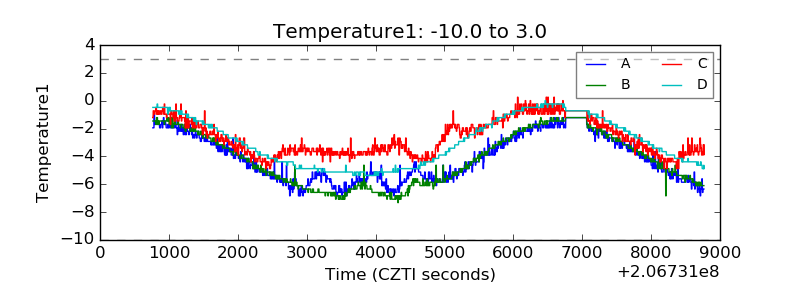 |
| Veto HV Monitor | 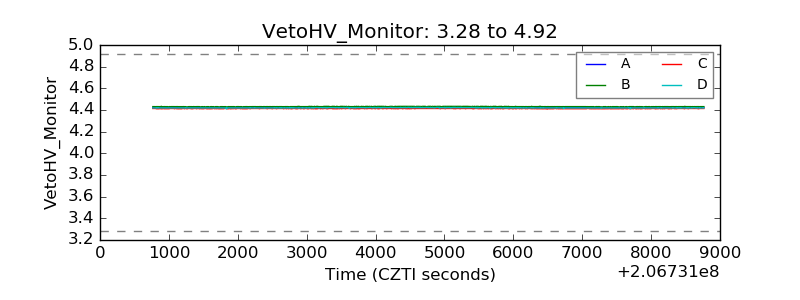 |
| Veto LLD | 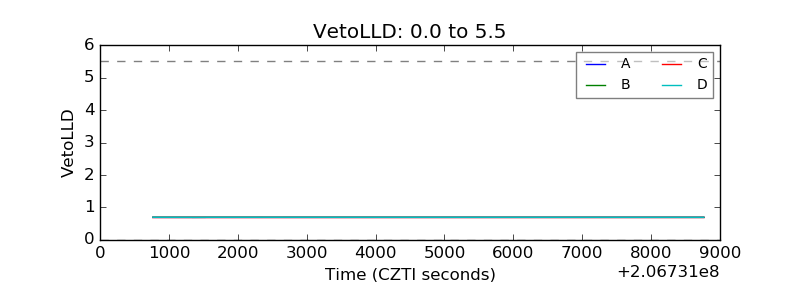 |
| Alpha Counter | 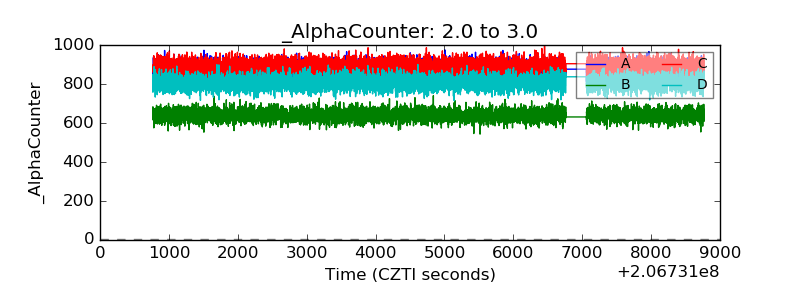 |
| _CPM_Rate | 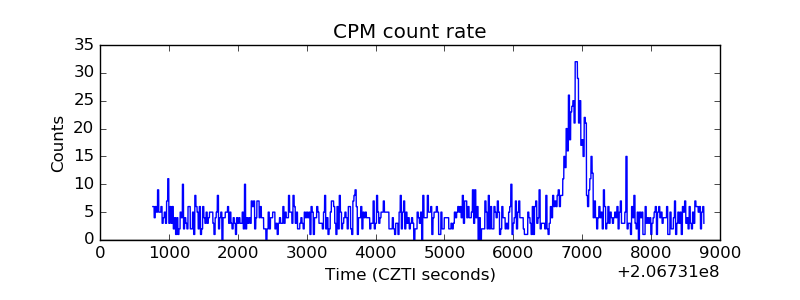 |
| CZT Counter | 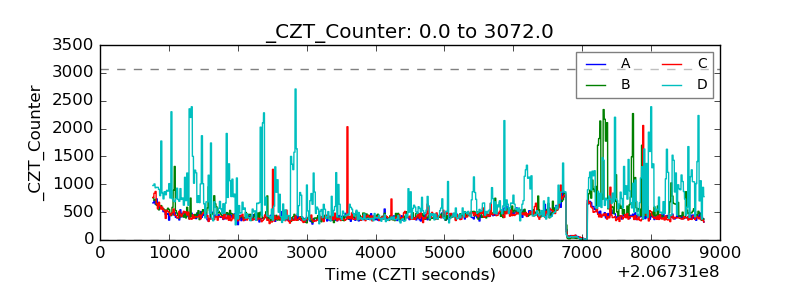 |
| +2.5 Volts monitor |  |
| +5 Volts monitor |  |
| _ROLL_ROT | 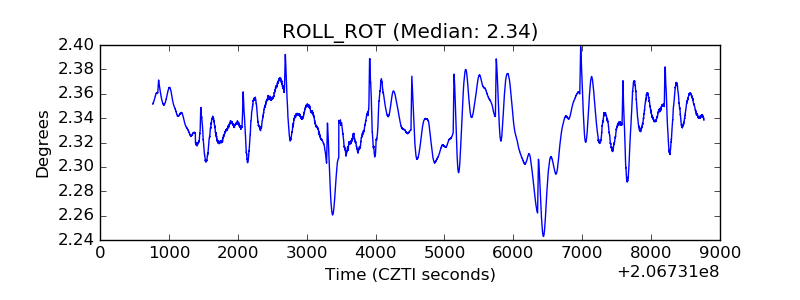 |
| _Roll_DEC | 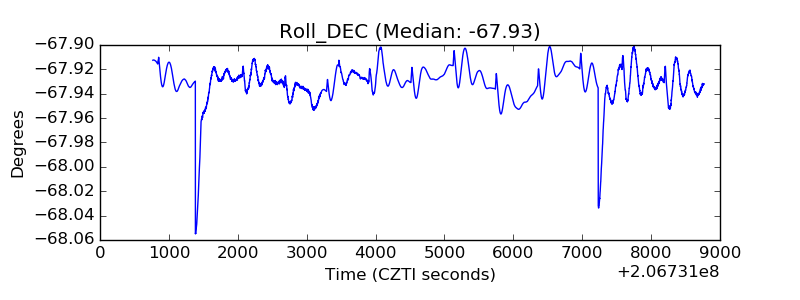 |
| _Roll_RA | 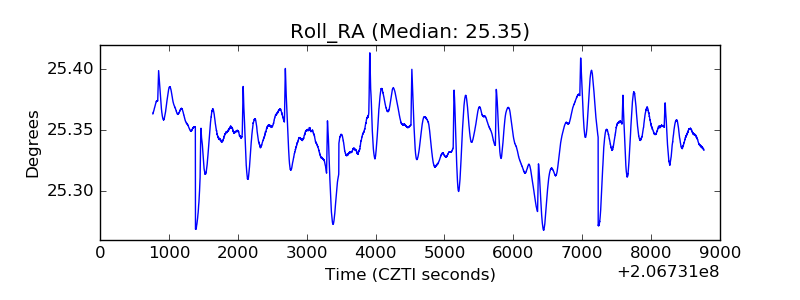 |
| Veto Counter | 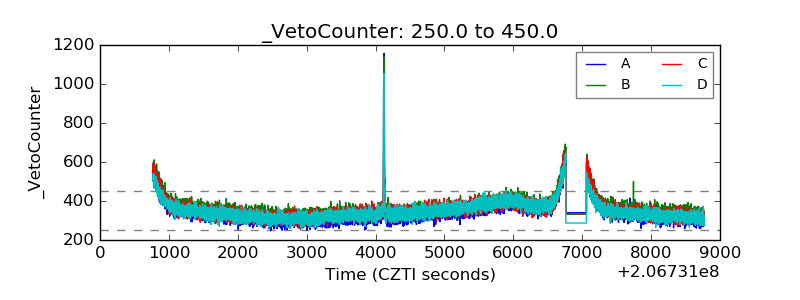 |