| Param | Original file | Final file |
|---|---|---|
| Filename | modeM0/AS1G05_230T02_9000000548_04395cztM0_level2.evt | modeM0/AS1G05_230T02_9000000548_04395cztM0_level2_quad_clean.evt |
| Size (bytes) | 294,439,680 | 53,311,680 |
| Size | 280.8 MB | 50.8 MB |
| Events in quadrant A | 1,670,727 | 340,605 |
| Events in quadrant B | 2,188,125 | 333,344 |
| Events in quadrant C | 1,727,879 | 333,488 |
| Events in quadrant D | 3,053,457 | 320,541 |
| Mode M9 | |||
|---|---|---|---|
| Quadrant | BADHDUFLAG | Total packets | Discarded packets |
| A | 0 | 2 | 0 |
| B | 0 | 2 | 0 |
| C | 0 | 2 | 0 |
| D | 0 | 2 | 0 |
| Mode SS | |||
|---|---|---|---|
| Quadrant | BADHDUFLAG | Total packets | Discarded packets |
| A | 0 | 82 | 0 |
| B | 0 | 82 | 0 |
| C | 0 | 82 | 0 |
| D | 0 | 82 | 0 |
| Mode M0 | |||
|---|---|---|---|
| Quadrant | BADHDUFLAG | Total packets | Discarded packets |
| A | 0 | 8207 | 4 |
| B | 0 | 9531 | 1 |
| C | 0 | 8365 | 1 |
| D | 0 | 12073 | 1 |
| Quadrant | Total seconds | Saturated seconds | Saturation percentage |
|---|---|---|---|
| A | 4053 | 20 | 0.493462% |
| B | 4054 | 99 | 2.442033% |
| C | 4054 | 19 | 0.468673% |
| D | 4054 | 85 | 2.096695% |
Noise dominated data is calculated using 1-second bins in cleaned event files. If a bin has >2000 counts, and if more than 50% of those come from <1% of pixels, then it is considered to be noise-dominated and hence unusable.
| Quadrant | # 1 sec bins | Bins with >0 counts | Bins with >2000 counts | High rate bins dominated by noise | Noise dominated (total time) | Noise dominated (detector-on time) | Marked lightcurve |
|---|---|---|---|---|---|---|---|
| A | 4054 | 4054 | 0 | 0 | 0.00% | 0.00% | 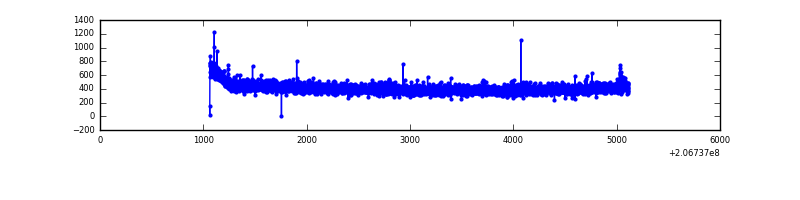 |
| B | 4054 | 4054 | 49 | 49 | 1.21% | 1.21% | 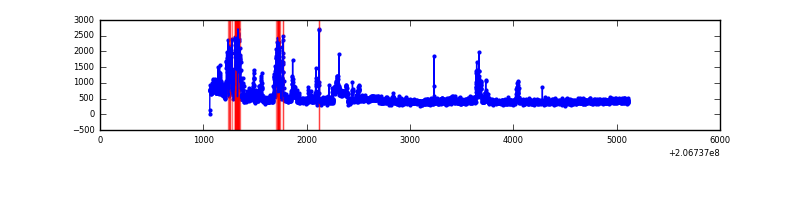 |
| C | 4054 | 4054 | 10 | 10 | 0.25% | 0.25% | 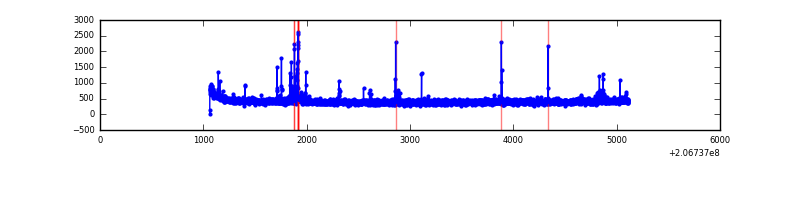 |
| D | 4054 | 4054 | 57 | 57 | 1.41% | 1.41% | 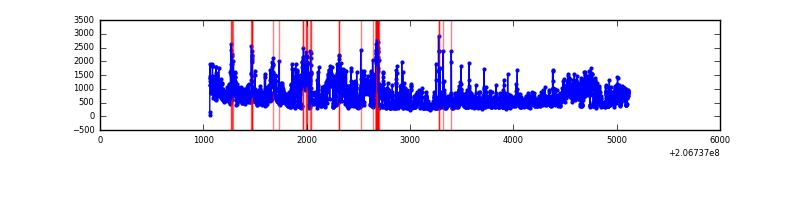 |
Top three noisy pixels from each quadrant. If the there are fewer than three noisy pixels in the level2.evt file, extra rows are filled as -1
| Pixel properties | Quadrant properties | ||||||
|---|---|---|---|---|---|---|---|
| Quadrant | DetID | PixID | Counts | Sigma | Mean | Median | Sigma |
| A | 8 | 15 | 6948 | 72.44 | 428 | 417 | 90.2 |
| A | 13 | 14 | 5762 | 59.29 | 428 | 417 | 90.2 |
| A | 12 | 194 | 4468 | 44.93 | 428 | 417 | 90.2 |
| B | 14 | 167 | 419386 | 4980.38 | 433 | 423 | 84.1 |
| B | 10 | 16 | 50962 | 600.78 | 433 | 423 | 84.1 |
| B | 0 | 187 | 22943 | 267.7 | 433 | 423 | 84.1 |
| C | 14 | 48 | 45213 | 457.7 | 418 | 419 | 97.9 |
| C | 9 | 16 | 25469 | 255.96 | 418 | 419 | 97.9 |
| C | 9 | 247 | 13493 | 133.59 | 418 | 419 | 97.9 |
| D | 2 | 63 | 1177522 | 11654.58 | 410 | 397 | 101.0 |
| D | 9 | 35 | 122185 | 1205.81 | 410 | 397 | 101.0 |
| D | 12 | 233 | 54664 | 537.29 | 410 | 397 | 101.0 |
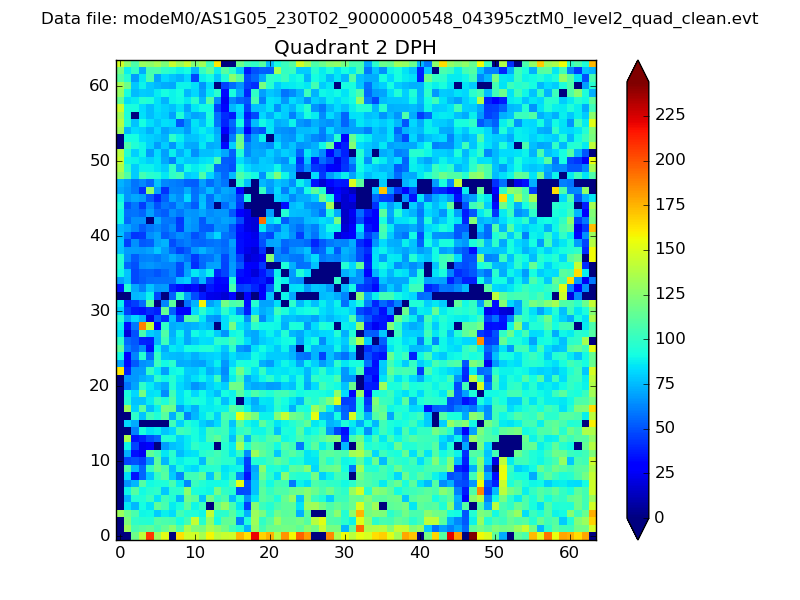
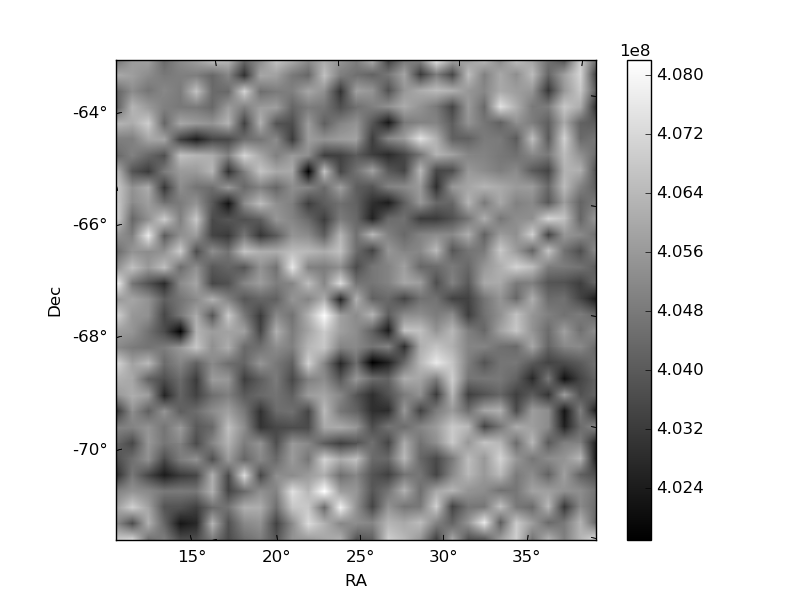
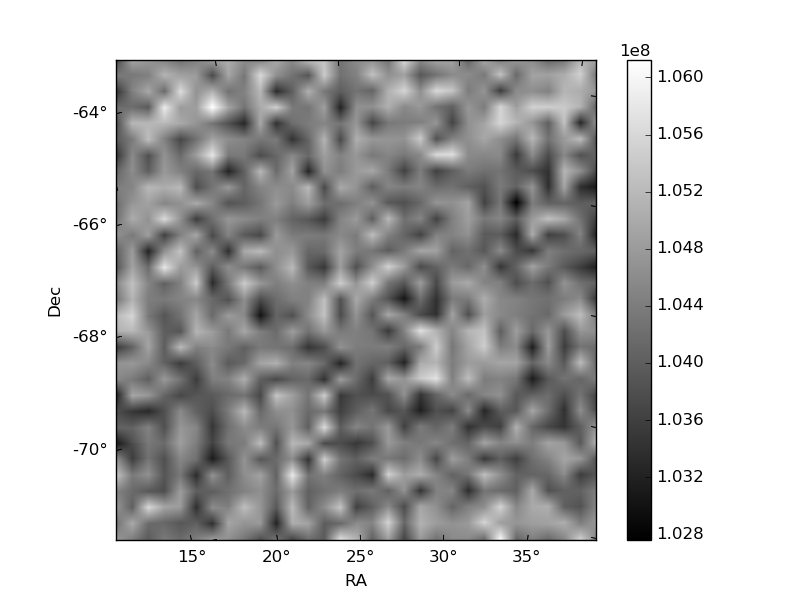
Histogram calculated using DETX and DETY for each event in the final _common_clean file
| Quadrant A | 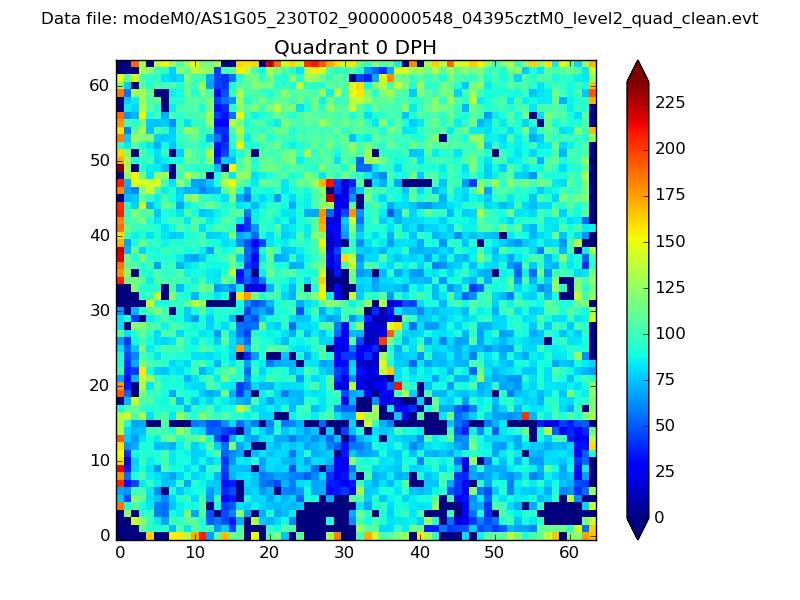 |
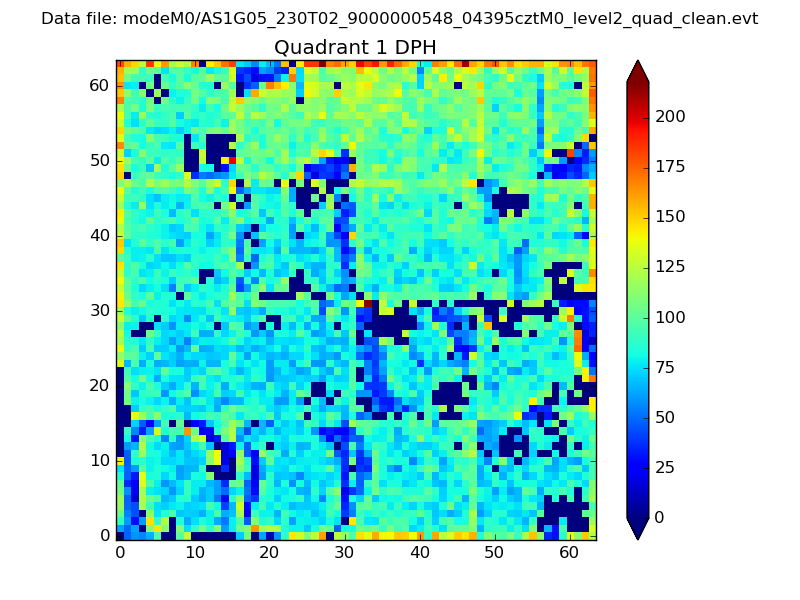 |
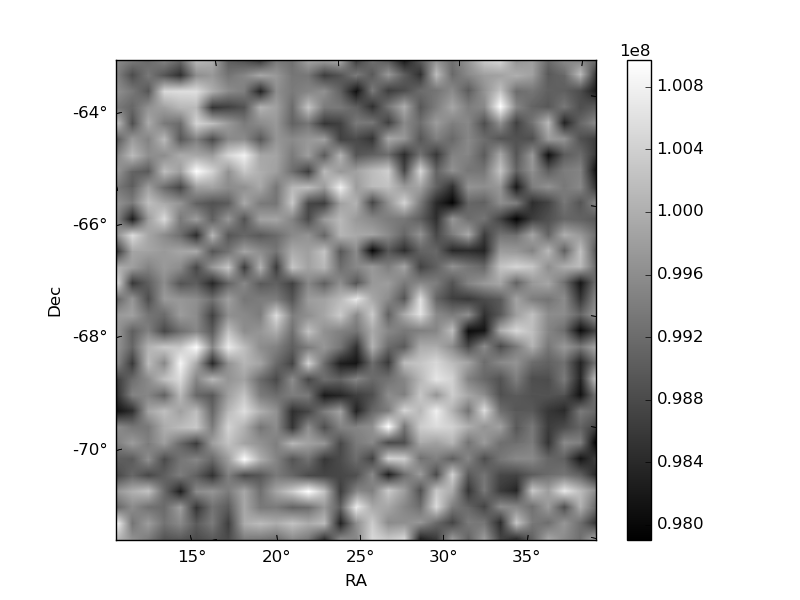
Quadrant B |
|---|---|---|---|
| Quadrant D | 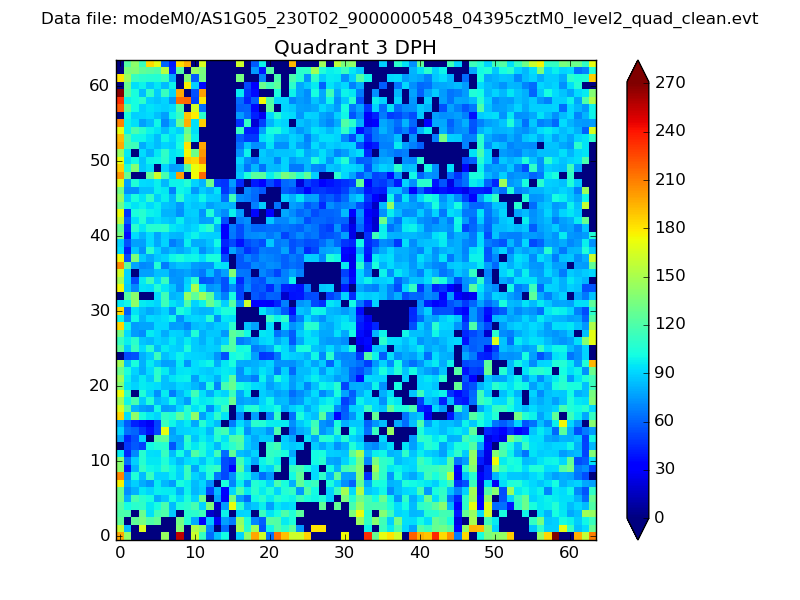 |
 |
Quadrant C |
| Plot type | Count rate plots | Images |
|---|---|---|
| Comparison with Poisson distribution Blue bars denote a histogram of data divided into 1 sec bins. Red curve is a Poisson curve with rate = median count rate of data. |
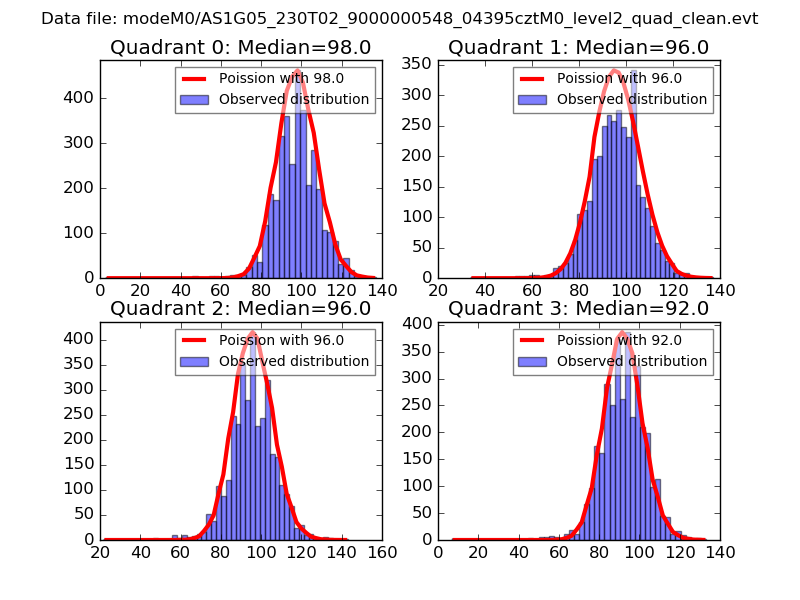 |
 |
| Quadrant-wise count rates Data is divided into 100 sec bins |
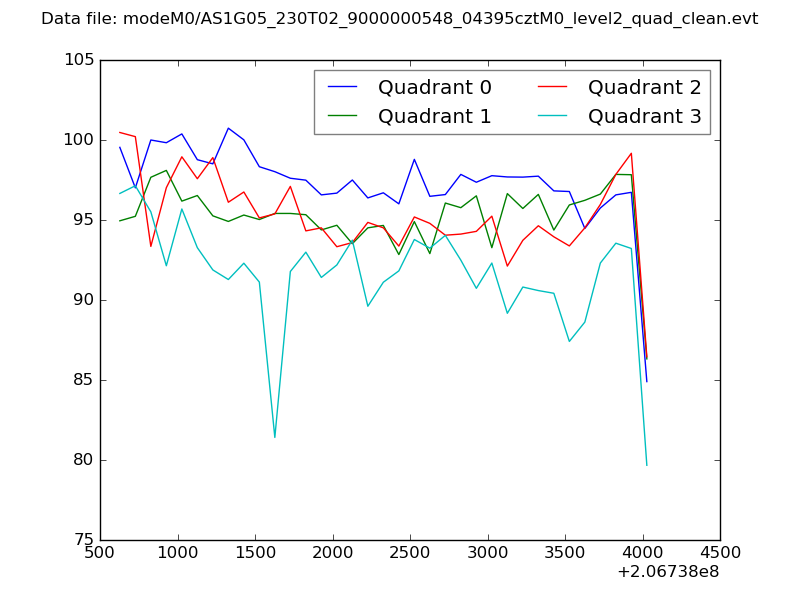 |
|
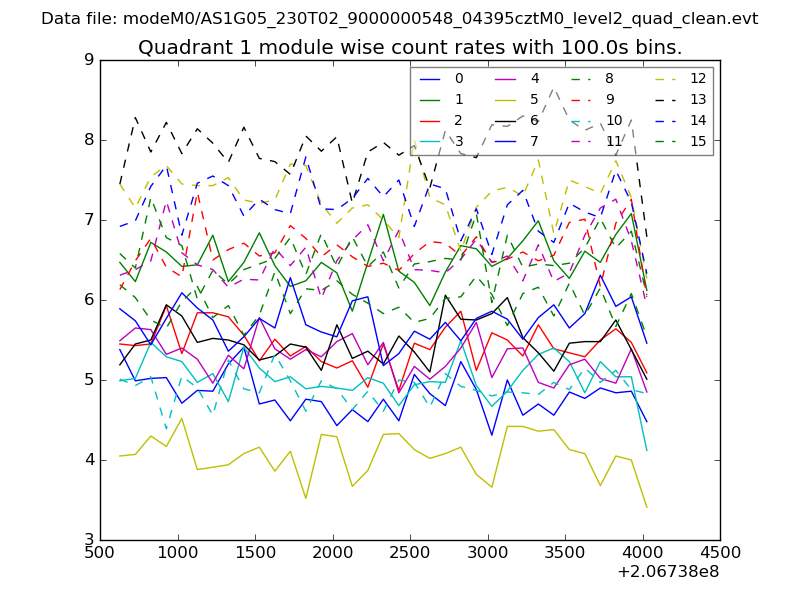
| Module-wise count rates for Quadrant A Data is divided into 100 sec bins |
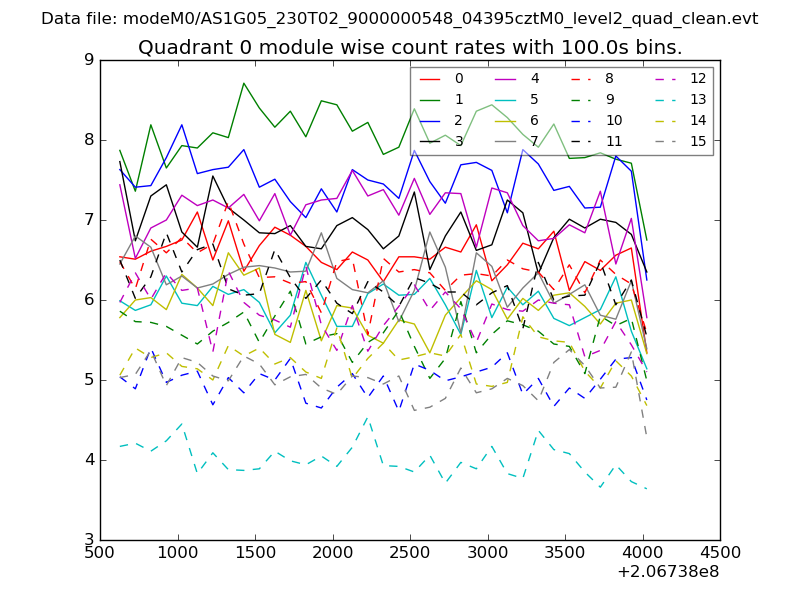 |
 |
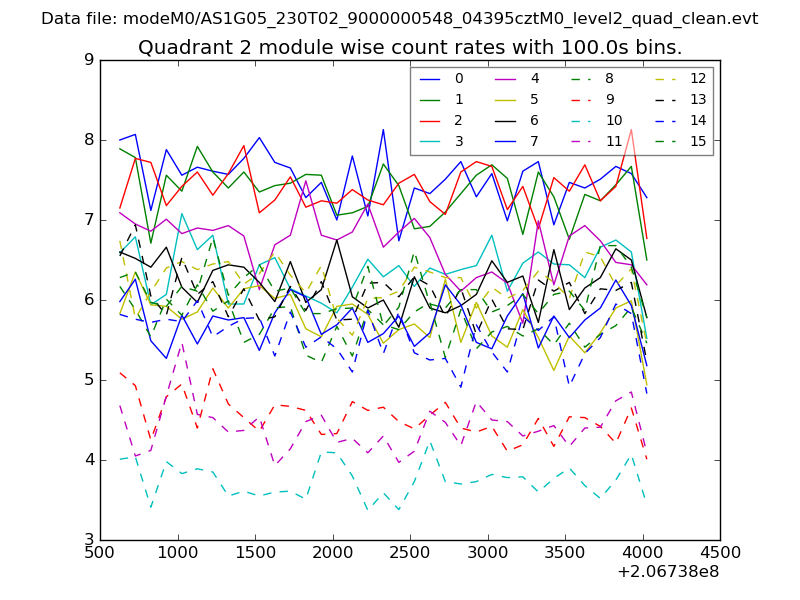
| Module-wise count rates for Quadrant B Data is divided into 100 sec bins |
 |
 |
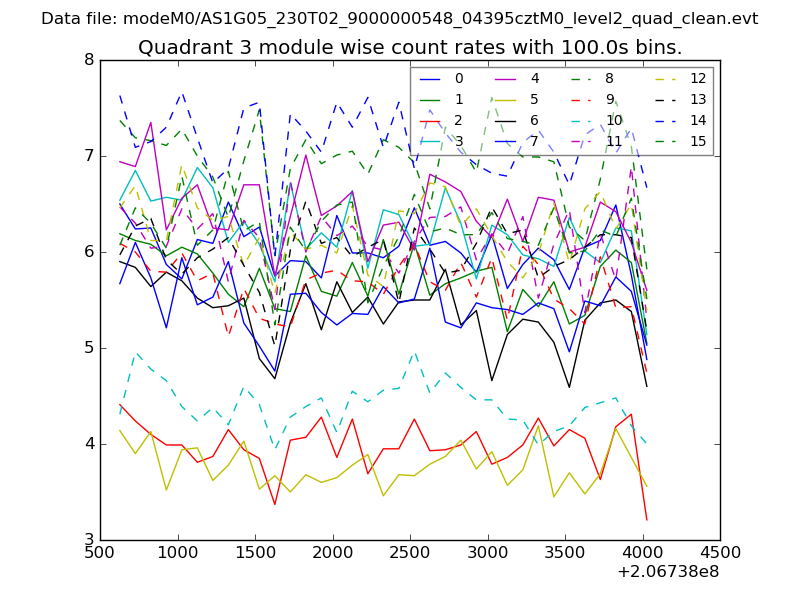
| Module-wise count rates for Quadrant C Data is divided into 100 sec bins |
 |
 |
| Module-wise count rates for Quadrant D Data is divided into 100 sec bins |
 |
 |
| Parameter | Plot |
|---|---|
| CZT HV Monitor | 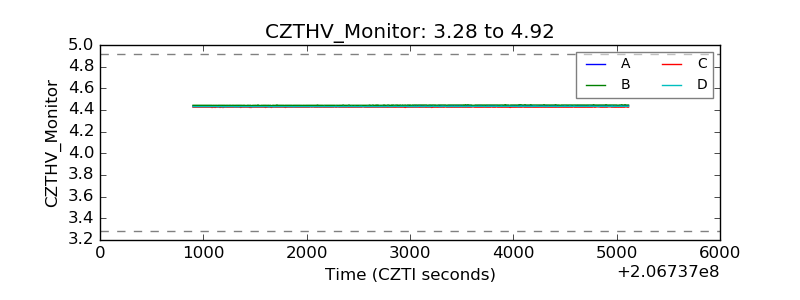 |
| D_VDD | 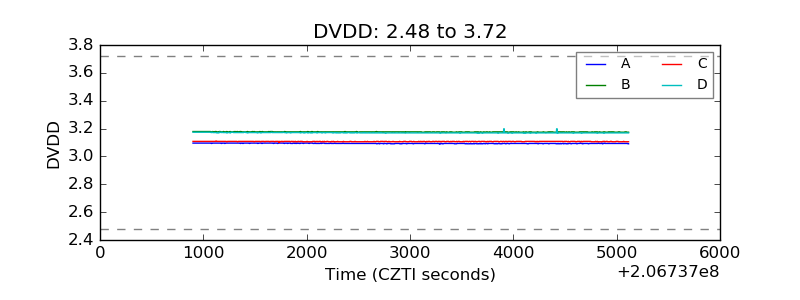 |
| Temperature 1 | 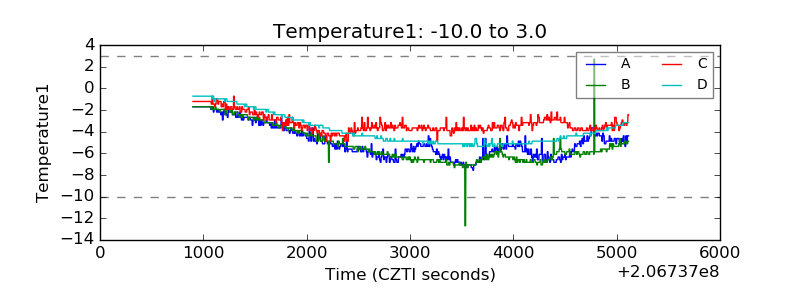 |
| Veto HV Monitor | 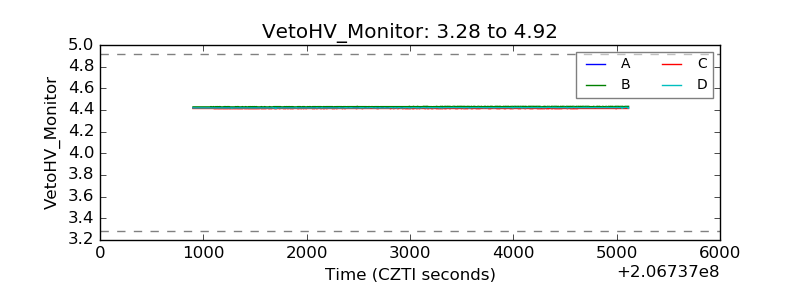 |
| Veto LLD |  |
| Alpha Counter | 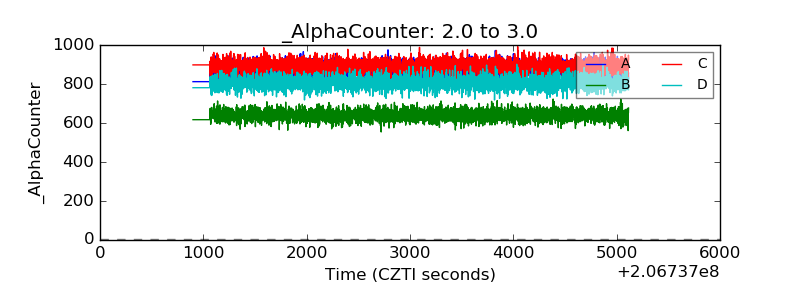 |
| _CPM_Rate | 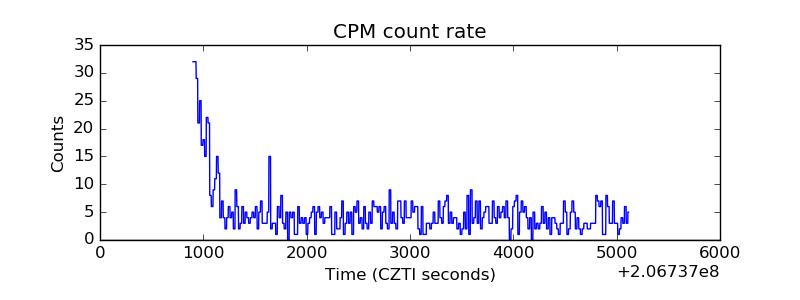 |
| CZT Counter | 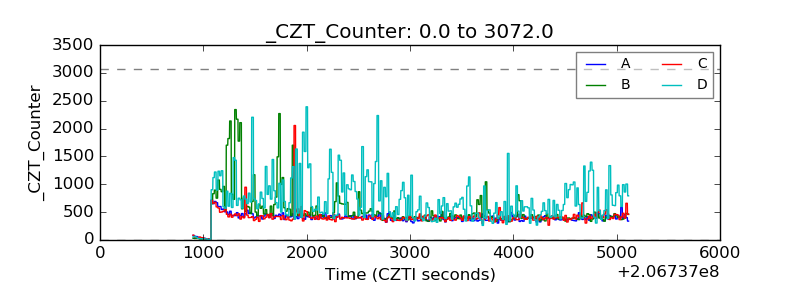 |
| +2.5 Volts monitor |  |
| +5 Volts monitor |  |
| _ROLL_ROT | 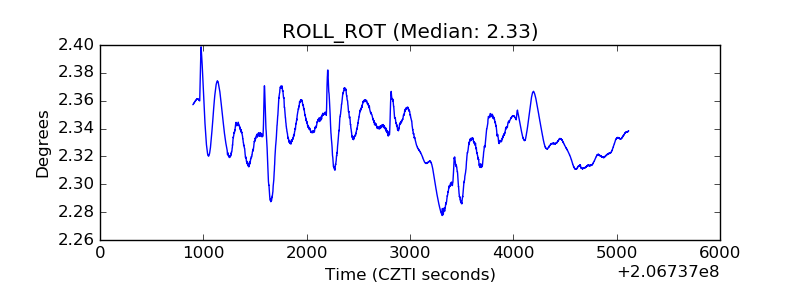 |
| _Roll_DEC | 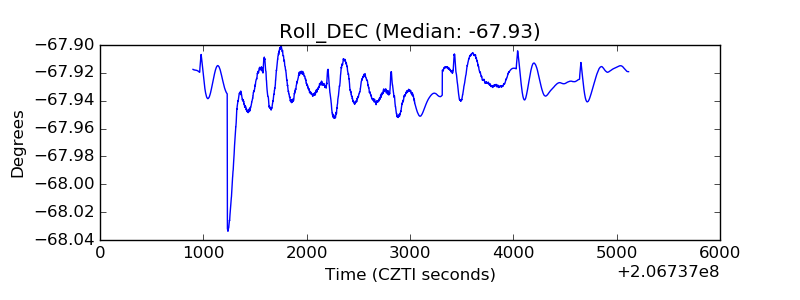 |
| _Roll_RA | 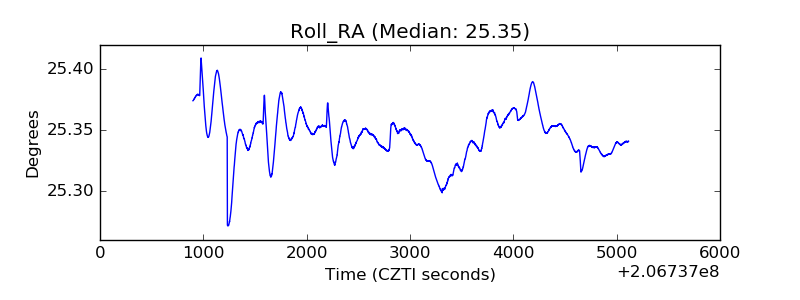 |
| Veto Counter | 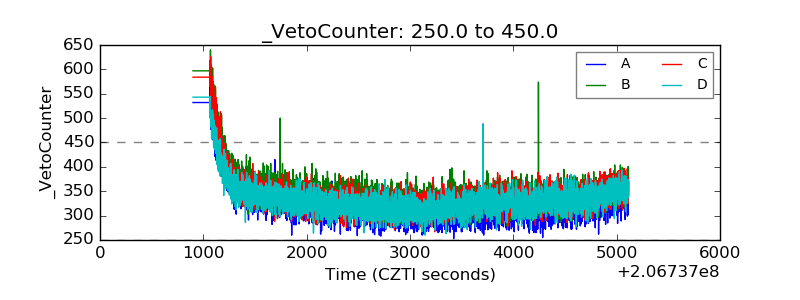 |