| Param | Original file | Final file |
|---|---|---|
| Filename | modeM0/AS1G05_230T02_9000000548_04398cztM0_level2.evt | modeM0/AS1G05_230T02_9000000548_04398cztM0_level2_quad_clean.evt |
| Size (bytes) | 1,145,082,240 | 215,213,760 |
| Size | 1.1 GB | 205.2 MB |
| Events in quadrant A | 7,572,662 | 1,351,034 |
| Events in quadrant B | 7,835,632 | 1,364,745 |
| Events in quadrant C | 9,125,969 | 1,332,442 |
| Events in quadrant D | 8,996,195 | 1,299,683 |
| Mode M9 | |||
|---|---|---|---|
| Quadrant | BADHDUFLAG | Total packets | Discarded packets |
| A | 0 | 35 | 0 |
| B | 0 | 35 | 0 |
| C | 0 | 35 | 0 |
| D | 0 | 36 | 0 |
| Mode SS | |||
|---|---|---|---|
| Quadrant | BADHDUFLAG | Total packets | Discarded packets |
| A | 0 | 346 | 0 |
| B | 0 | 346 | 0 |
| C | 0 | 346 | 0 |
| D | 0 | 346 | 0 |
| Mode M0 | |||
|---|---|---|---|
| Quadrant | BADHDUFLAG | Total packets | Discarded packets |
| A | 0 | 34626 | 5 |
| B | 0 | 35080 | 4 |
| C | 0 | 39078 | 4 |
| D | 0 | 39039 | 4 |
| Quadrant | Total seconds | Saturated seconds | Saturation percentage |
|---|---|---|---|
| A | 16968 | 91 | 0.536304% |
| B | 16968 | 86 | 0.506836% |
| C | 16968 | 449 | 2.646157% |
| D | 16968 | 400 | 2.357379% |
Noise dominated data is calculated using 1-second bins in cleaned event files. If a bin has >2000 counts, and if more than 50% of those come from <1% of pixels, then it is considered to be noise-dominated and hence unusable.
| Quadrant | # 1 sec bins | Bins with >0 counts | Bins with >2000 counts | High rate bins dominated by noise | Noise dominated (total time) | Noise dominated (detector-on time) | Marked lightcurve |
|---|---|---|---|---|---|---|---|
| A | 20193 | 16971 | 26 | 26 | 0.13% | 0.15% | 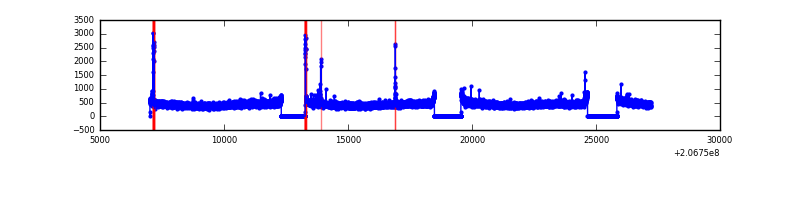 |
| B | 20193 | 16971 | 11 | 11 | 0.05% | 0.06% | 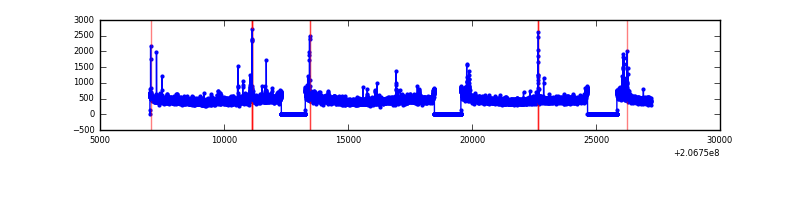 |
| C | 20193 | 16971 | 317 | 317 | 1.57% | 1.87% | 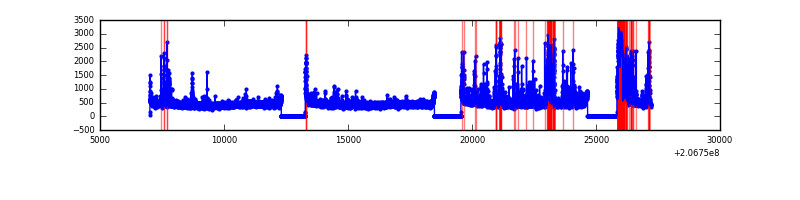 |
| D | 20193 | 16971 | 269 | 269 | 1.33% | 1.59% | 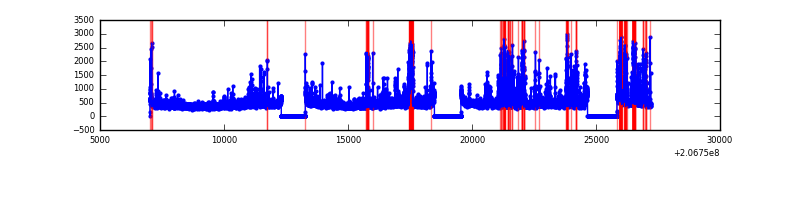 |
Top three noisy pixels from each quadrant. If the there are fewer than three noisy pixels in the level2.evt file, extra rows are filled as -1
| Pixel properties | Quadrant properties | ||||||
|---|---|---|---|---|---|---|---|
| Quadrant | DetID | PixID | Counts | Sigma | Mean | Median | Sigma |
| A | 0 | 50 | 79489 | 199.1 | 1920 | 1875 | 389.8 |
| A | 8 | 15 | 39647 | 96.9 | 1920 | 1875 | 389.8 |
| A | 15 | 234 | 32080 | 77.48 | 1920 | 1875 | 389.8 |
| B | 14 | 167 | 144423 | 389.96 | 1941 | 1892 | 365.5 |
| B | 10 | 16 | 98379 | 263.99 | 1941 | 1892 | 365.5 |
| B | 12 | 111 | 31025 | 79.71 | 1941 | 1892 | 365.5 |
| C | 9 | 247 | 1131938 | 2635.12 | 1871 | 1880 | 428.8 |
| C | 9 | 16 | 506091 | 1175.74 | 1871 | 1880 | 428.8 |
| C | 14 | 48 | 112345 | 257.59 | 1871 | 1880 | 428.8 |
| D | 9 | 35 | 555403 | 1223.33 | 1877 | 1821 | 452.5 |
| D | 2 | 136 | 437341 | 962.43 | 1877 | 1821 | 452.5 |
| D | 2 | 37 | 368031 | 809.27 | 1877 | 1821 | 452.5 |
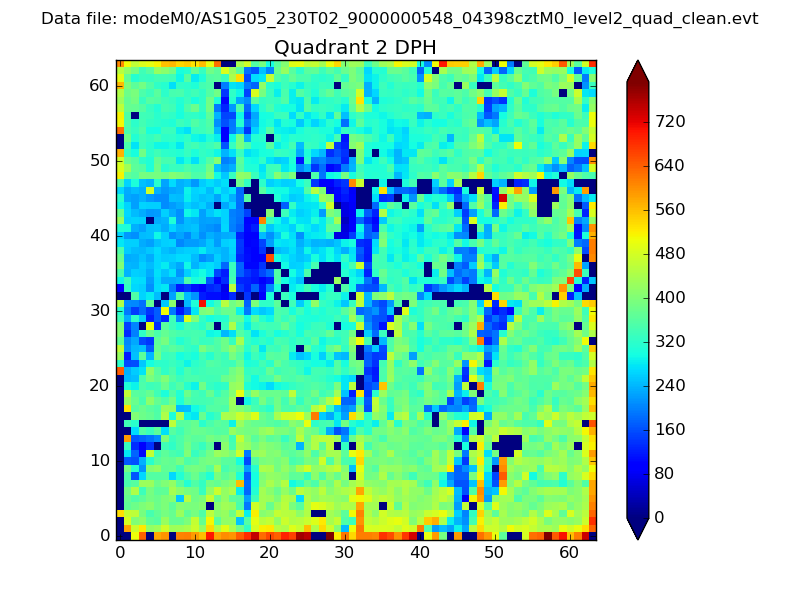
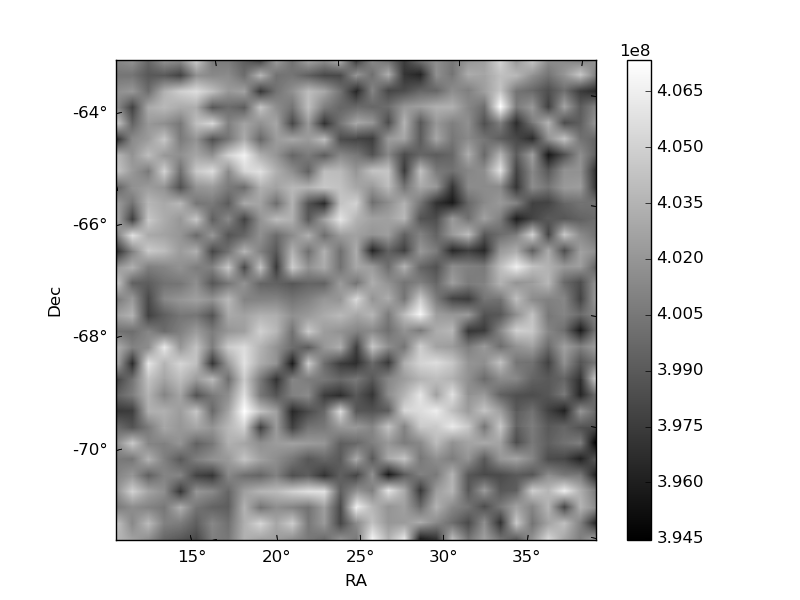
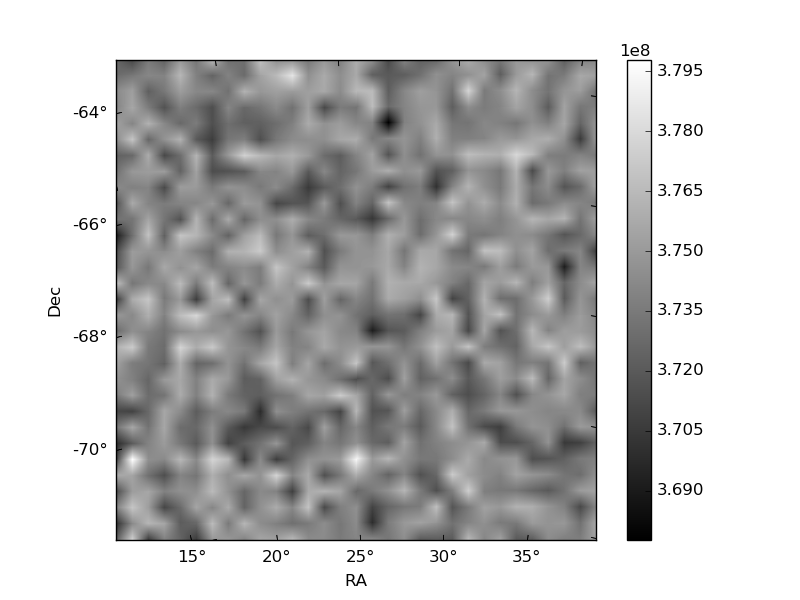
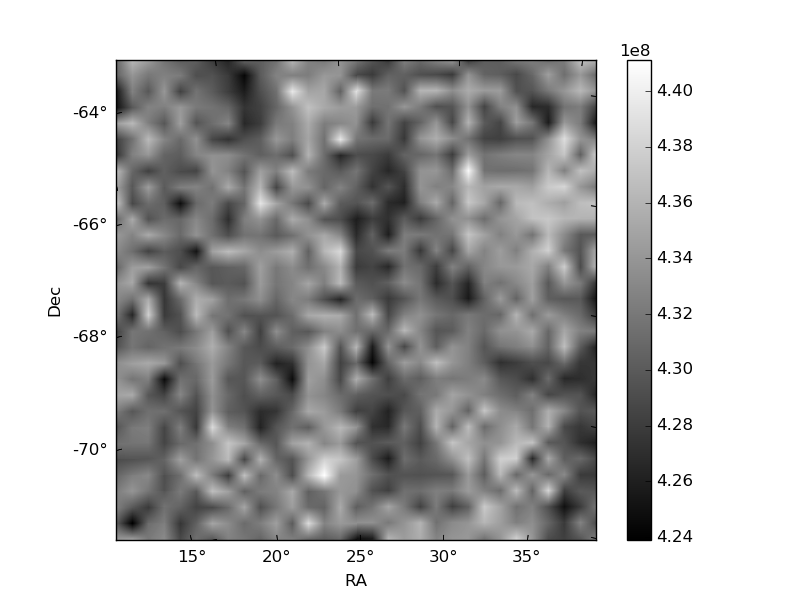
Histogram calculated using DETX and DETY for each event in the final _common_clean file
| Quadrant A | 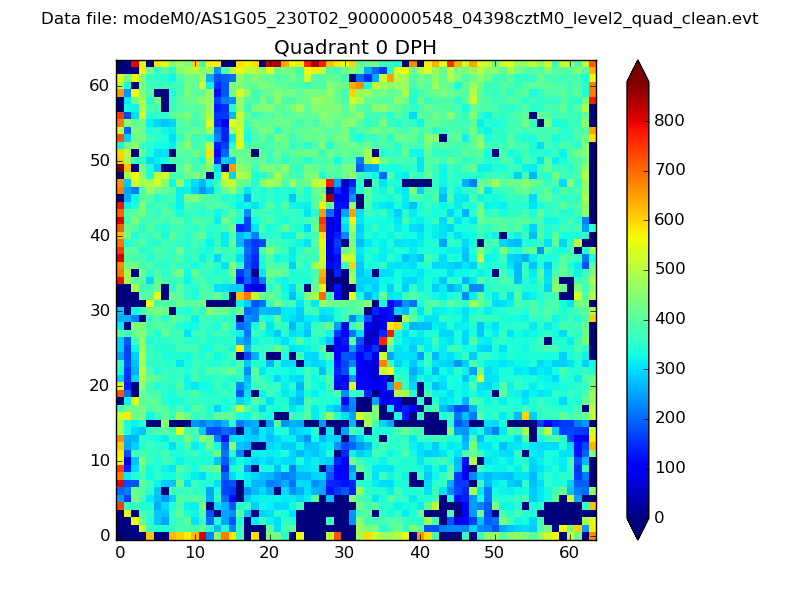 |
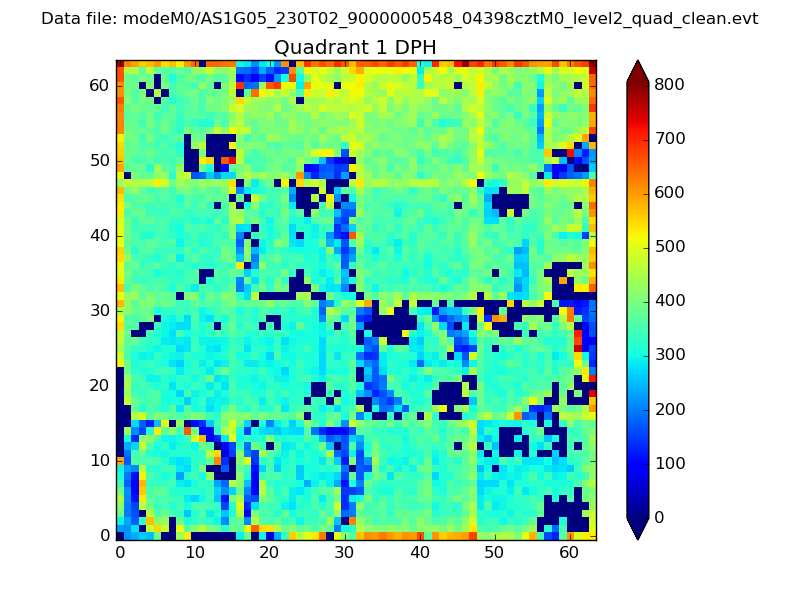 |
Quadrant B |
|---|---|---|---|
| Quadrant D | 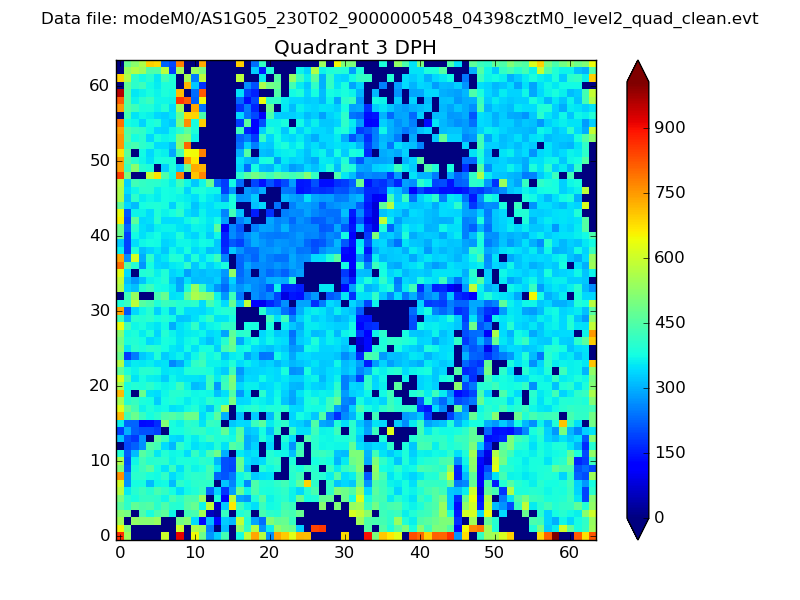 |
 |
Quadrant C |
| Plot type | Count rate plots | Images |
|---|---|---|
| Comparison with Poisson distribution Blue bars denote a histogram of data divided into 1 sec bins. Red curve is a Poisson curve with rate = median count rate of data. |
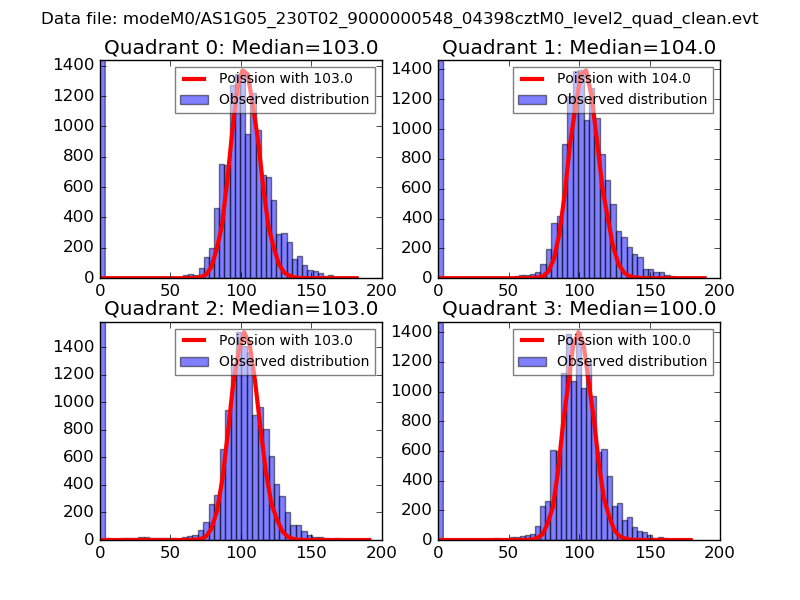 |
 |
| Quadrant-wise count rates Data is divided into 100 sec bins |
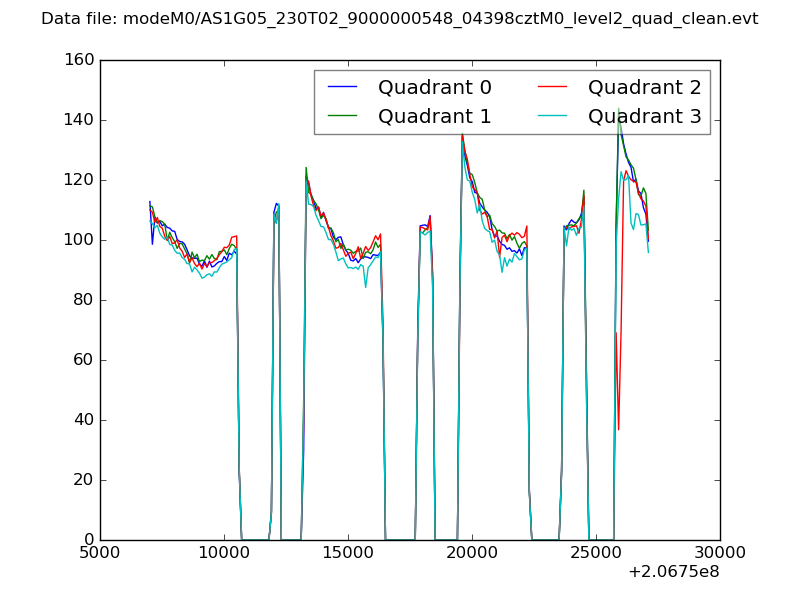 |
|
| Module-wise count rates for Quadrant A Data is divided into 100 sec bins |
 |
 |
| Module-wise count rates for Quadrant B Data is divided into 100 sec bins |
 |
 |
| Module-wise count rates for Quadrant C Data is divided into 100 sec bins |
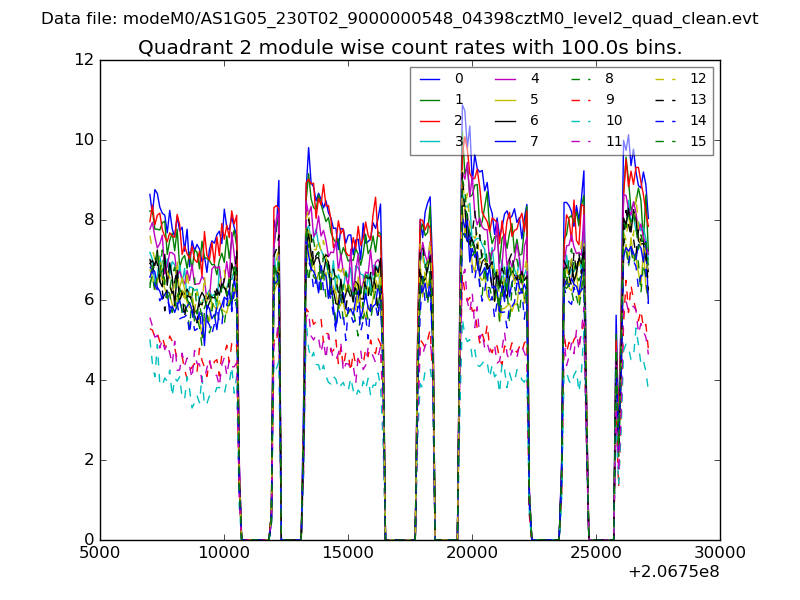 |
 |
| Module-wise count rates for Quadrant D Data is divided into 100 sec bins |
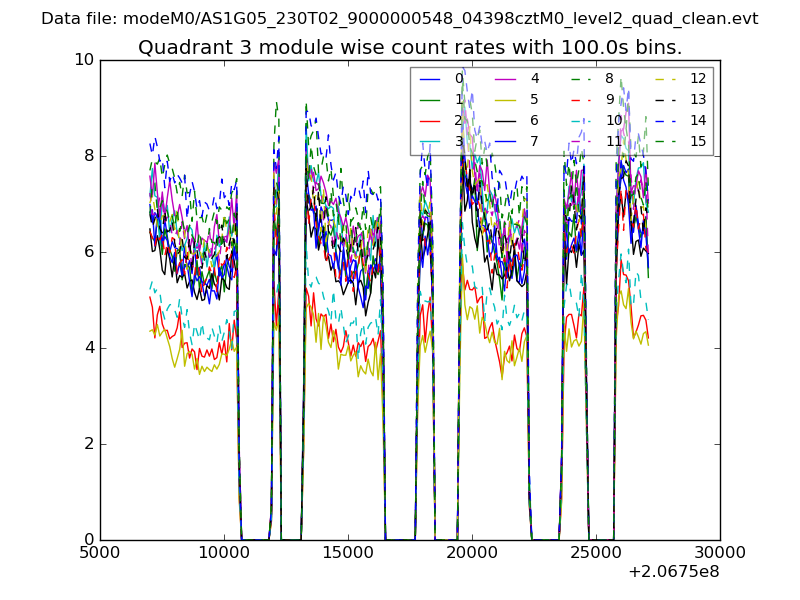 |
 |
| Parameter | Plot |
|---|---|
| CZT HV Monitor | 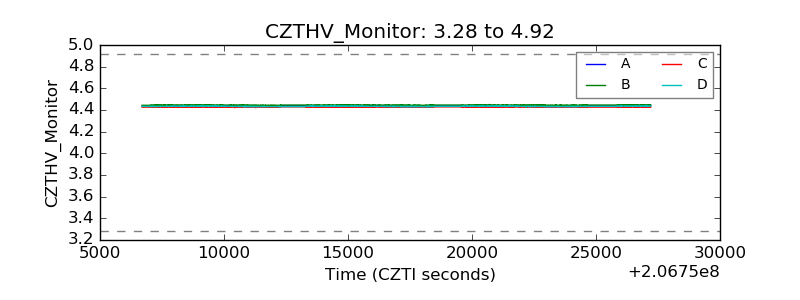 |
| D_VDD | 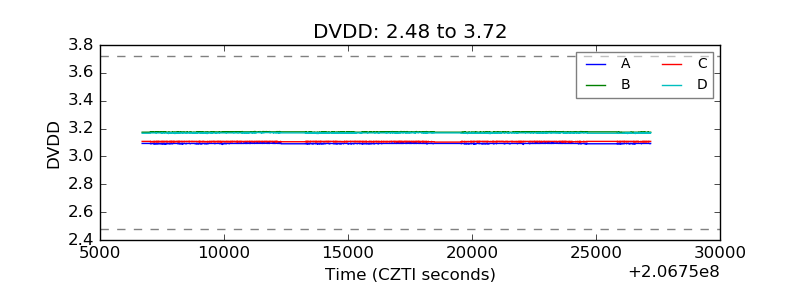 |
| Temperature 1 | 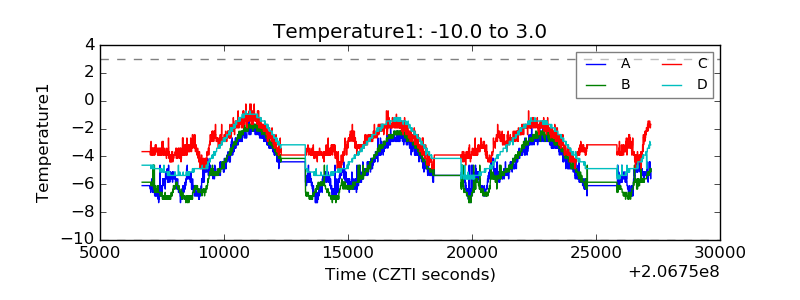 |
| Veto HV Monitor | 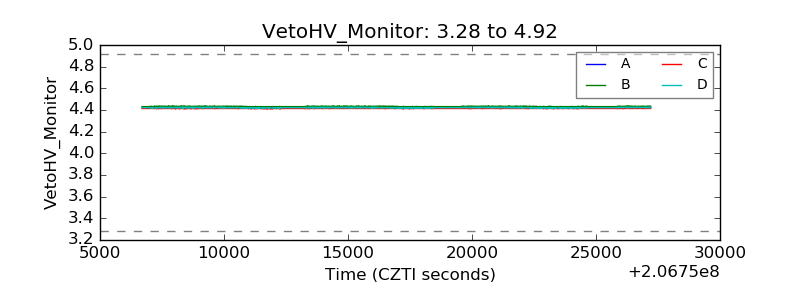 |
| Veto LLD | 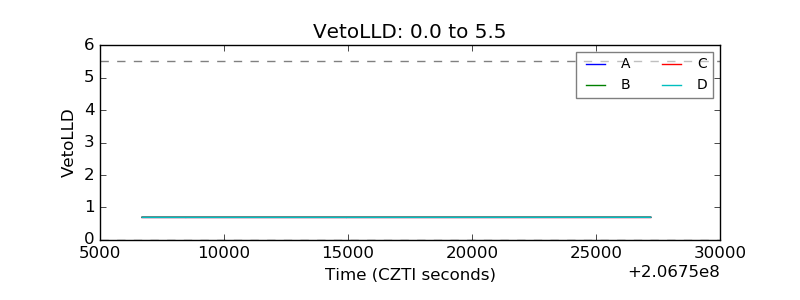 |
| Alpha Counter | 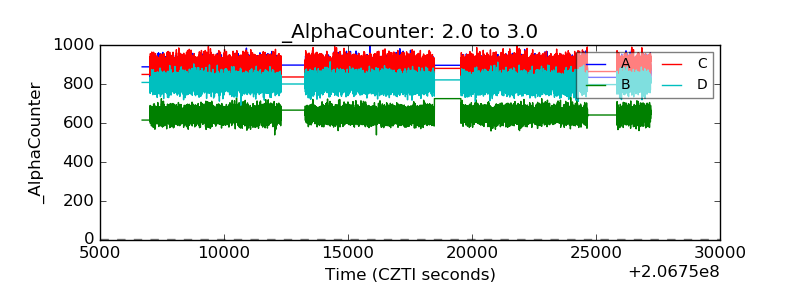 |
| _CPM_Rate | 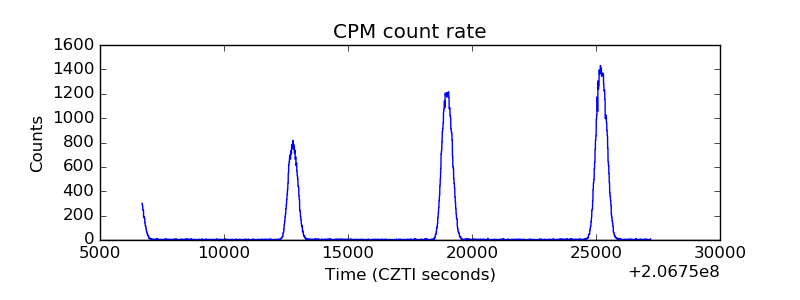 |
| CZT Counter | 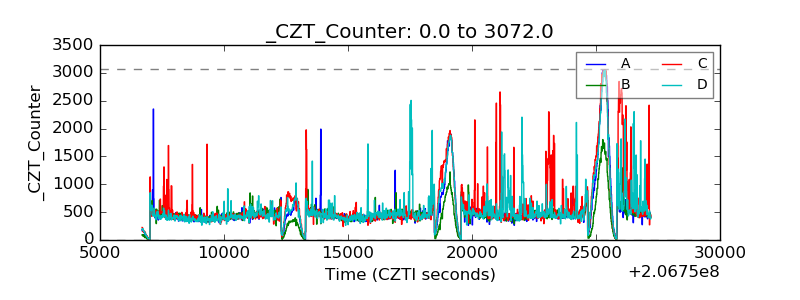 |
| +2.5 Volts monitor | 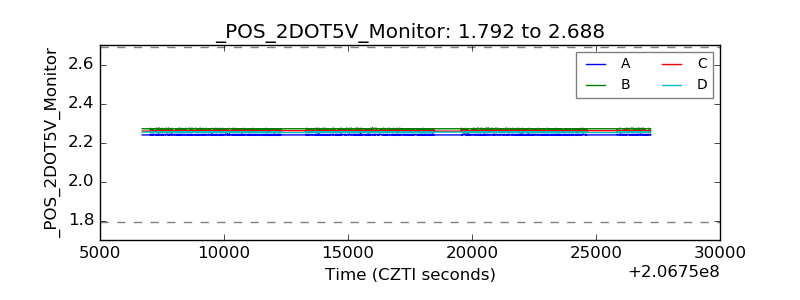 |
| +5 Volts monitor |  |
| _ROLL_ROT | 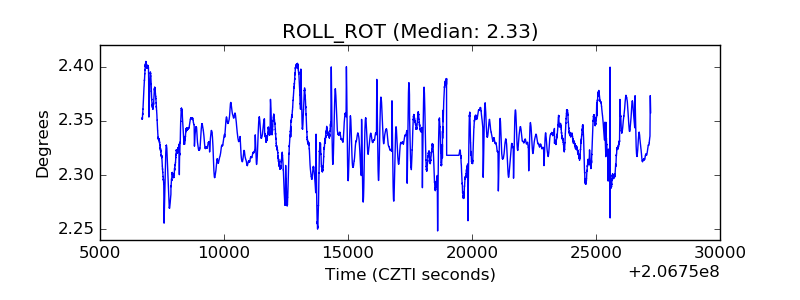 |
| _Roll_DEC | 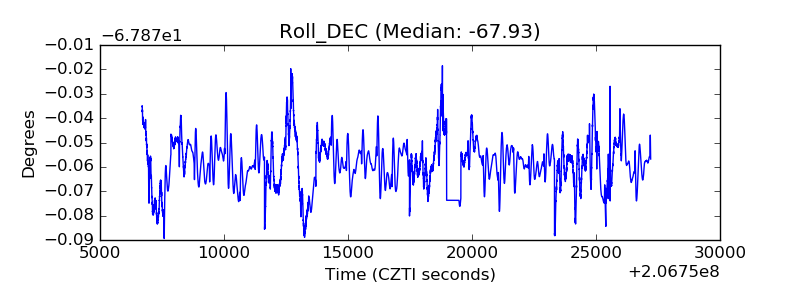 |
| _Roll_RA | 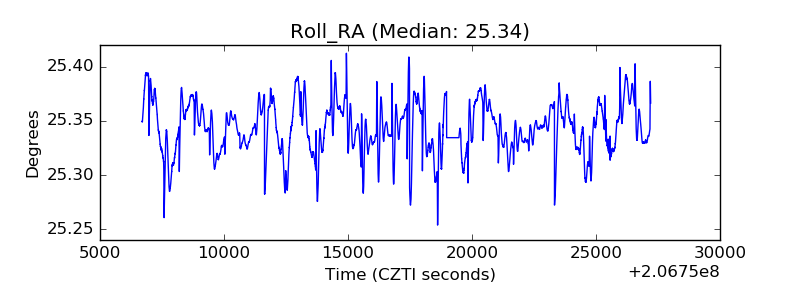 |
| Veto Counter | 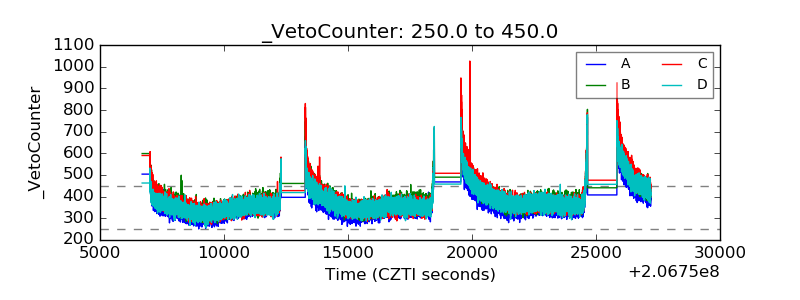 |