| Param | Original file | Final file |
|---|---|---|
| Filename | modeM0/AS1G05_230T02_9000000548_04400cztM0_level2.evt | modeM0/AS1G05_230T02_9000000548_04400cztM0_level2_quad_clean.evt |
| Size (bytes) | 723,349,440 | 140,022,720 |
| Size | 689.8 MB | 133.5 MB |
| Events in quadrant A | 4,844,947 | 884,136 |
| Events in quadrant B | 5,407,593 | 891,283 |
| Events in quadrant C | 5,873,041 | 881,268 |
| Events in quadrant D | 5,068,829 | 856,362 |
| Mode M9 | |||
|---|---|---|---|
| Quadrant | BADHDUFLAG | Total packets | Discarded packets |
| A | 0 | 25 | 0 |
| B | 0 | 25 | 0 |
| C | 0 | 25 | 0 |
| D | 0 | 25 | 0 |
| Mode SS | |||
|---|---|---|---|
| Quadrant | BADHDUFLAG | Total packets | Discarded packets |
| A | 0 | 214 | 0 |
| B | 0 | 214 | 0 |
| C | 0 | 214 | 0 |
| D | 0 | 214 | 0 |
| Mode M0 | |||
|---|---|---|---|
| Quadrant | BADHDUFLAG | Total packets | Discarded packets |
| A | 0 | 21530 | 3 |
| B | 0 | 23058 | 2 |
| C | 0 | 24624 | 2 |
| D | 0 | 22405 | 2 |
| Quadrant | Total seconds | Saturated seconds | Saturation percentage |
|---|---|---|---|
| A | 10509 | 84 | 0.799315% |
| B | 10509 | 162 | 1.541536% |
| C | 10509 | 196 | 1.865068% |
| D | 10509 | 103 | 0.980112% |
Noise dominated data is calculated using 1-second bins in cleaned event files. If a bin has >2000 counts, and if more than 50% of those come from <1% of pixels, then it is considered to be noise-dominated and hence unusable.
| Quadrant | # 1 sec bins | Bins with >0 counts | Bins with >2000 counts | High rate bins dominated by noise | Noise dominated (total time) | Noise dominated (detector-on time) | Marked lightcurve |
|---|---|---|---|---|---|---|---|
| A | 13049 | 10510 | 6 | 6 | 0.05% | 0.06% | 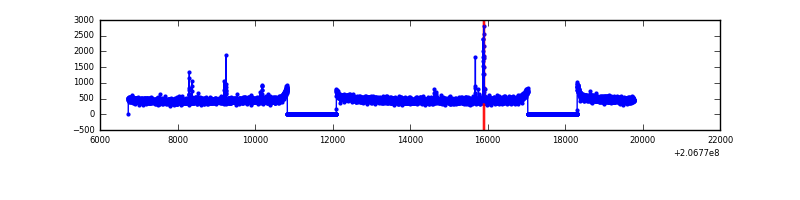 |
| B | 13049 | 10510 | 76 | 76 | 0.58% | 0.72% | 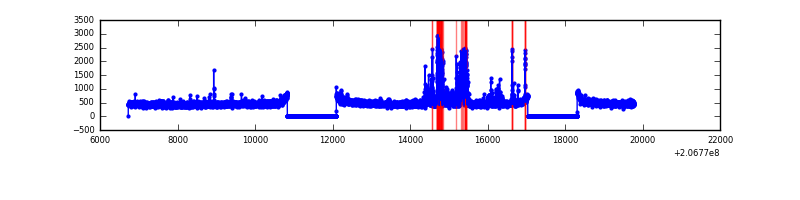 |
| C | 13049 | 10510 | 117 | 117 | 0.90% | 1.11% | 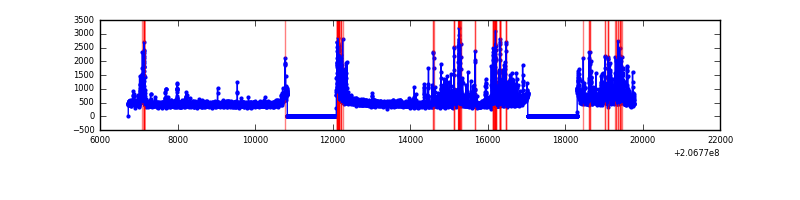 |
| D | 13049 | 10510 | 31 | 31 | 0.24% | 0.29% | 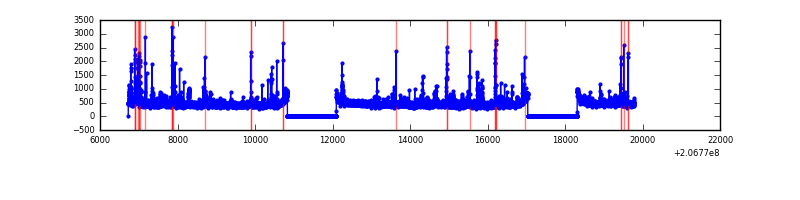 |
Top three noisy pixels from each quadrant. If the there are fewer than three noisy pixels in the level2.evt file, extra rows are filled as -1
| Pixel properties | Quadrant properties | ||||||
|---|---|---|---|---|---|---|---|
| Quadrant | DetID | PixID | Counts | Sigma | Mean | Median | Sigma |
| A | 0 | 50 | 39032 | 151.79 | 1237 | 1209 | 249.2 |
| A | 13 | 14 | 18371 | 68.87 | 1237 | 1209 | 249.2 |
| A | 12 | 194 | 12931 | 47.04 | 1237 | 1209 | 249.2 |
| B | 7 | 252 | 560581 | 2420.78 | 1236 | 1208 | 231.1 |
| B | 14 | 167 | 41125 | 172.75 | 1236 | 1208 | 231.1 |
| B | 15 | 54 | 19512 | 79.21 | 1236 | 1208 | 231.1 |
| C | 9 | 16 | 680064 | 2469.73 | 1206 | 1212 | 274.9 |
| C | 9 | 247 | 416745 | 1511.75 | 1206 | 1212 | 274.9 |
| C | 0 | 10 | 42763 | 151.17 | 1206 | 1212 | 274.9 |
| D | 9 | 35 | 120780 | 420.19 | 1212 | 1180 | 284.6 |
| D | 2 | 63 | 102722 | 356.75 | 1212 | 1180 | 284.6 |
| D | 13 | 239 | 53740 | 184.66 | 1212 | 1180 | 284.6 |
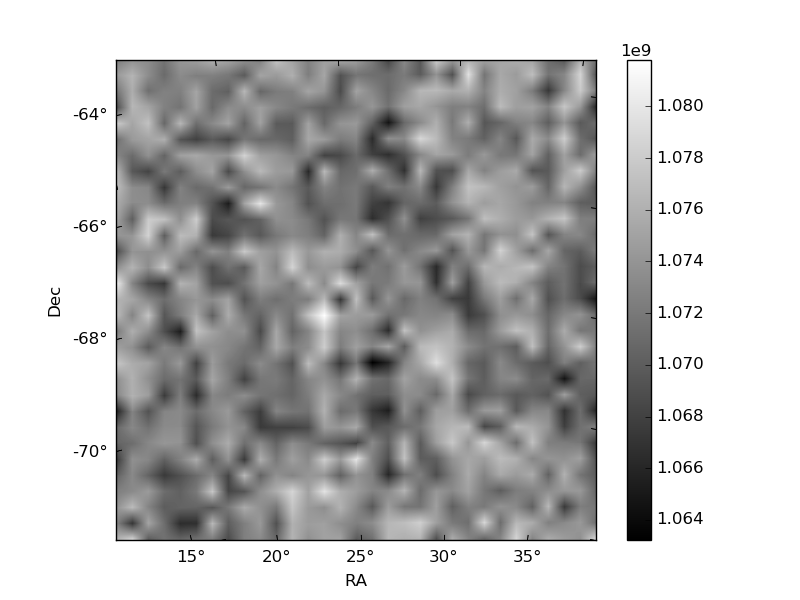
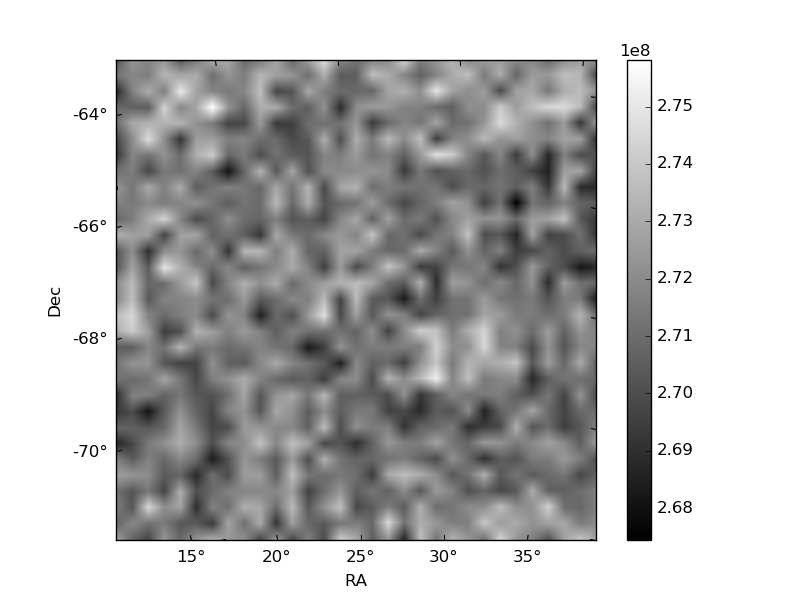
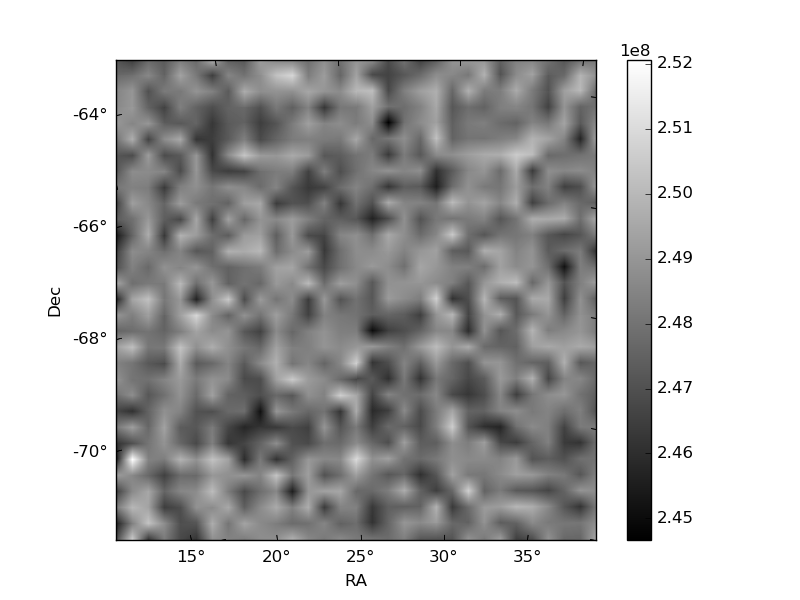
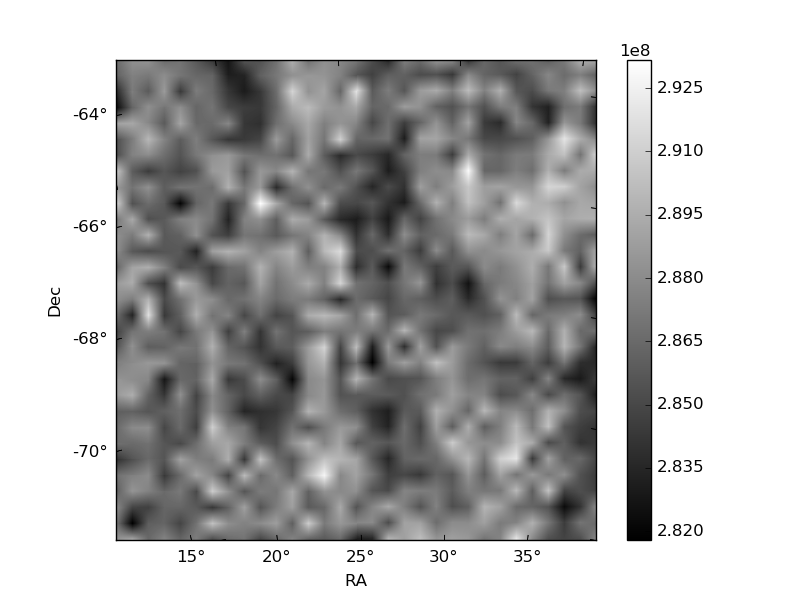
Histogram calculated using DETX and DETY for each event in the final _common_clean file
| Quadrant A | 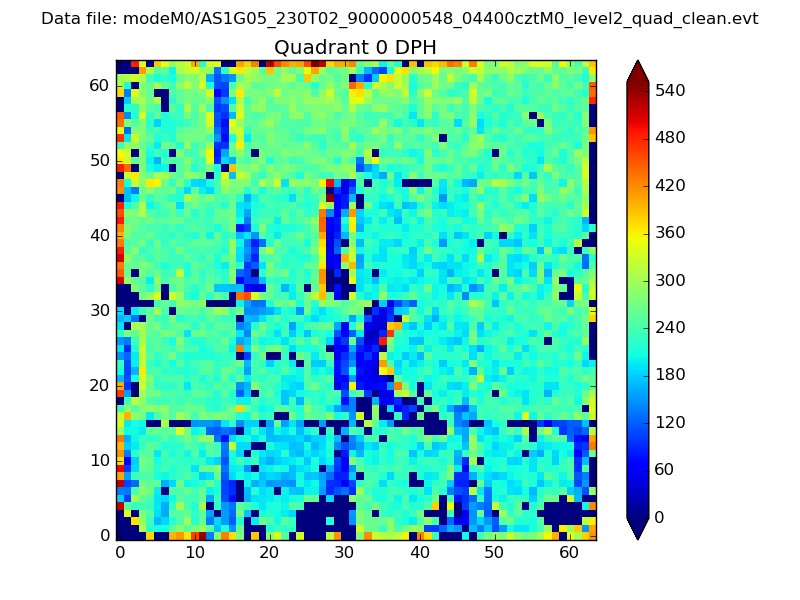 |
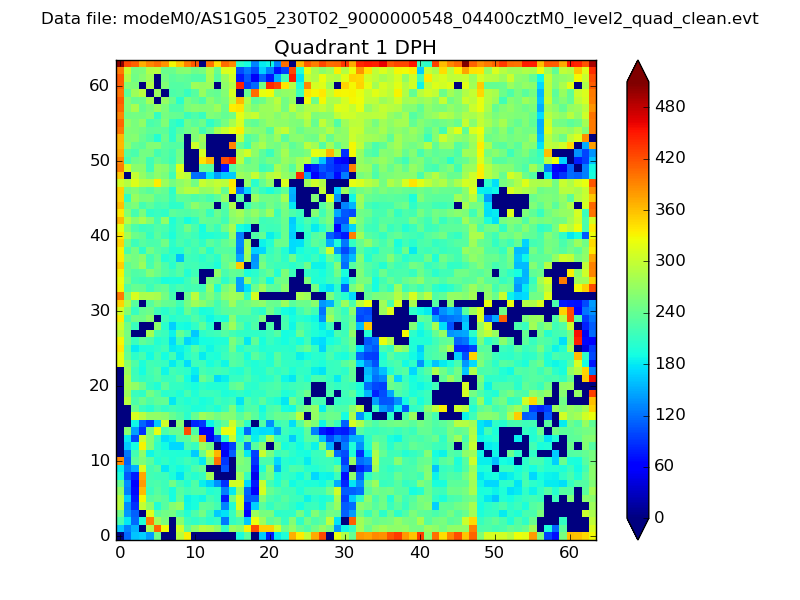 |
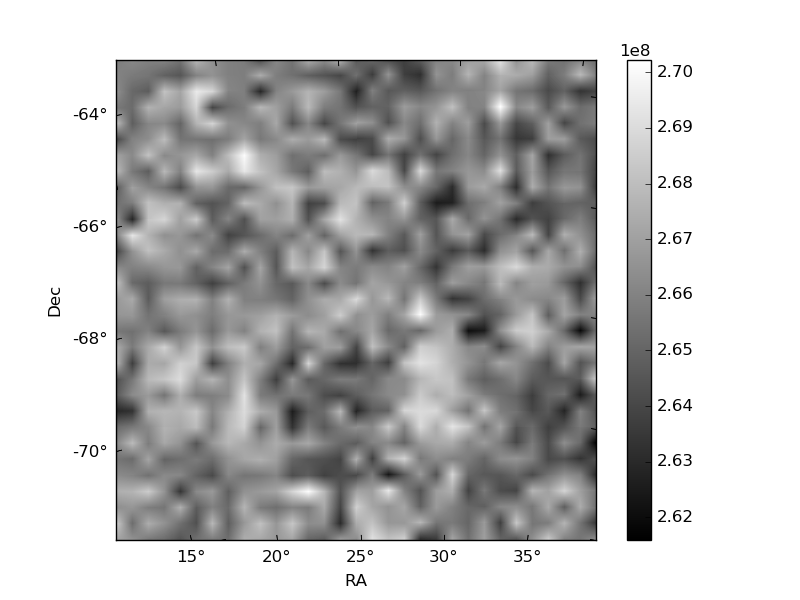
Quadrant B |
|---|---|---|---|
| Quadrant D | 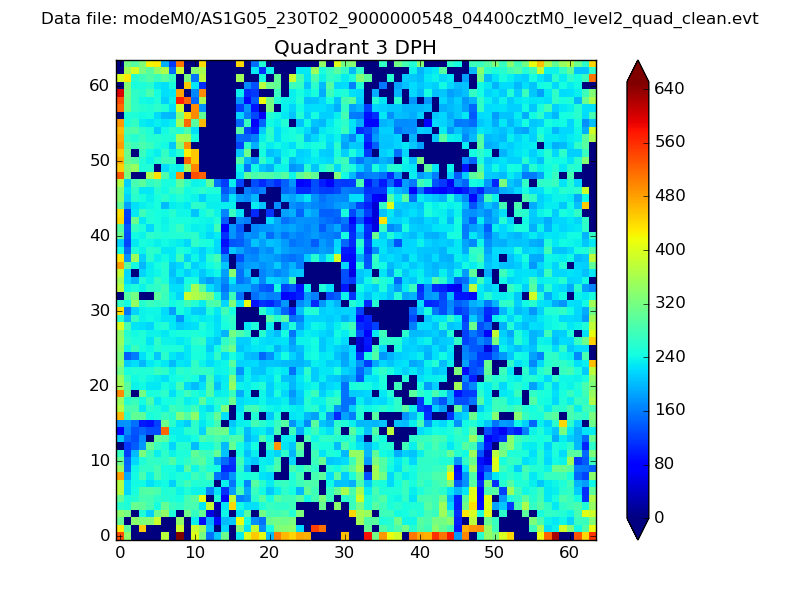 |
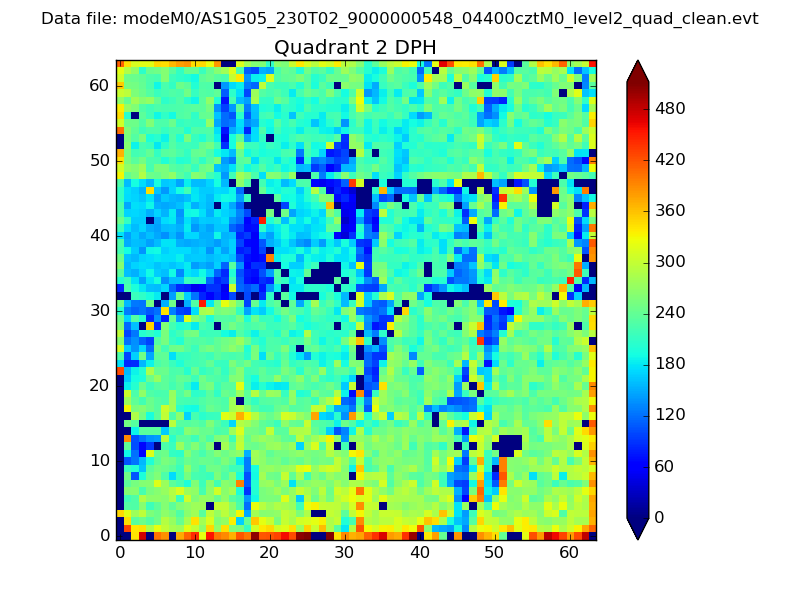 |
Quadrant C |
| Plot type | Count rate plots | Images |
|---|---|---|
| Comparison with Poisson distribution Blue bars denote a histogram of data divided into 1 sec bins. Red curve is a Poisson curve with rate = median count rate of data. |
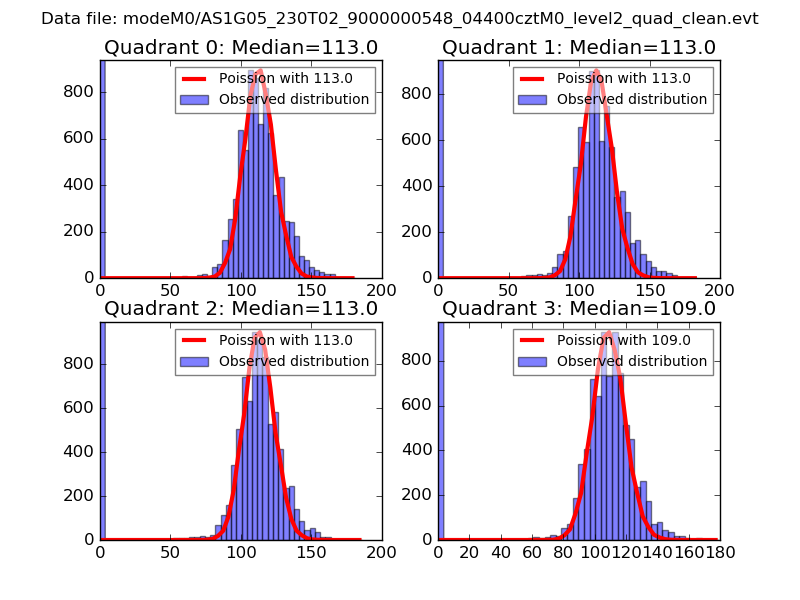 |
 |
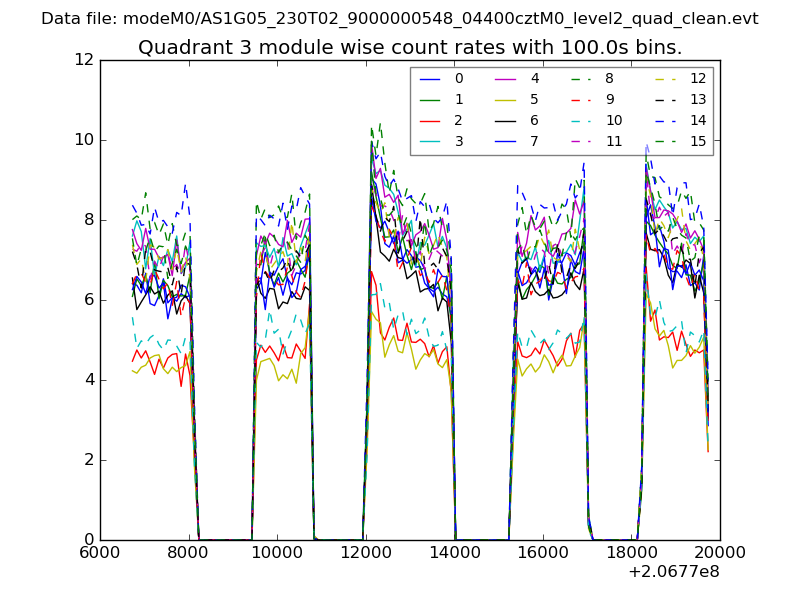
| Quadrant-wise count rates Data is divided into 100 sec bins |
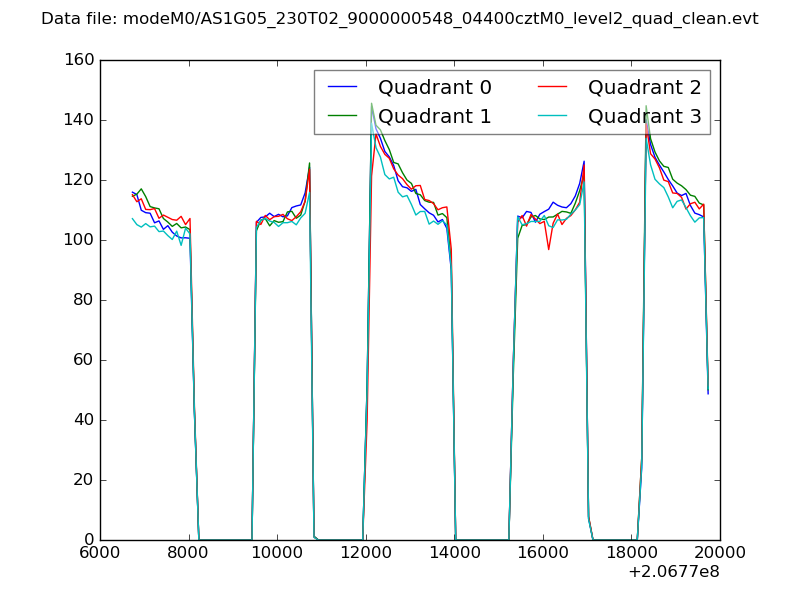 |
|
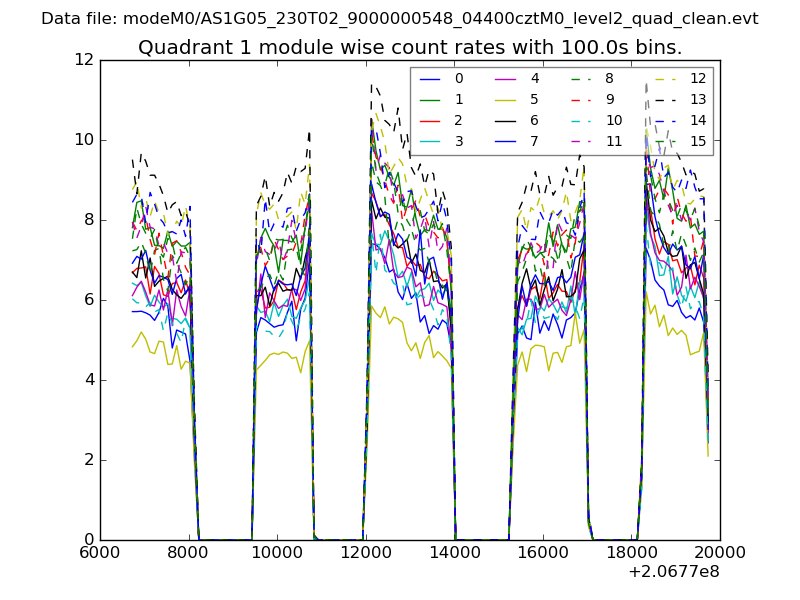
| Module-wise count rates for Quadrant A Data is divided into 100 sec bins |
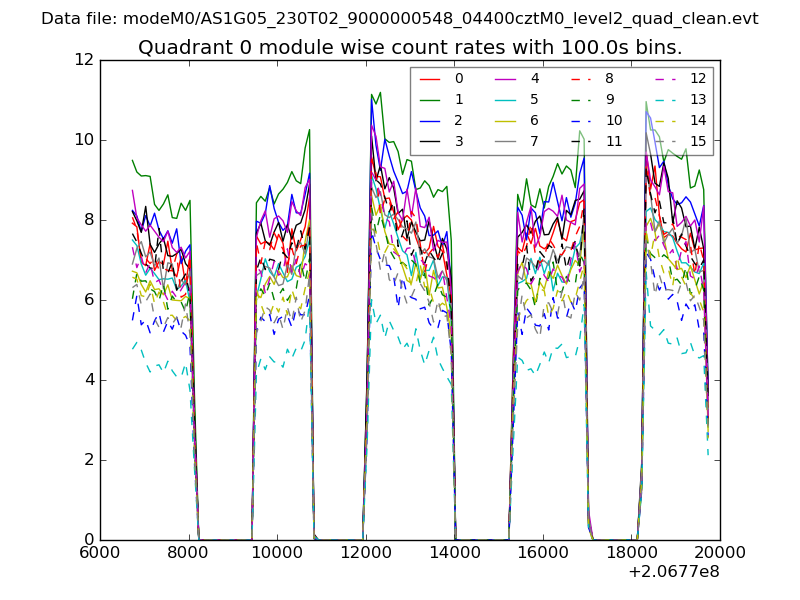 |
 |
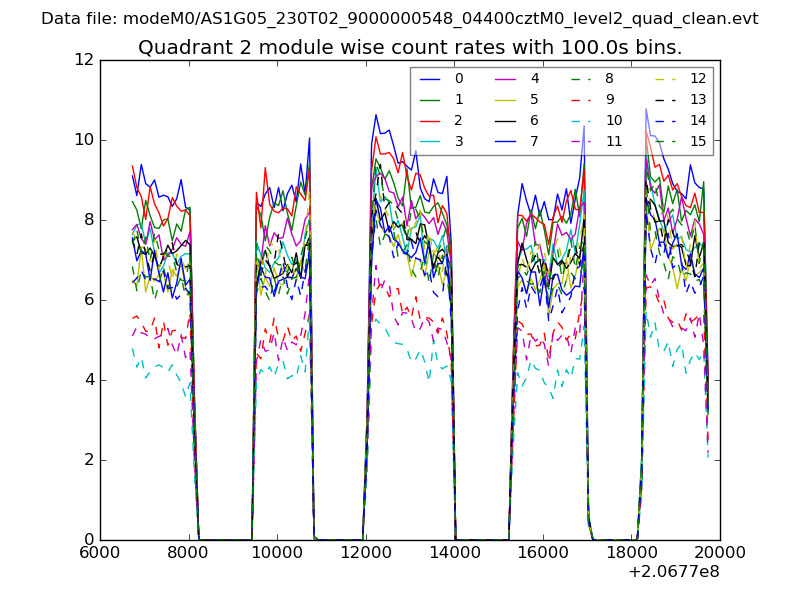
| Module-wise count rates for Quadrant B Data is divided into 100 sec bins |
 |
 |
| Module-wise count rates for Quadrant C Data is divided into 100 sec bins |
 |
 |
| Module-wise count rates for Quadrant D Data is divided into 100 sec bins |
 |
 |
| Parameter | Plot |
|---|---|
| CZT HV Monitor | 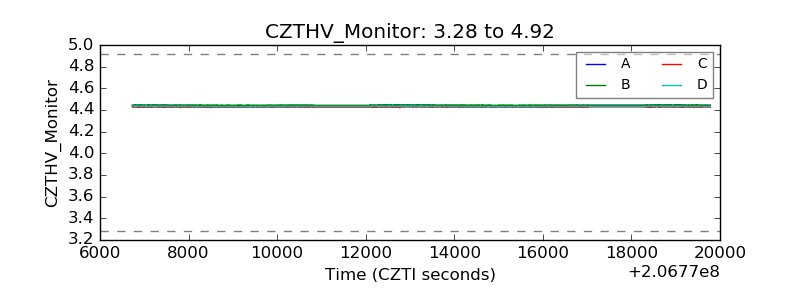 |
| D_VDD | 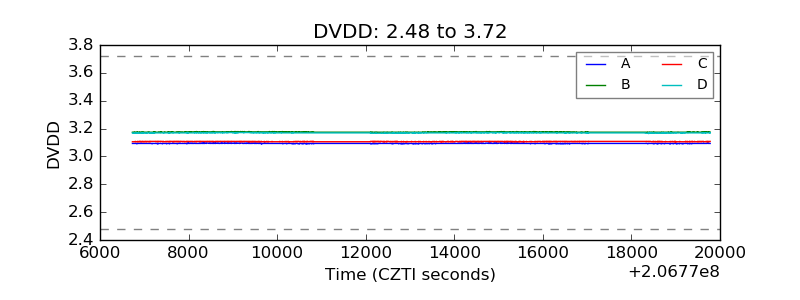 |
| Temperature 1 | 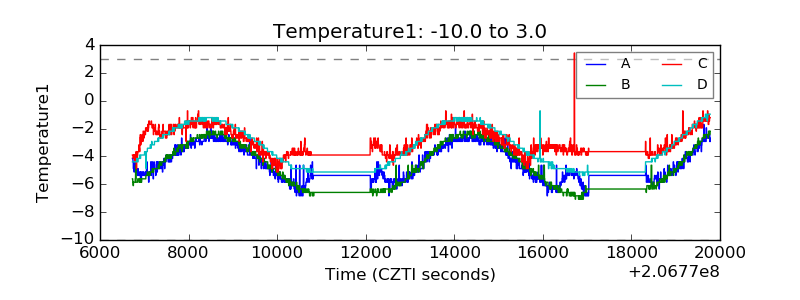 |
| Veto HV Monitor |  |
| Veto LLD | 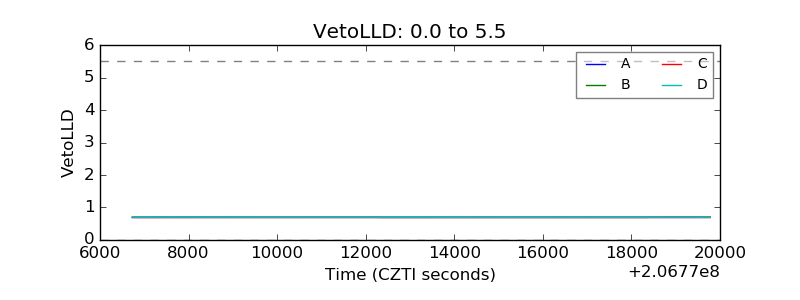 |
| Alpha Counter | 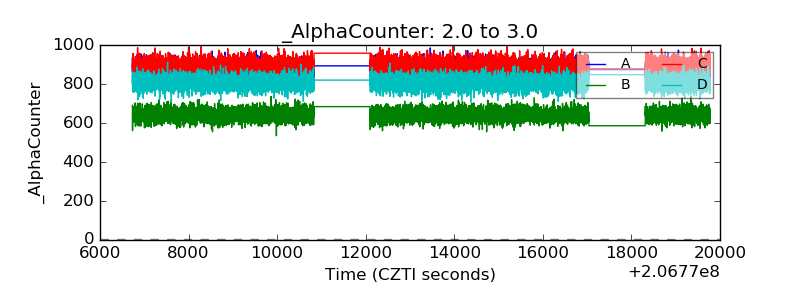 |
| _CPM_Rate | 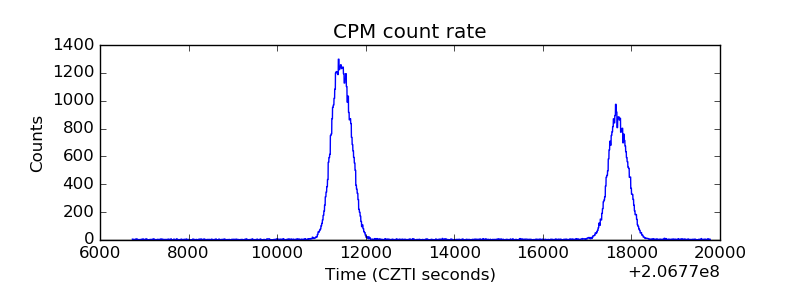 |
| CZT Counter | 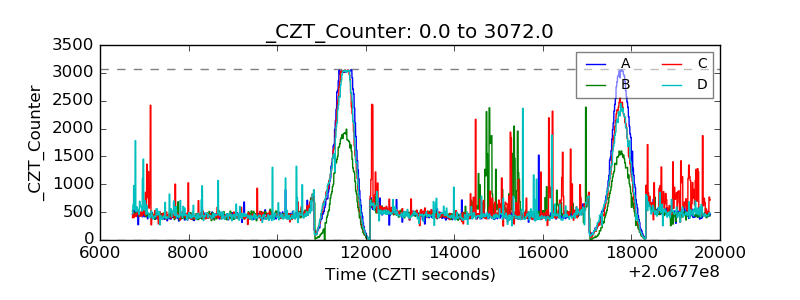 |
| +2.5 Volts monitor |  |
| +5 Volts monitor |  |
| _ROLL_ROT | 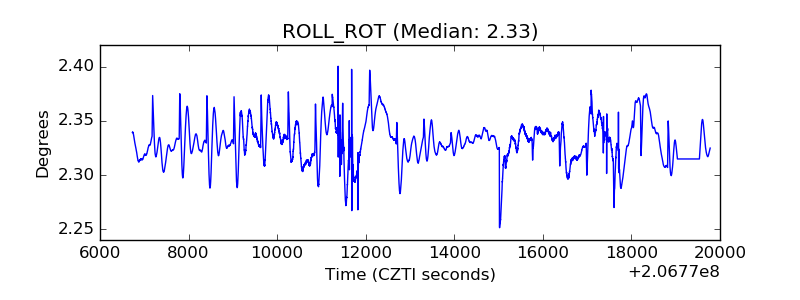 |
| _Roll_DEC | 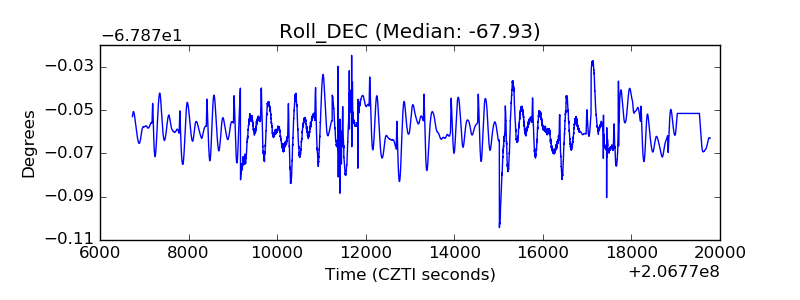 |
| _Roll_RA | 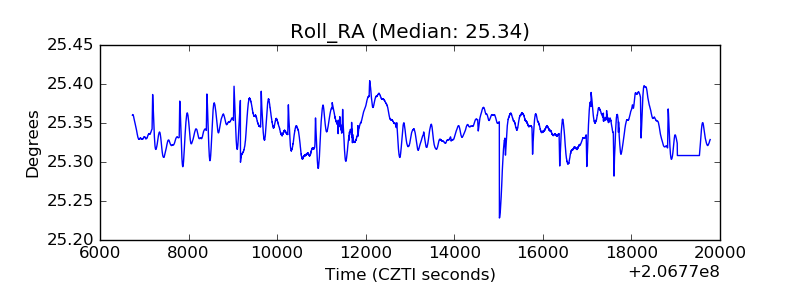 |
| Veto Counter | 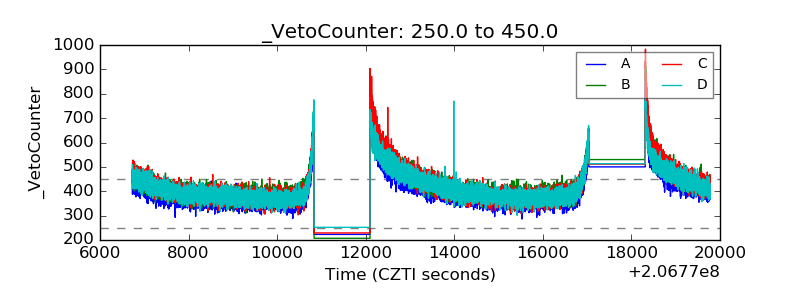 |