| Param | Original file | Final file |
|---|---|---|
| Filename | modeM0/AS1G05_230T02_9000000548_04401cztM0_level2.evt | modeM0/AS1G05_230T02_9000000548_04401cztM0_level2_quad_clean.evt |
| Size (bytes) | 414,216,000 | 76,354,560 |
| Size | 395.0 MB | 72.8 MB |
| Events in quadrant A | 2,857,490 | 473,278 |
| Events in quadrant B | 2,905,870 | 473,949 |
| Events in quadrant C | 3,404,737 | 470,798 |
| Events in quadrant D | 2,950,970 | 457,639 |
| Mode M9 | |||
|---|---|---|---|
| Quadrant | BADHDUFLAG | Total packets | Discarded packets |
| A | 0 | 11 | 0 |
| B | 0 | 11 | 0 |
| C | 0 | 11 | 0 |
| D | 0 | 11 | 0 |
| Mode SS | |||
|---|---|---|---|
| Quadrant | BADHDUFLAG | Total packets | Discarded packets |
| A | 0 | 128 | 0 |
| B | 0 | 128 | 0 |
| C | 0 | 128 | 0 |
| D | 0 | 128 | 0 |
| Mode M0 | |||
|---|---|---|---|
| Quadrant | BADHDUFLAG | Total packets | Discarded packets |
| A | 0 | 12818 | 3 |
| B | 0 | 12856 | 2 |
| C | 0 | 14415 | 2 |
| D | 0 | 13342 | 2 |
| Quadrant | Total seconds | Saturated seconds | Saturation percentage |
|---|---|---|---|
| A | 6249 | 99 | 1.584253% |
| B | 6249 | 90 | 1.440230% |
| C | 6249 | 98 | 1.568251% |
| D | 6249 | 115 | 1.840294% |
Noise dominated data is calculated using 1-second bins in cleaned event files. If a bin has >2000 counts, and if more than 50% of those come from <1% of pixels, then it is considered to be noise-dominated and hence unusable.
| Quadrant | # 1 sec bins | Bins with >0 counts | Bins with >2000 counts | High rate bins dominated by noise | Noise dominated (total time) | Noise dominated (detector-on time) | Marked lightcurve |
|---|---|---|---|---|---|---|---|
| A | 7419 | 6251 | 2 | 2 | 0.03% | 0.03% | 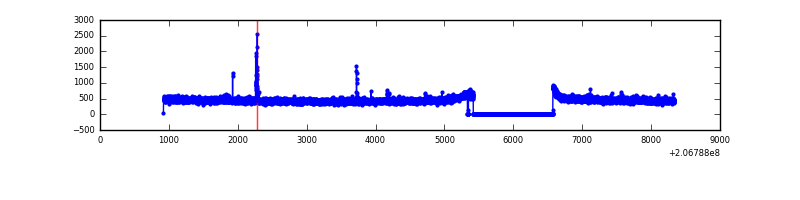 |
| B | 7419 | 6251 | 0 | 0 | 0.00% | 0.00% | 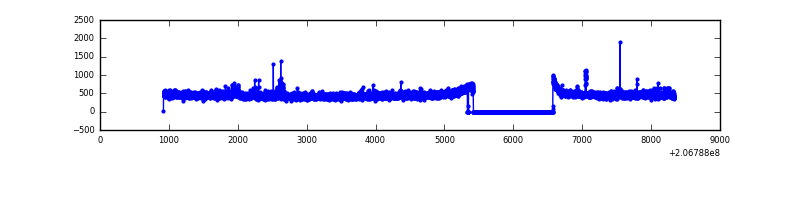 |
| C | 7419 | 6251 | 19 | 19 | 0.26% | 0.30% | 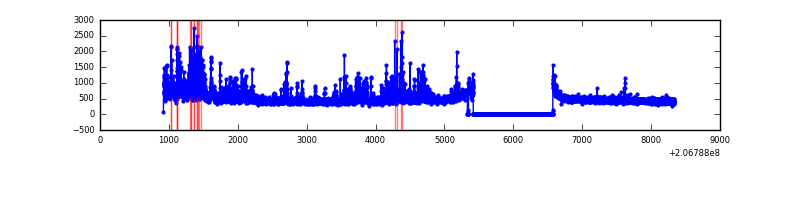 |
| D | 7419 | 6251 | 36 | 36 | 0.49% | 0.58% | 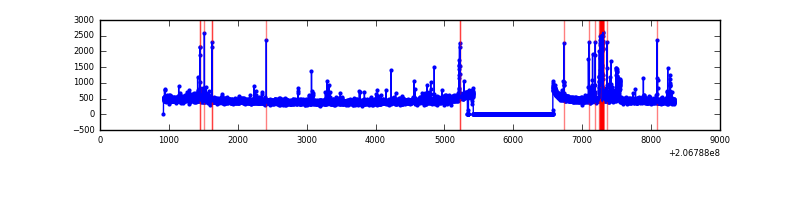 |
Top three noisy pixels from each quadrant. If the there are fewer than three noisy pixels in the level2.evt file, extra rows are filled as -1
| Pixel properties | Quadrant properties | ||||||
|---|---|---|---|---|---|---|---|
| Quadrant | DetID | PixID | Counts | Sigma | Mean | Median | Sigma |
| A | 0 | 50 | 37597 | 250.98 | 726 | 708 | 147.0 |
| A | 13 | 14 | 10495 | 66.59 | 726 | 708 | 147.0 |
| A | 12 | 194 | 7687 | 47.48 | 726 | 708 | 147.0 |
| B | 14 | 167 | 45736 | 326.8 | 728 | 710 | 137.8 |
| B | 15 | 54 | 20919 | 146.68 | 728 | 710 | 137.8 |
| B | 7 | 252 | 18890 | 131.95 | 728 | 710 | 137.8 |
| C | 9 | 16 | 317880 | 1959.65 | 706 | 708 | 161.9 |
| C | 9 | 247 | 280849 | 1730.85 | 706 | 708 | 161.9 |
| C | 12 | 4 | 47784 | 290.86 | 706 | 708 | 161.9 |
| D | 13 | 53 | 138151 | 819.61 | 709 | 689 | 167.7 |
| D | 13 | 239 | 25731 | 149.31 | 709 | 689 | 167.7 |
| D | 2 | 14 | 23177 | 134.08 | 709 | 689 | 167.7 |
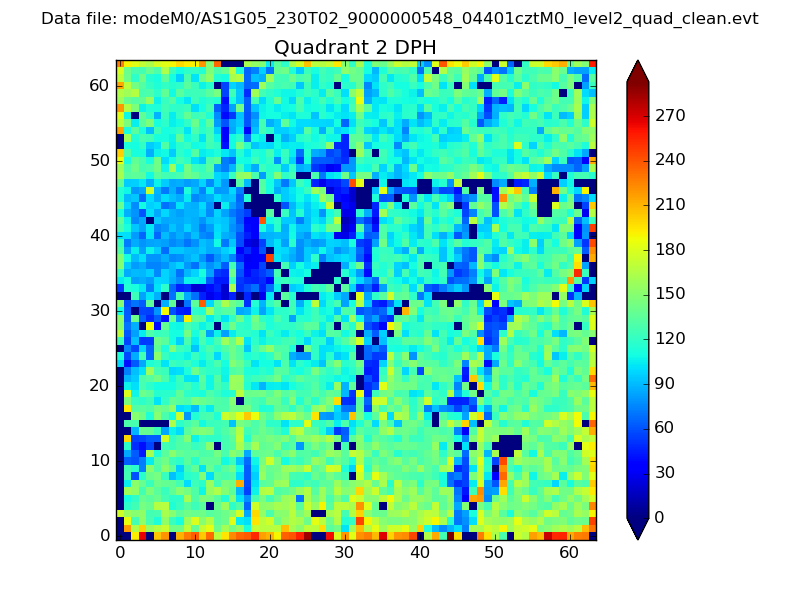
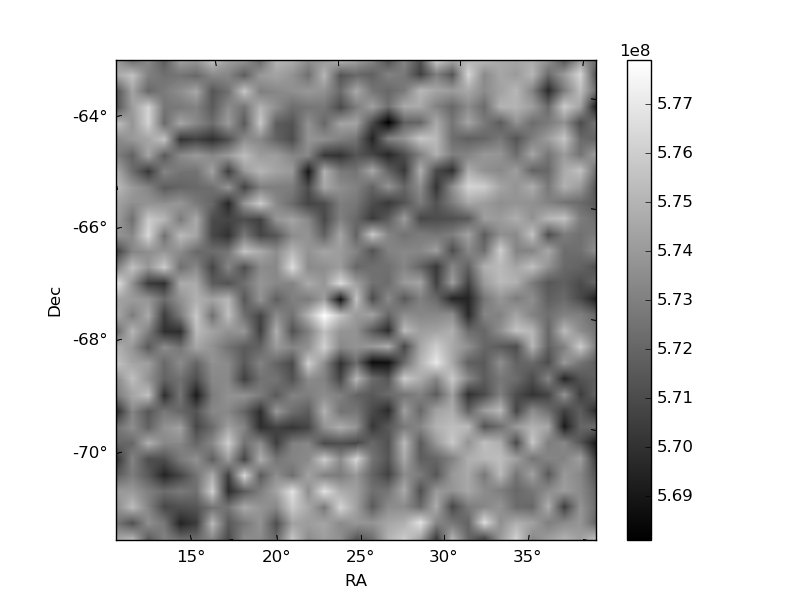
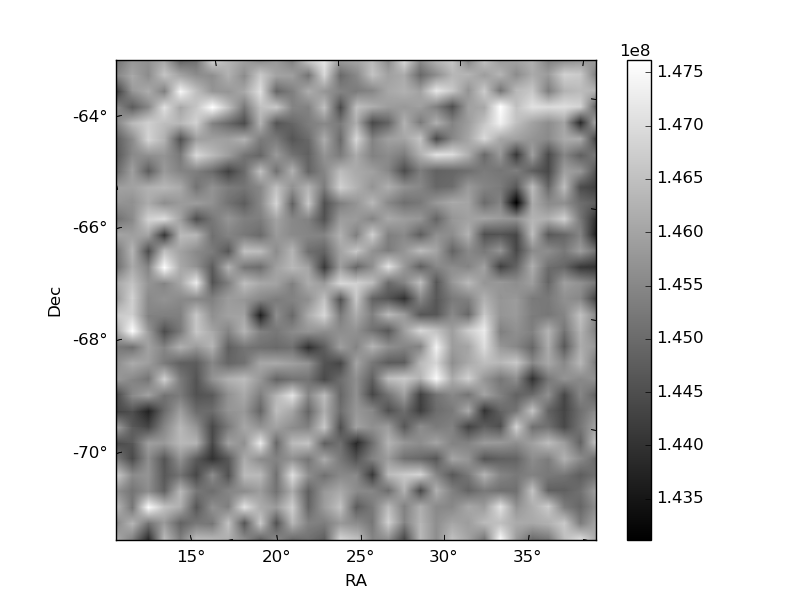
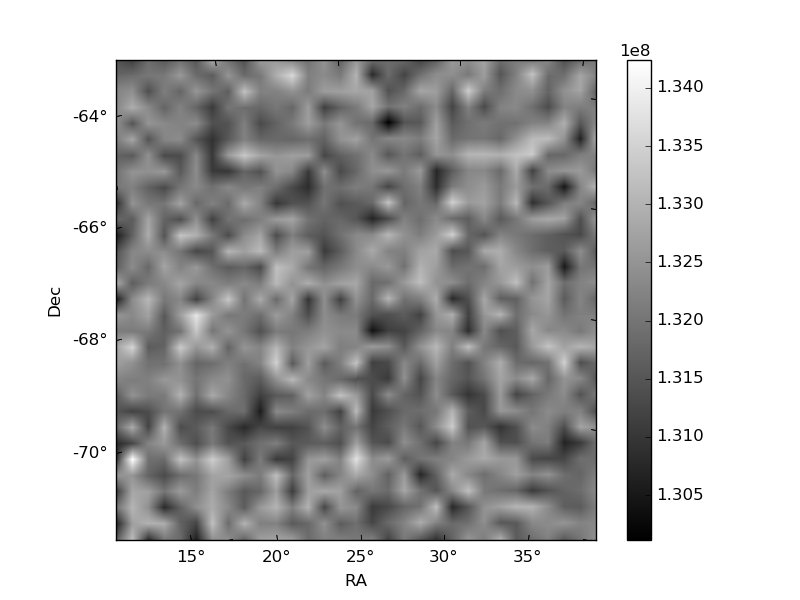
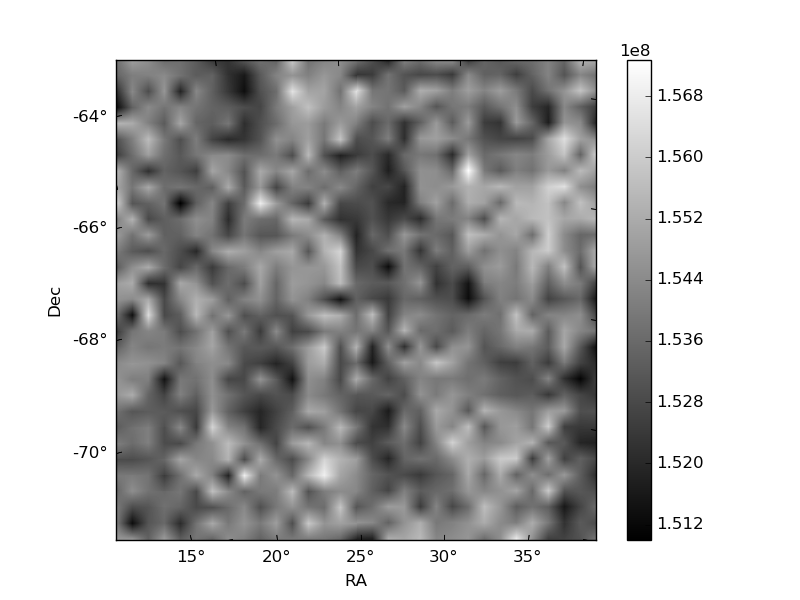
Histogram calculated using DETX and DETY for each event in the final _common_clean file
| Quadrant A | 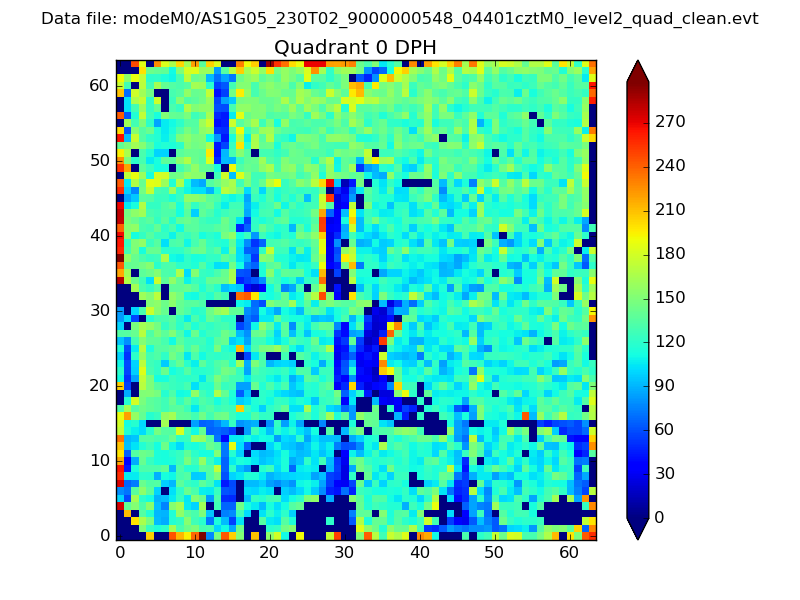 |
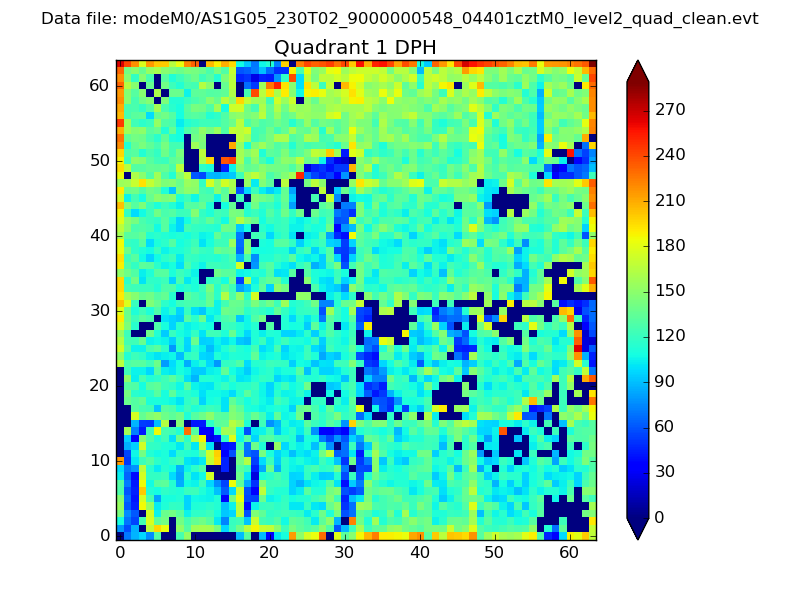 |
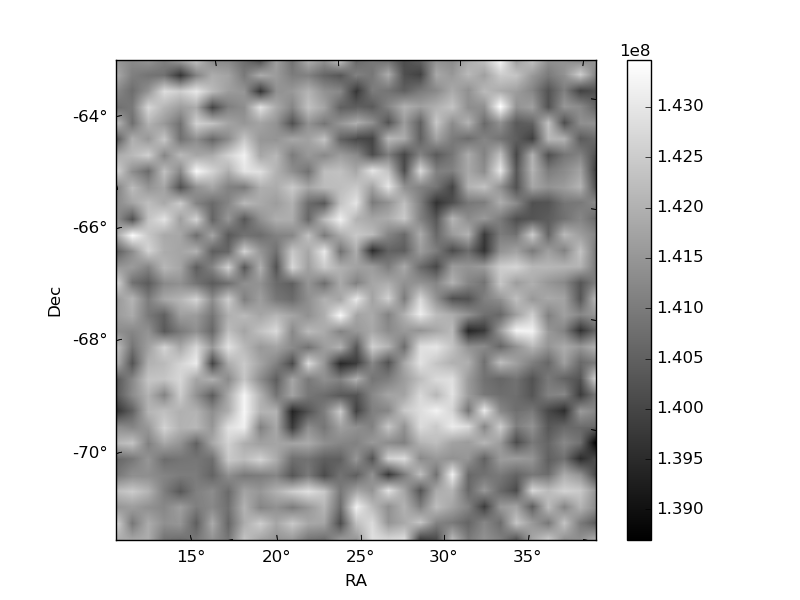
Quadrant B |
|---|---|---|---|
| Quadrant D | 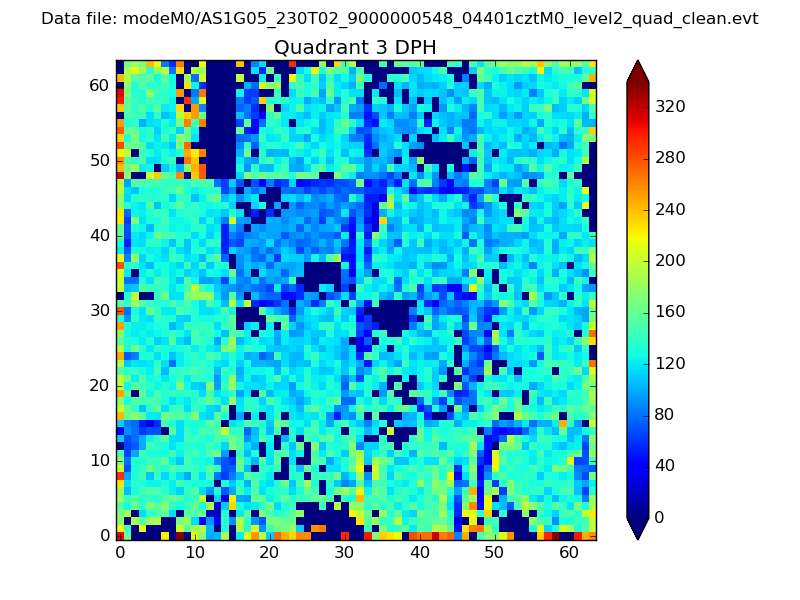 |
 |
Quadrant C |
| Plot type | Count rate plots | Images |
|---|---|---|
| Comparison with Poisson distribution Blue bars denote a histogram of data divided into 1 sec bins. Red curve is a Poisson curve with rate = median count rate of data. |
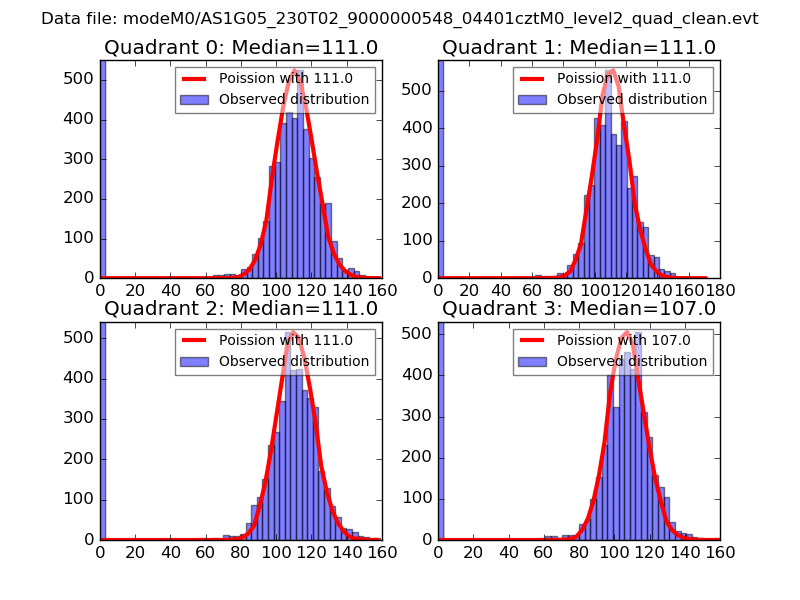 |
 |
| Quadrant-wise count rates Data is divided into 100 sec bins |
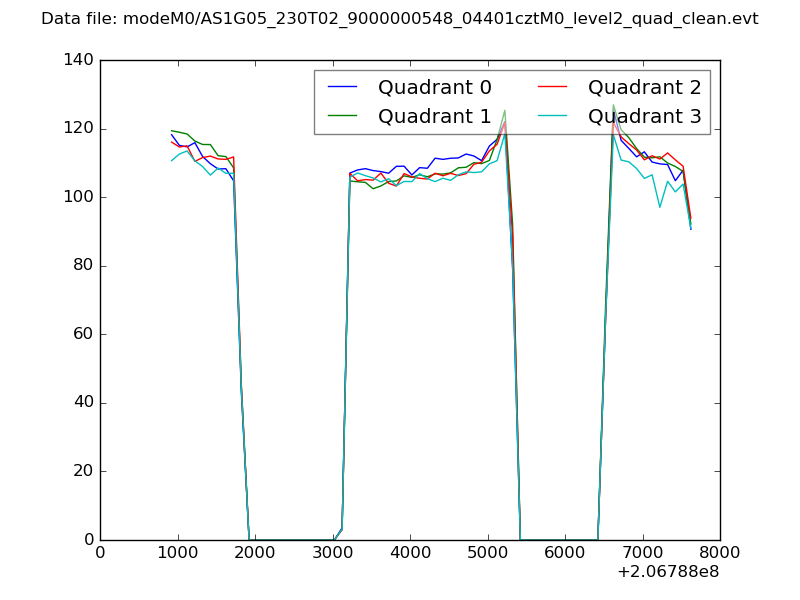 |
|
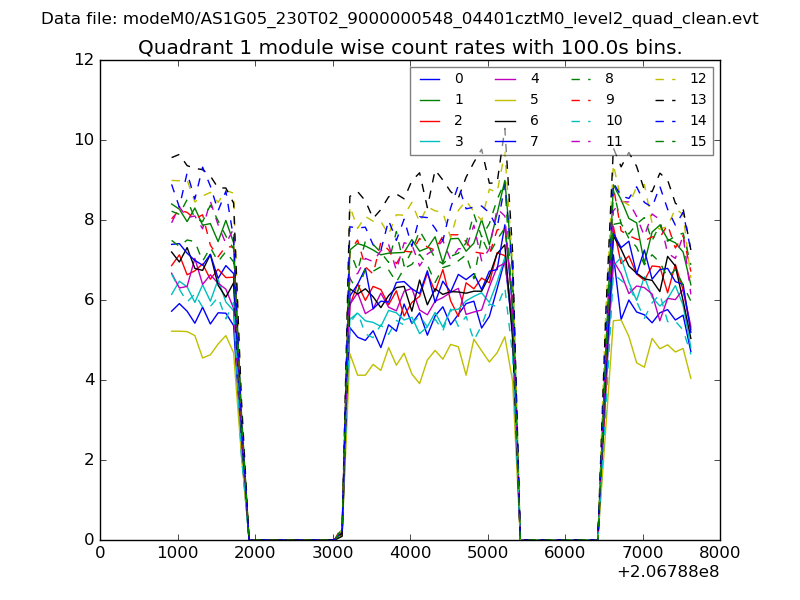
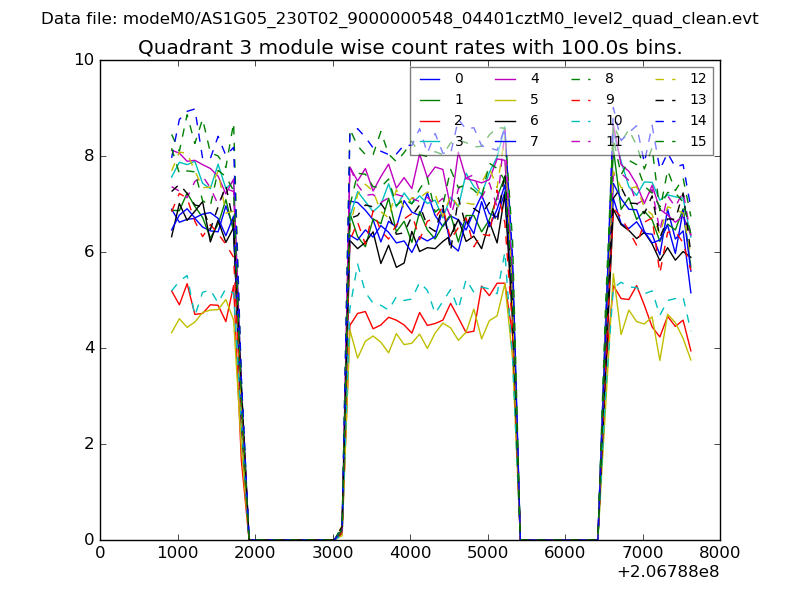
| Module-wise count rates for Quadrant A Data is divided into 100 sec bins |
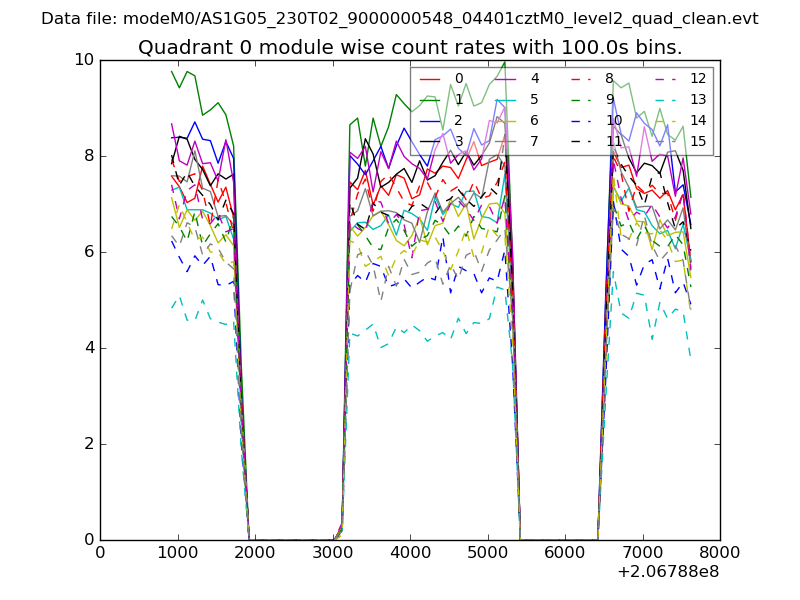 |
 |
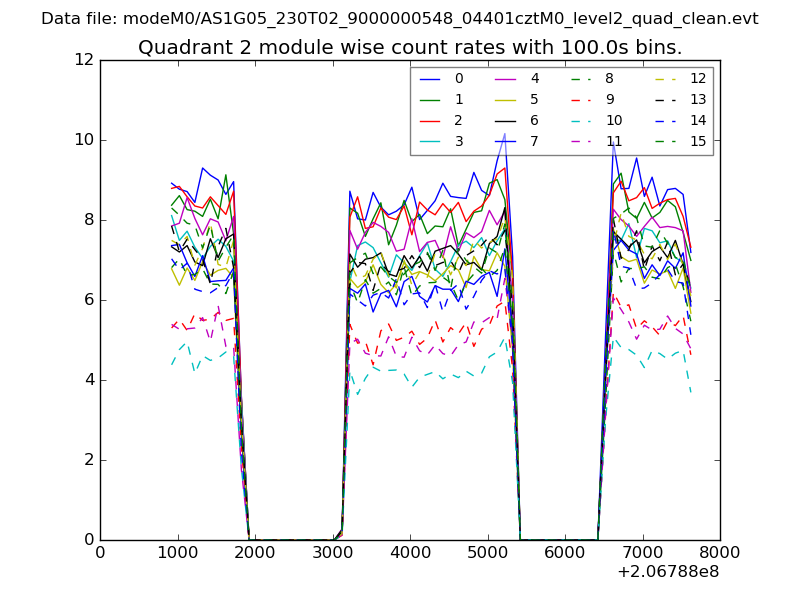
| Module-wise count rates for Quadrant B Data is divided into 100 sec bins |
 |
 |
| Module-wise count rates for Quadrant C Data is divided into 100 sec bins |
 |
 |
| Module-wise count rates for Quadrant D Data is divided into 100 sec bins |
 |
 |
| Parameter | Plot |
|---|---|
| CZT HV Monitor | 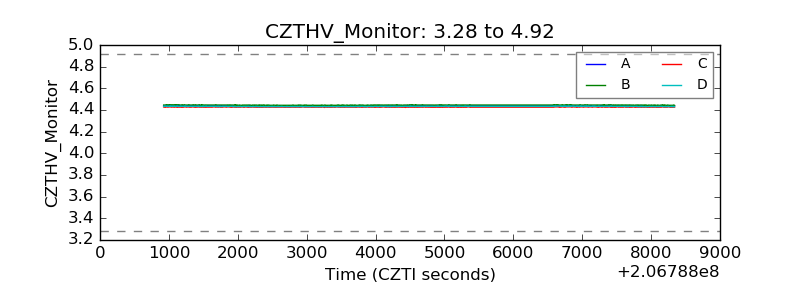 |
| D_VDD | 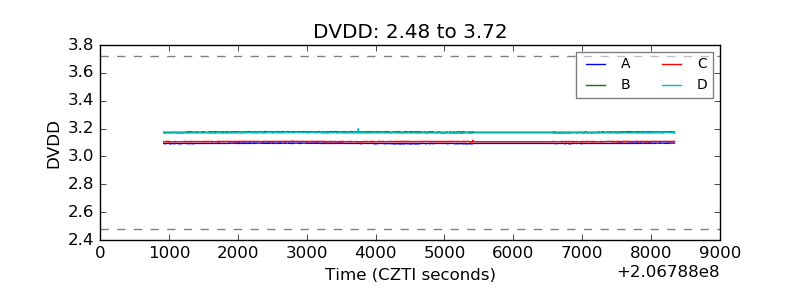 |
| Temperature 1 | 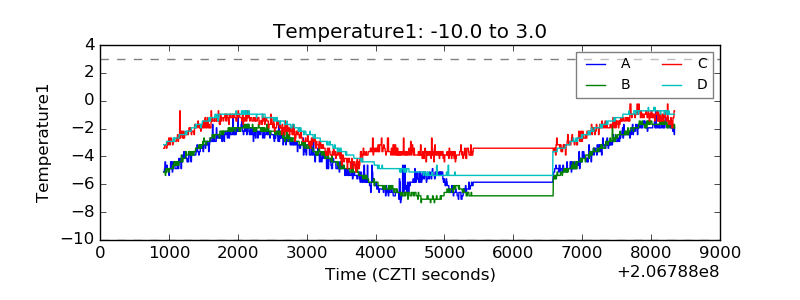 |
| Veto HV Monitor | 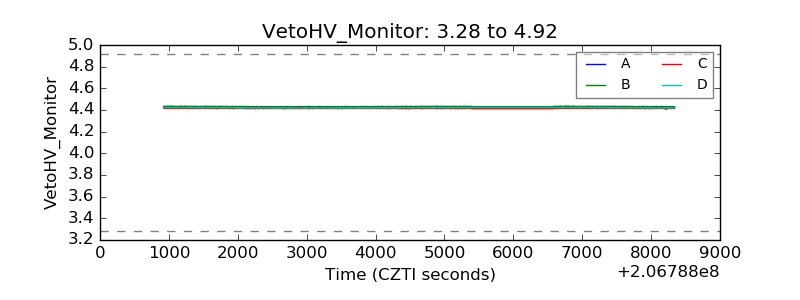 |
| Veto LLD | 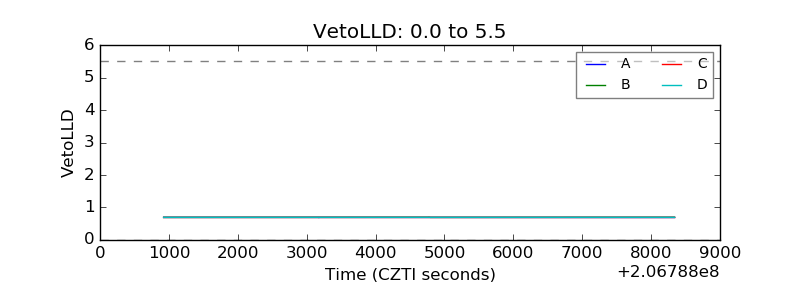 |
| Alpha Counter |  |
| _CPM_Rate | 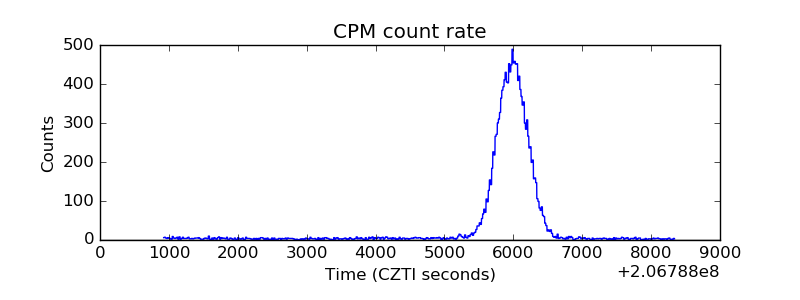 |
| CZT Counter | 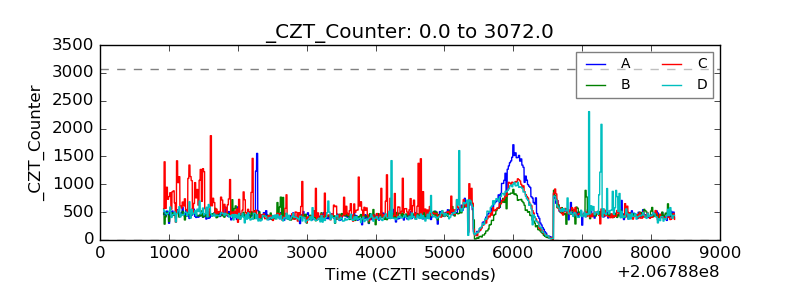 |
| +2.5 Volts monitor | 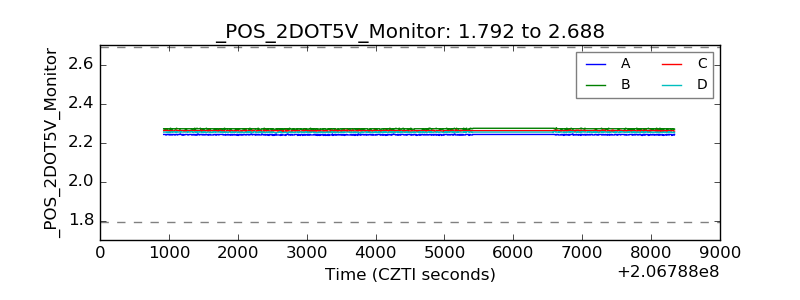 |
| +5 Volts monitor | 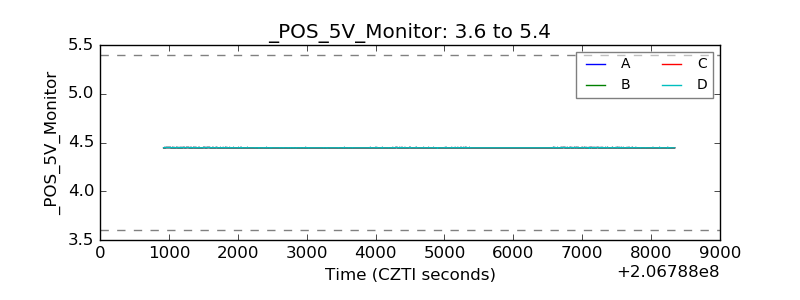 |
| _ROLL_ROT | 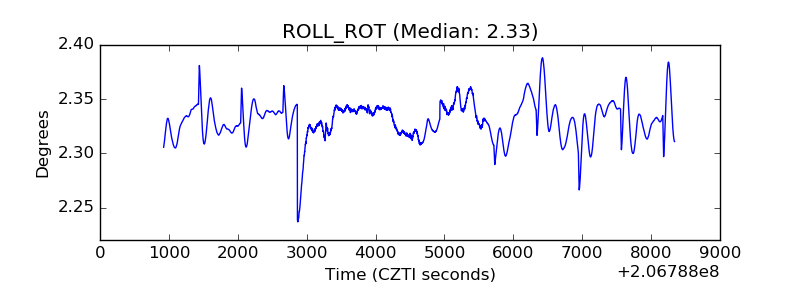 |
| _Roll_DEC | 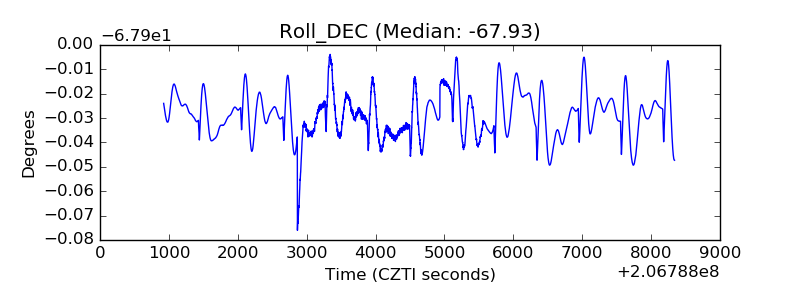 |
| _Roll_RA | 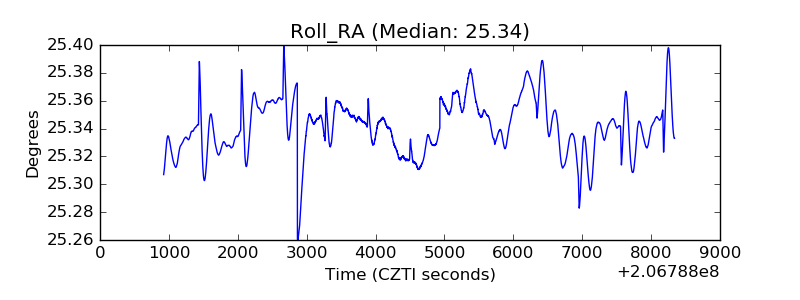 |
| Veto Counter | 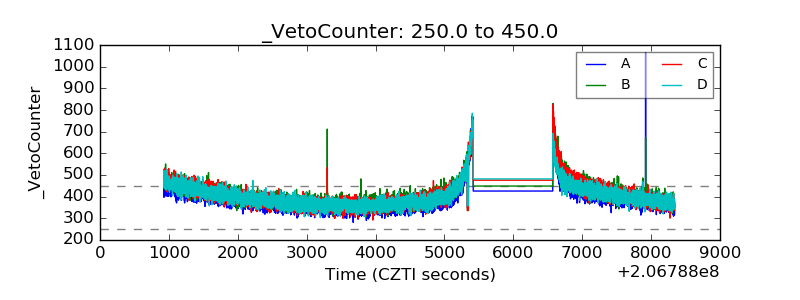 |