| Param | Original file | Final file |
|---|---|---|
| Filename | modeM0/AS1G05_230T02_9000000548_04402cztM0_level2.evt | modeM0/AS1G05_230T02_9000000548_04402cztM0_level2_quad_clean.evt |
| Size (bytes) | 423,866,880 | 69,707,520 |
| Size | 404.2 MB | 66.5 MB |
| Events in quadrant A | 2,816,843 | 425,516 |
| Events in quadrant B | 3,653,688 | 414,055 |
| Events in quadrant C | 2,816,548 | 420,942 |
| Events in quadrant D | 3,122,494 | 411,921 |
| Mode M9 | |||
|---|---|---|---|
| Quadrant | BADHDUFLAG | Total packets | Discarded packets |
| A | 0 | 10 | 0 |
| B | 0 | 10 | 0 |
| C | 0 | 10 | 0 |
| D | 0 | 10 | 0 |
| Mode SS | |||
|---|---|---|---|
| Quadrant | BADHDUFLAG | Total packets | Discarded packets |
| A | 0 | 128 | 0 |
| B | 0 | 128 | 0 |
| C | 0 | 128 | 0 |
| D | 0 | 128 | 0 |
| Mode M0 | |||
|---|---|---|---|
| Quadrant | BADHDUFLAG | Total packets | Discarded packets |
| A | 0 | 12871 | 2 |
| B | 0 | 15117 | 1 |
| C | 0 | 13066 | 1 |
| D | 0 | 14044 | 1 |
| Quadrant | Total seconds | Saturated seconds | Saturation percentage |
|---|---|---|---|
| A | 6275 | 122 | 1.944223% |
| B | 6275 | 256 | 4.079681% |
| C | 6275 | 115 | 1.832669% |
| D | 6275 | 147 | 2.342629% |
Noise dominated data is calculated using 1-second bins in cleaned event files. If a bin has >2000 counts, and if more than 50% of those come from <1% of pixels, then it is considered to be noise-dominated and hence unusable.
| Quadrant | # 1 sec bins | Bins with >0 counts | Bins with >2000 counts | High rate bins dominated by noise | Noise dominated (total time) | Noise dominated (detector-on time) | Marked lightcurve |
|---|---|---|---|---|---|---|---|
| A | 7225 | 6276 | 2 | 2 | 0.03% | 0.03% |  |
| B | 7225 | 6276 | 78 | 78 | 1.08% | 1.24% |  |
| C | 7225 | 6276 | 2 | 2 | 0.03% | 0.03% |  |
| D | 7225 | 6276 | 43 | 43 | 0.60% | 0.69% |  |
Top three noisy pixels from each quadrant. If the there are fewer than three noisy pixels in the level2.evt file, extra rows are filled as -1
| Pixel properties | Quadrant properties | ||||||
|---|---|---|---|---|---|---|---|
| Quadrant | DetID | PixID | Counts | Sigma | Mean | Median | Sigma |
| A | 0 | 50 | 39609 | 271.63 | 710 | 694 | 143.3 |
| A | 13 | 14 | 22460 | 151.93 | 710 | 694 | 143.3 |
| A | 13 | 251 | 8098 | 51.68 | 710 | 694 | 143.3 |
| B | 10 | 16 | 476511 | 3552.05 | 709 | 690 | 134.0 |
| B | 14 | 167 | 348606 | 2597.22 | 709 | 690 | 134.0 |
| B | 8 | 3 | 35251 | 258.0 | 709 | 690 | 134.0 |
| C | 12 | 4 | 38812 | 240.52 | 690 | 692 | 158.5 |
| C | 9 | 247 | 37825 | 234.29 | 690 | 692 | 158.5 |
| C | 9 | 16 | 29073 | 179.07 | 690 | 692 | 158.5 |
| D | 13 | 53 | 321129 | 1925.2 | 691 | 672 | 166.5 |
| D | 13 | 239 | 70234 | 417.9 | 691 | 672 | 166.5 |
| D | 9 | 35 | 55090 | 326.92 | 691 | 672 | 166.5 |
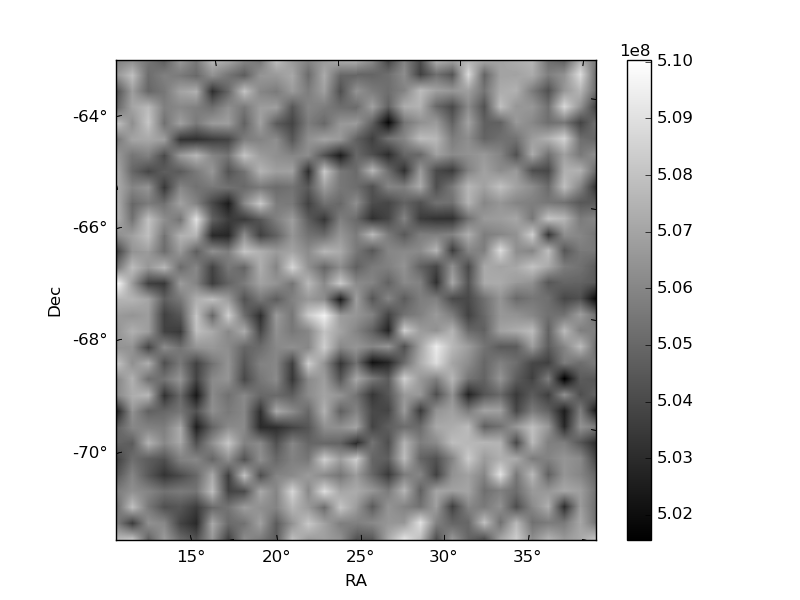
Histogram calculated using DETX and DETY for each event in the final _common_clean file
| Quadrant A | 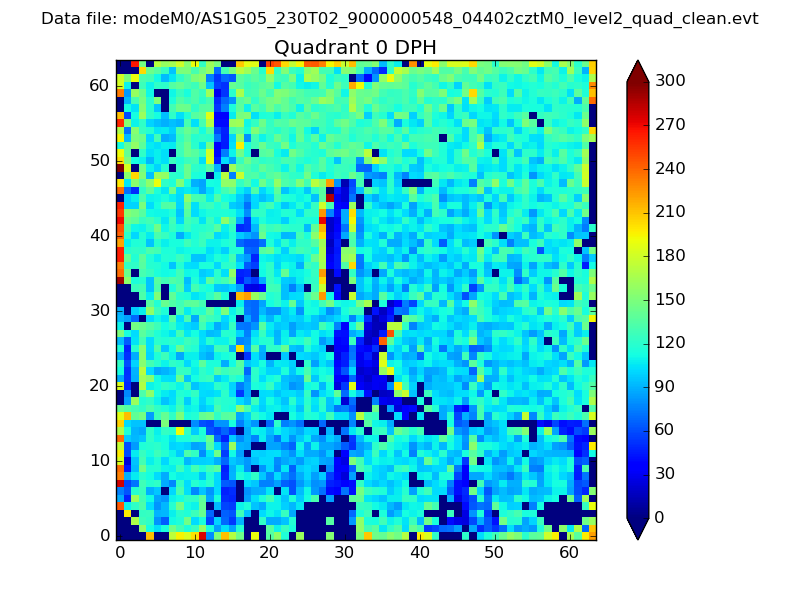 |
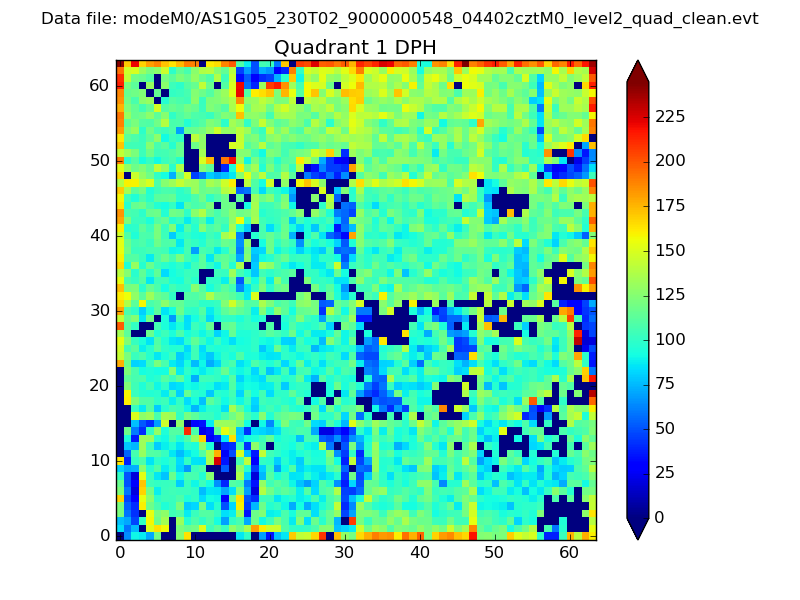 |
Quadrant B |
|---|---|---|---|
| Quadrant D | 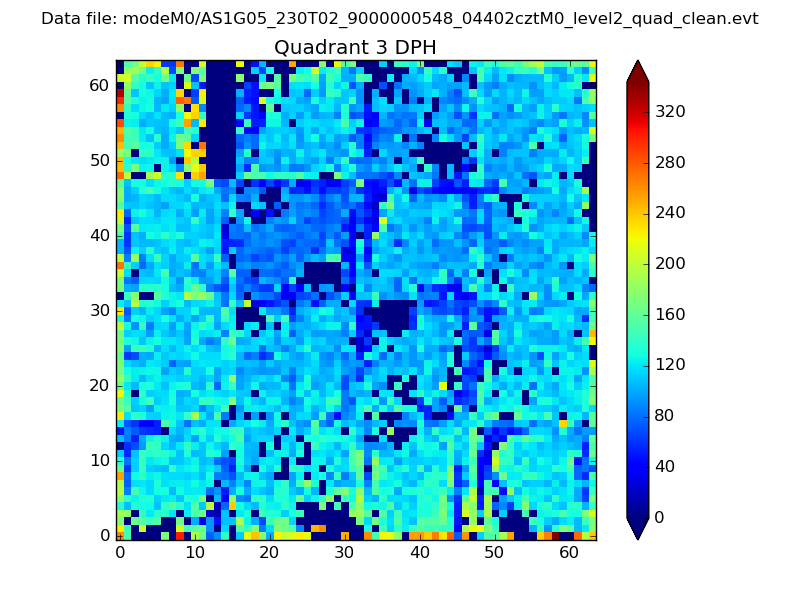 |
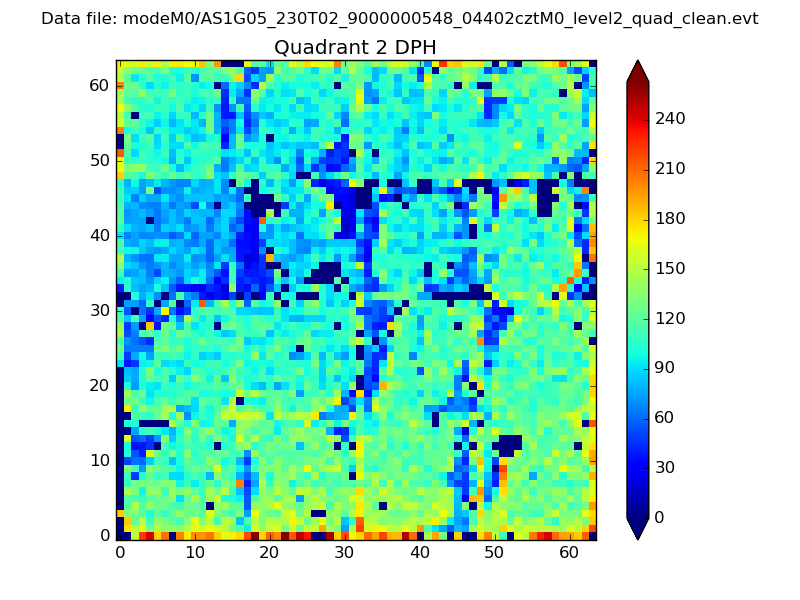 |
Quadrant C |
| Plot type | Count rate plots | Images |
|---|---|---|
| Comparison with Poisson distribution Blue bars denote a histogram of data divided into 1 sec bins. Red curve is a Poisson curve with rate = median count rate of data. |
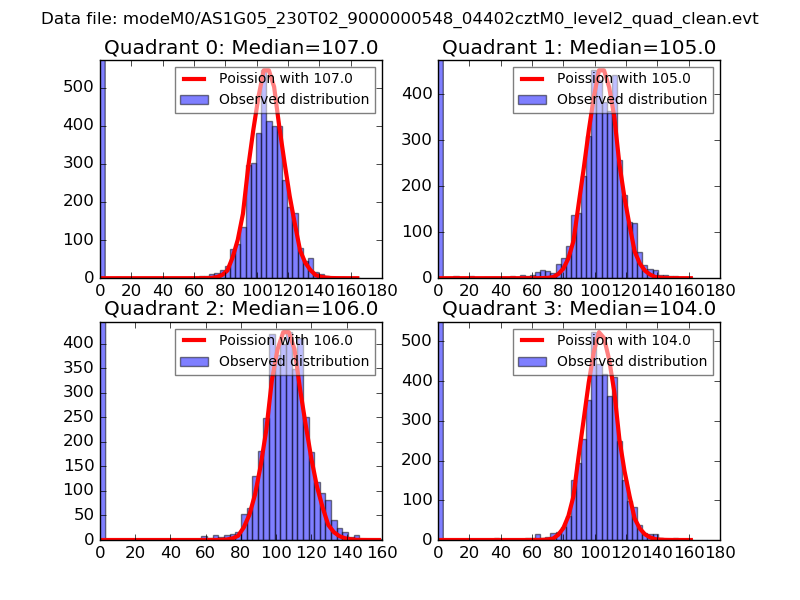 |
 |
| Quadrant-wise count rates Data is divided into 100 sec bins |
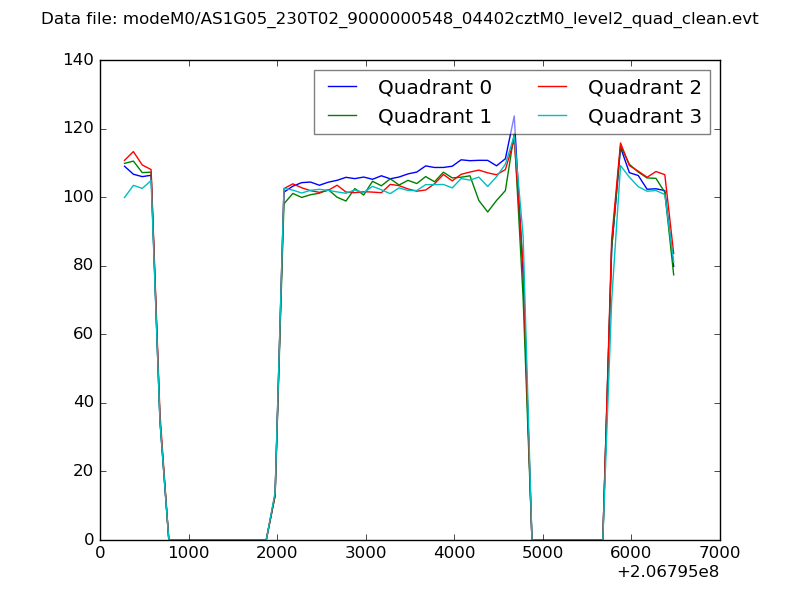 |
|
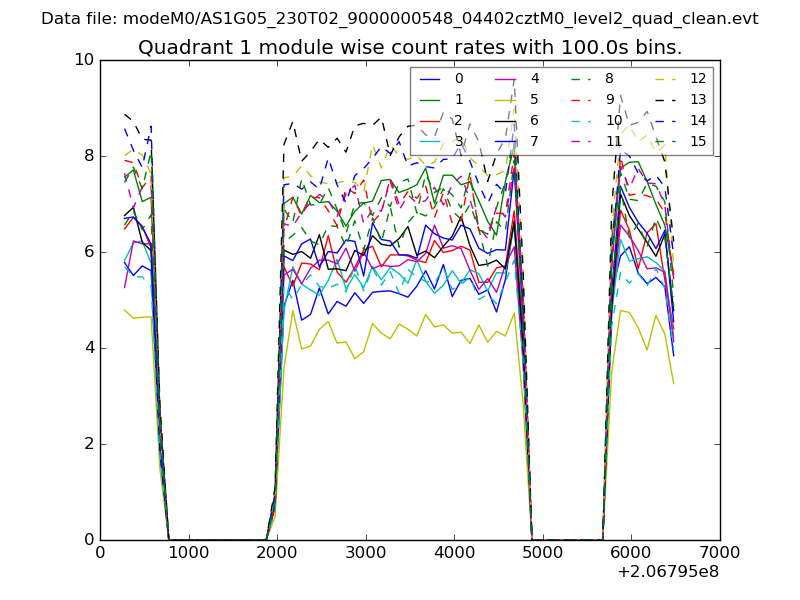
| Module-wise count rates for Quadrant A Data is divided into 100 sec bins |
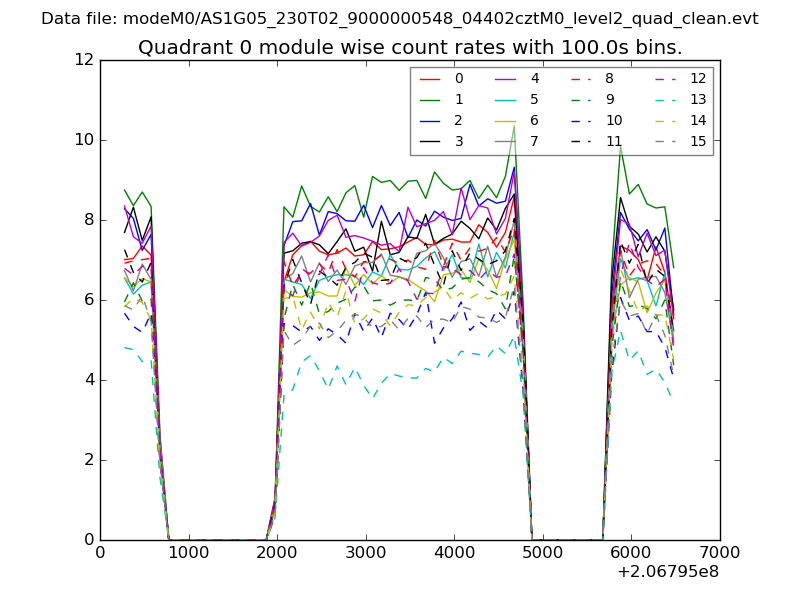 |
 |
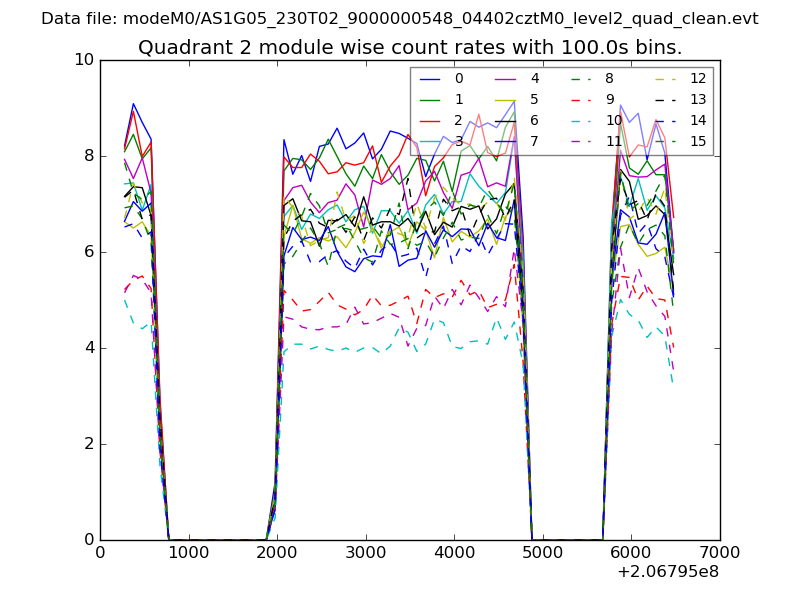
| Module-wise count rates for Quadrant B Data is divided into 100 sec bins |
 |
 |
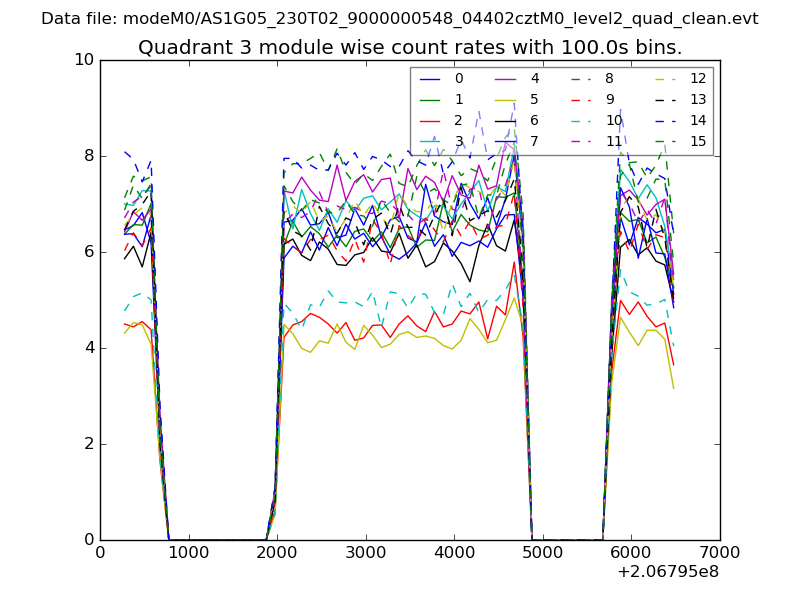
| Module-wise count rates for Quadrant C Data is divided into 100 sec bins |
 |
 |
| Module-wise count rates for Quadrant D Data is divided into 100 sec bins |
 |
 |
| Parameter | Plot |
|---|---|
| CZT HV Monitor | 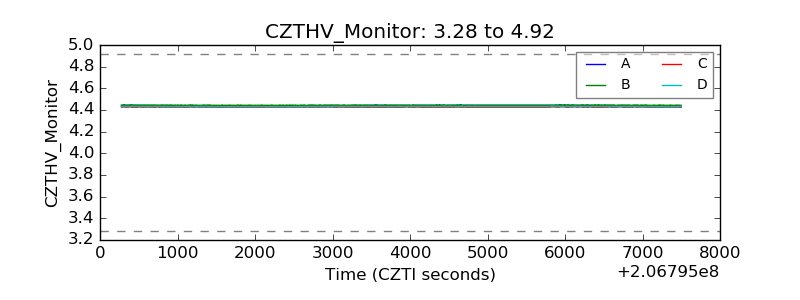 |
| D_VDD | 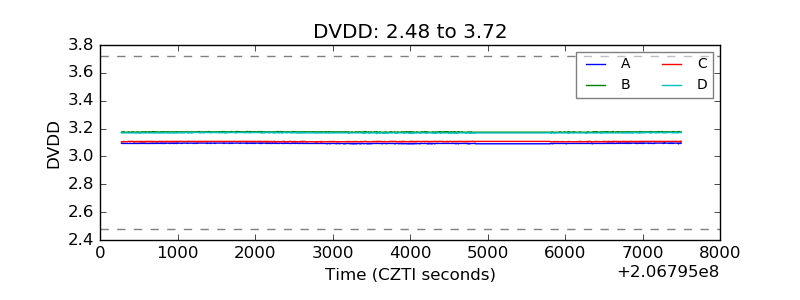 |
| Temperature 1 | 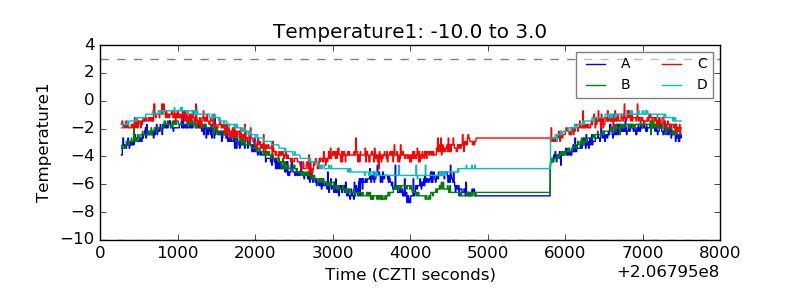 |
| Veto HV Monitor | 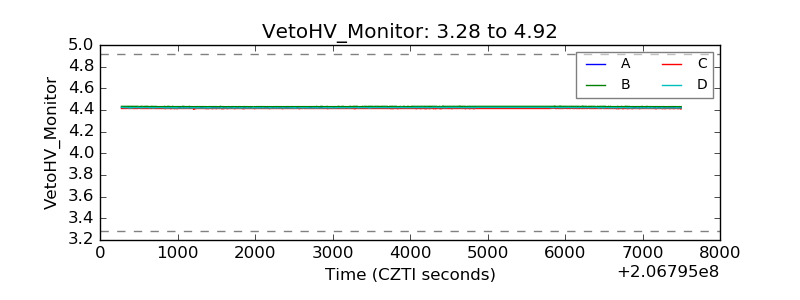 |
| Veto LLD | 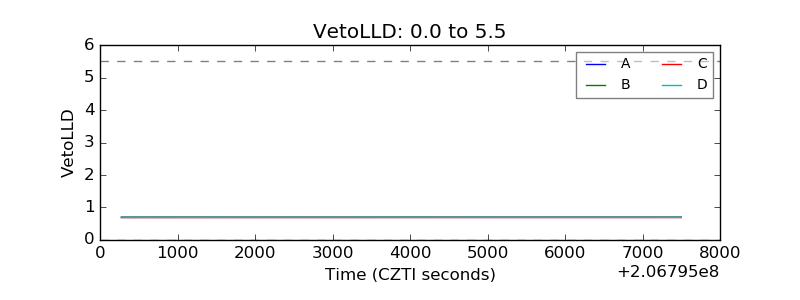 |
| Alpha Counter | 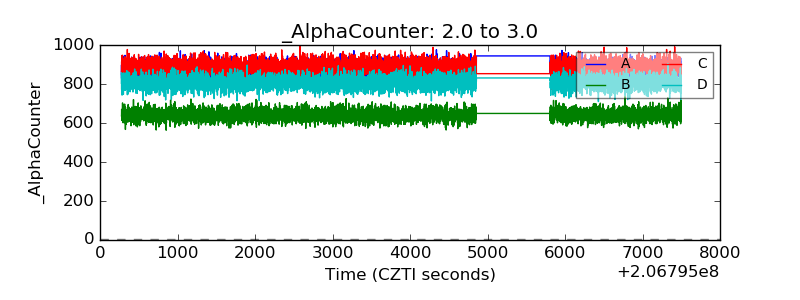 |
| _CPM_Rate | 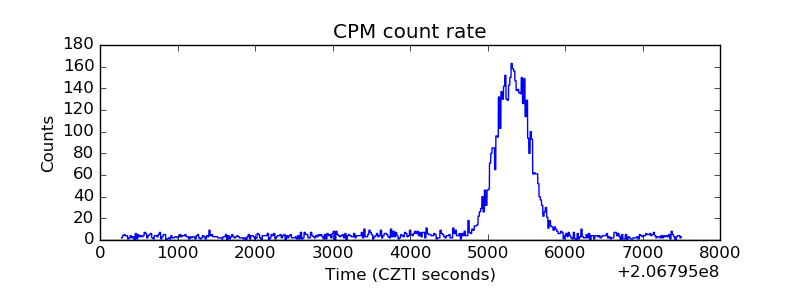 |
| CZT Counter | 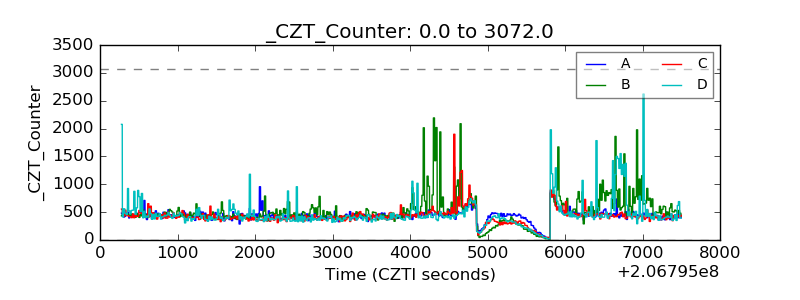 |
| +2.5 Volts monitor |  |
| +5 Volts monitor | 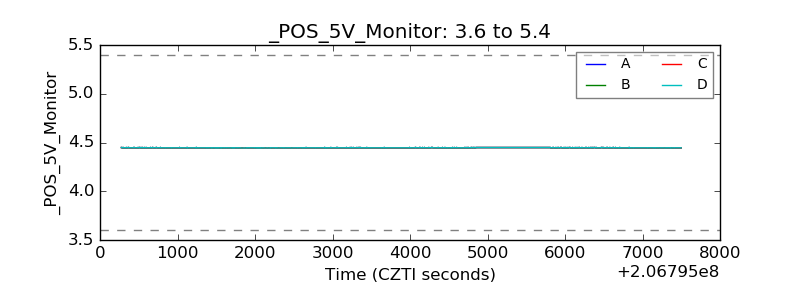 |
| _ROLL_ROT | 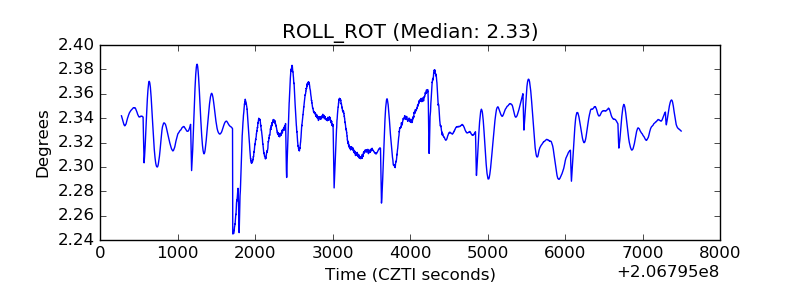 |
| _Roll_DEC | 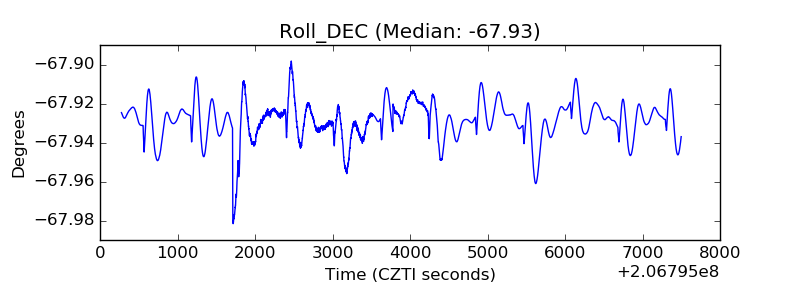 |
| _Roll_RA | 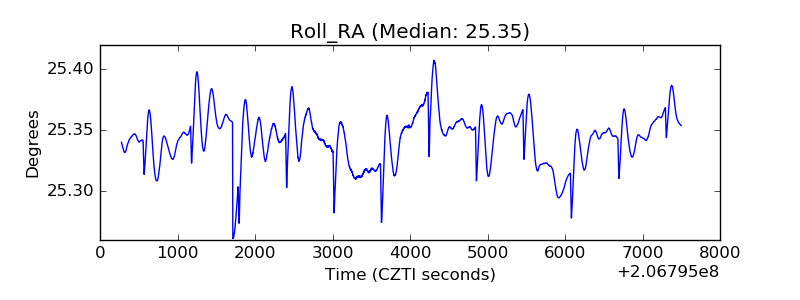 |
| Veto Counter | 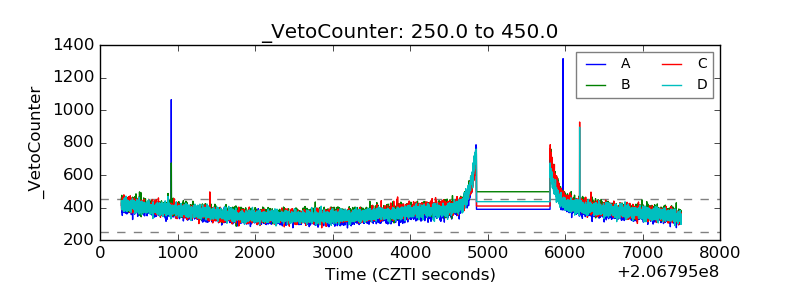 |