| Param | Original file | Final file |
|---|---|---|
| Filename | modeM0/AS1G05_230T02_9000000548_04404cztM0_level2.evt | modeM0/AS1G05_230T02_9000000548_04404cztM0_level2_quad_clean.evt |
| Size (bytes) | 452,304,000 | 73,186,560 |
| Size | 431.4 MB | 69.8 MB |
| Events in quadrant A | 2,955,678 | 443,520 |
| Events in quadrant B | 3,919,521 | 434,621 |
| Events in quadrant C | 3,048,499 | 437,385 |
| Events in quadrant D | 3,313,615 | 428,324 |
| Mode M9 | |||
|---|---|---|---|
| Quadrant | BADHDUFLAG | Total packets | Discarded packets |
| A | 0 | 3 | 0 |
| B | 0 | 3 | 0 |
| C | 0 | 3 | 0 |
| D | 0 | 3 | 0 |
| Mode SS | |||
|---|---|---|---|
| Quadrant | BADHDUFLAG | Total packets | Discarded packets |
| A | 0 | 140 | 0 |
| B | 0 | 140 | 0 |
| C | 0 | 140 | 0 |
| D | 0 | 140 | 0 |
| Mode M0 | |||
|---|---|---|---|
| Quadrant | BADHDUFLAG | Total packets | Discarded packets |
| A | 0 | 13888 | 2 |
| B | 0 | 16306 | 1 |
| C | 0 | 14118 | 1 |
| D | 0 | 15117 | 1 |
| Quadrant | Total seconds | Saturated seconds | Saturation percentage |
|---|---|---|---|
| A | 6766 | 57 | 0.842448% |
| B | 6766 | 189 | 2.793379% |
| C | 6766 | 48 | 0.709430% |
| D | 6766 | 108 | 1.596216% |
Noise dominated data is calculated using 1-second bins in cleaned event files. If a bin has >2000 counts, and if more than 50% of those come from <1% of pixels, then it is considered to be noise-dominated and hence unusable.
| Quadrant | # 1 sec bins | Bins with >0 counts | Bins with >2000 counts | High rate bins dominated by noise | Noise dominated (total time) | Noise dominated (detector-on time) | Marked lightcurve |
|---|---|---|---|---|---|---|---|
| A | 7121 | 6767 | 1 | 1 | 0.01% | 0.01% | 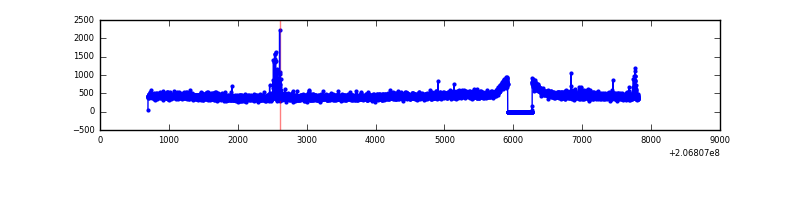 |
| B | 7121 | 6767 | 97 | 97 | 1.36% | 1.43% | 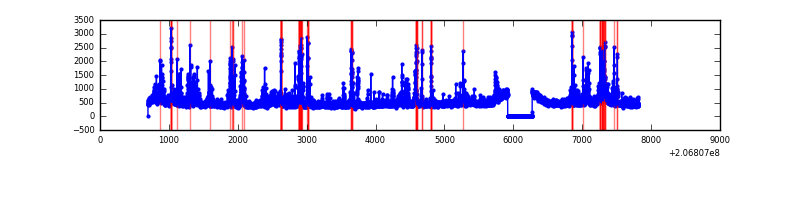 |
| C | 7121 | 6767 | 22 | 22 | 0.31% | 0.33% | 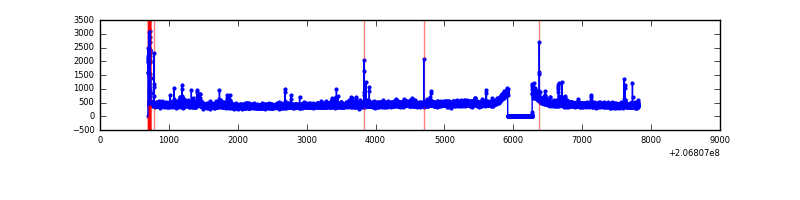 |
| D | 7121 | 6767 | 100 | 100 | 1.40% | 1.48% | 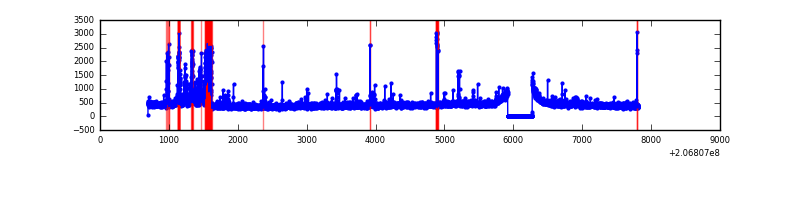 |
Top three noisy pixels from each quadrant. If the there are fewer than three noisy pixels in the level2.evt file, extra rows are filled as -1
| Pixel properties | Quadrant properties | ||||||
|---|---|---|---|---|---|---|---|
| Quadrant | DetID | PixID | Counts | Sigma | Mean | Median | Sigma |
| A | 0 | 50 | 47489 | 300.49 | 754 | 735 | 155.6 |
| A | 12 | 194 | 7808 | 45.46 | 754 | 735 | 155.6 |
| A | 0 | 226 | 7570 | 43.93 | 754 | 735 | 155.6 |
| B | 14 | 167 | 513722 | 3510.45 | 754 | 735 | 146.1 |
| B | 10 | 16 | 410329 | 2802.92 | 754 | 735 | 146.1 |
| B | 0 | 231 | 30382 | 202.88 | 754 | 735 | 146.1 |
| C | 9 | 247 | 138384 | 805.37 | 732 | 735 | 170.9 |
| C | 9 | 16 | 16860 | 94.35 | 732 | 735 | 170.9 |
| C | 14 | 48 | 16177 | 90.35 | 732 | 735 | 170.9 |
| D | 2 | 37 | 264125 | 1507.79 | 730 | 708 | 174.7 |
| D | 9 | 35 | 111926 | 636.61 | 730 | 708 | 174.7 |
| D | 8 | 112 | 36905 | 207.19 | 730 | 708 | 174.7 |
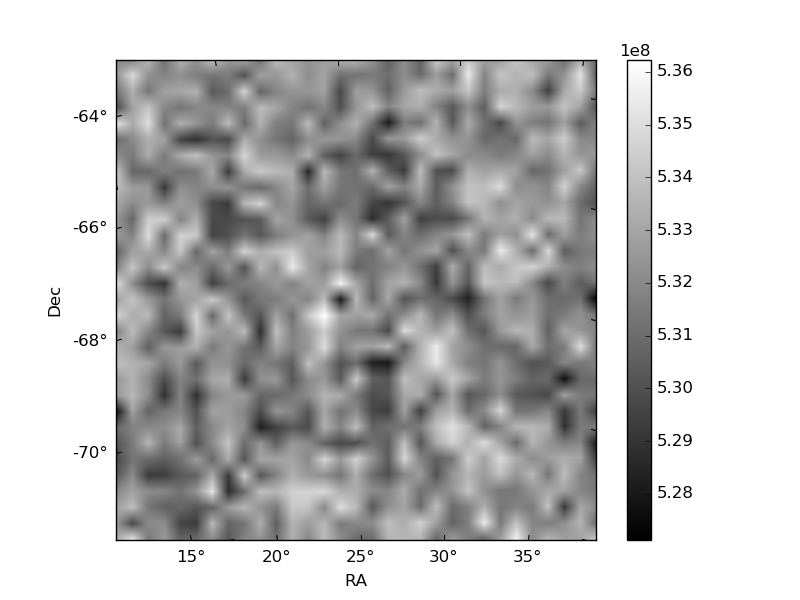
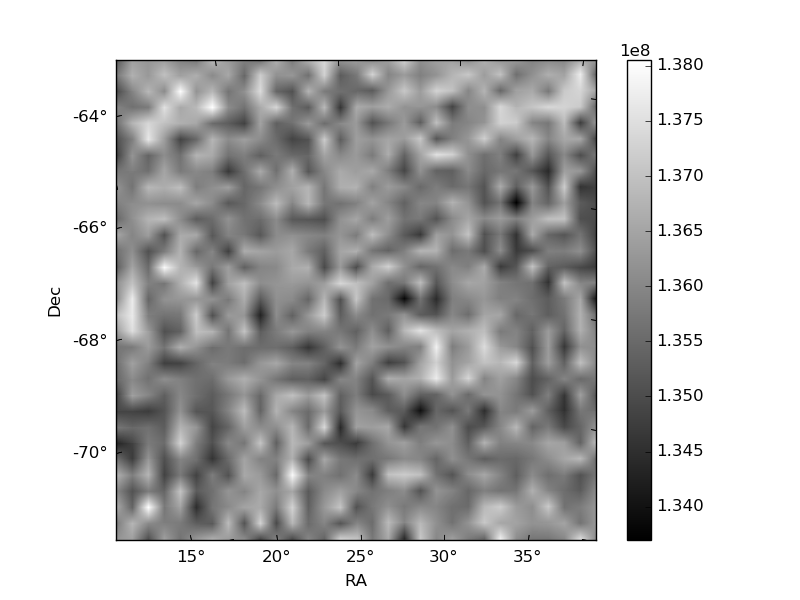
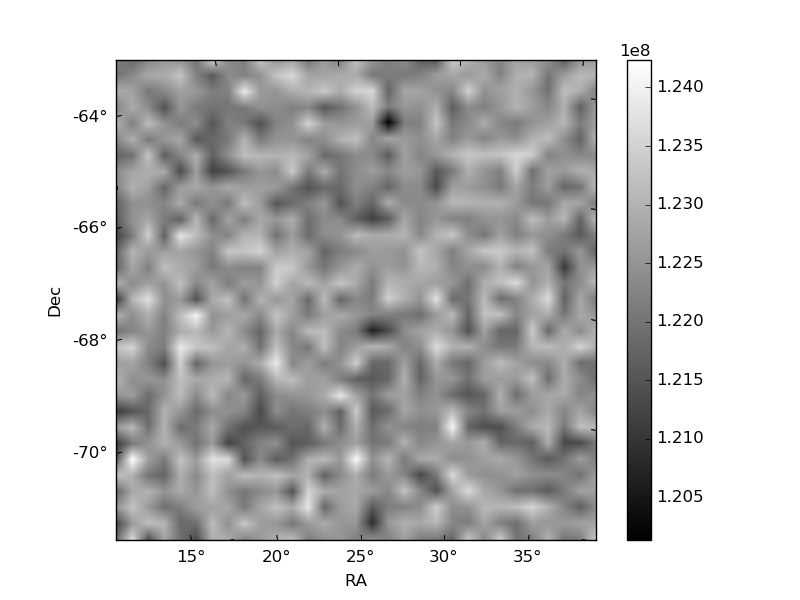
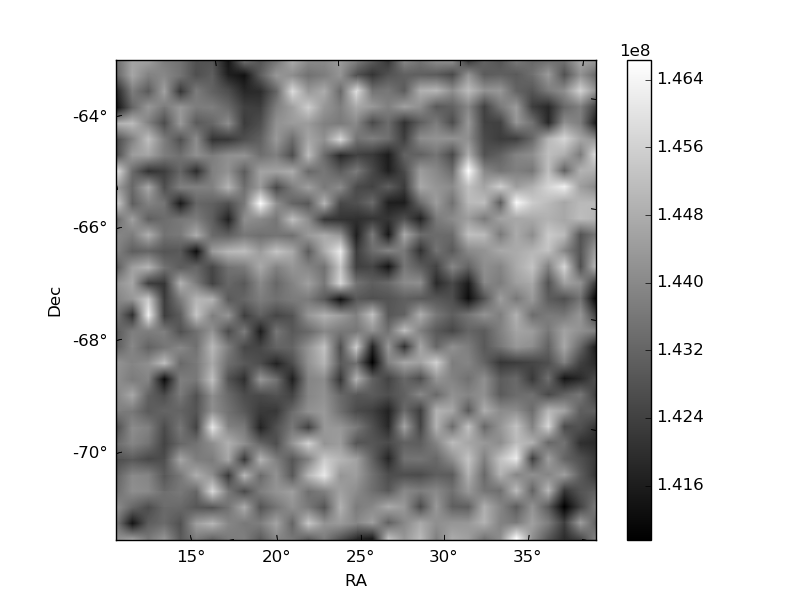
Histogram calculated using DETX and DETY for each event in the final _common_clean file
| Quadrant A | 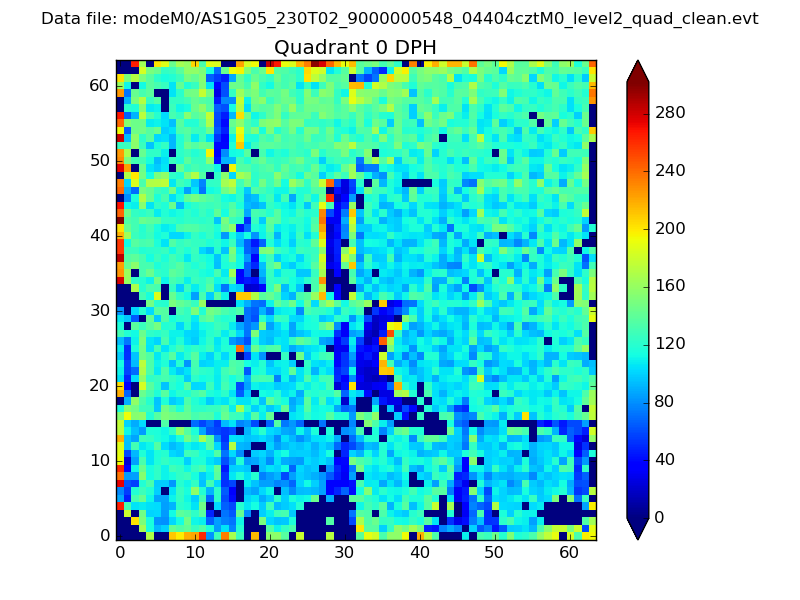 |
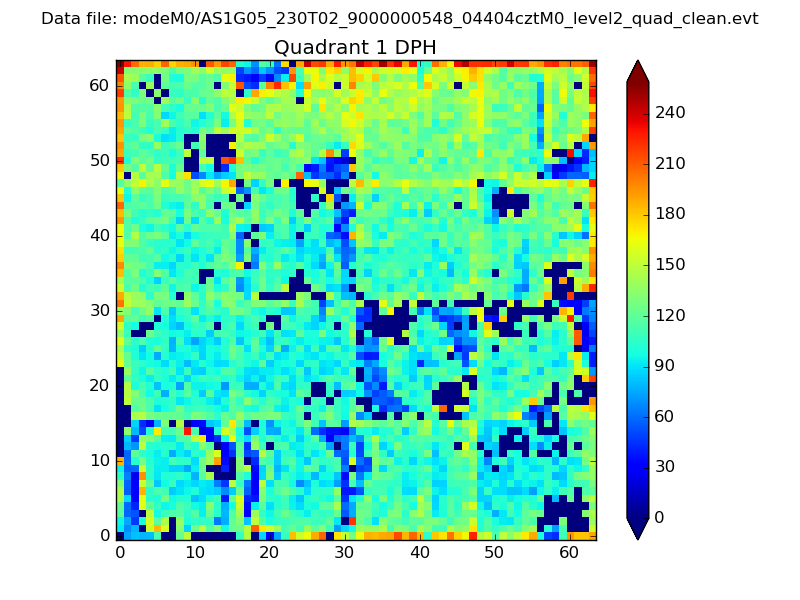 |
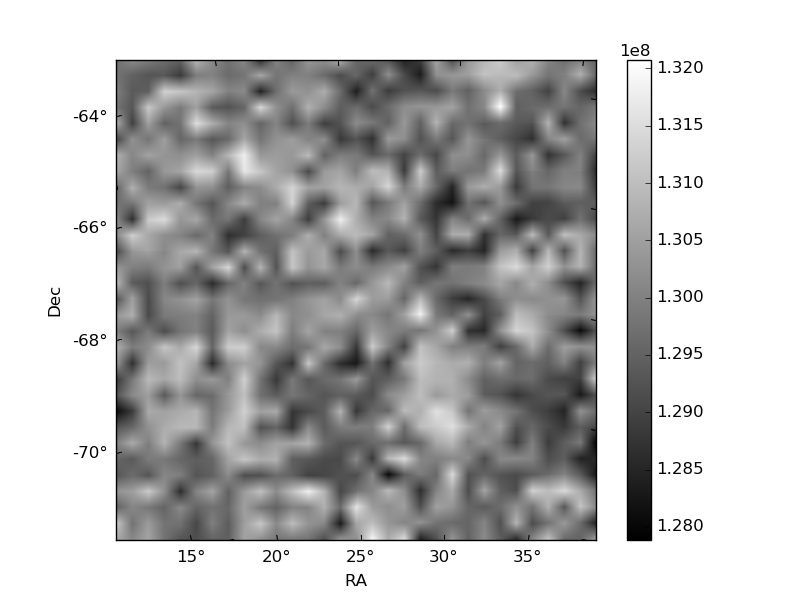
Quadrant B |
|---|---|---|---|
| Quadrant D | 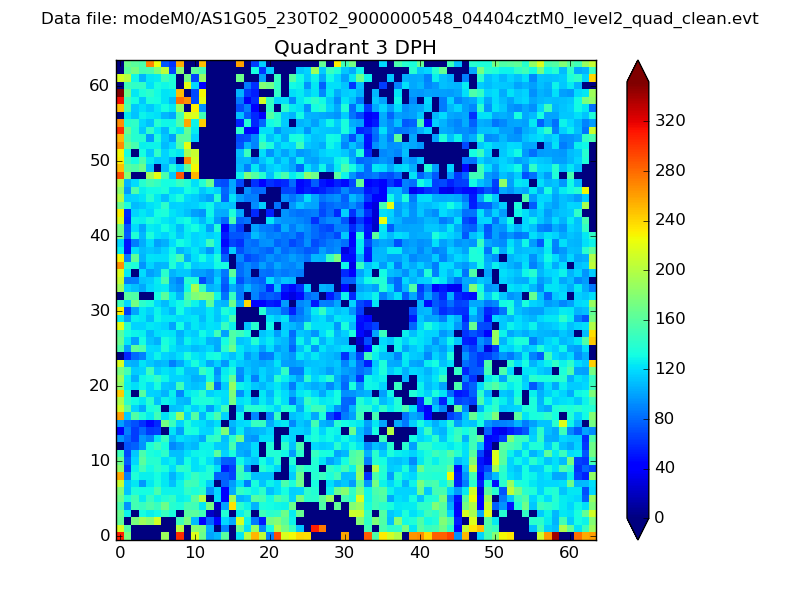 |
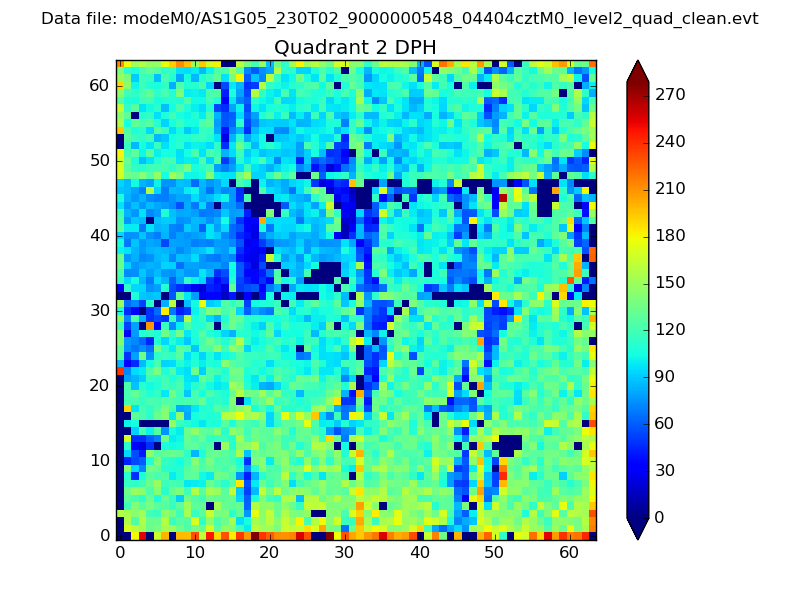 |
Quadrant C |
| Plot type | Count rate plots | Images |
|---|---|---|
| Comparison with Poisson distribution Blue bars denote a histogram of data divided into 1 sec bins. Red curve is a Poisson curve with rate = median count rate of data. |
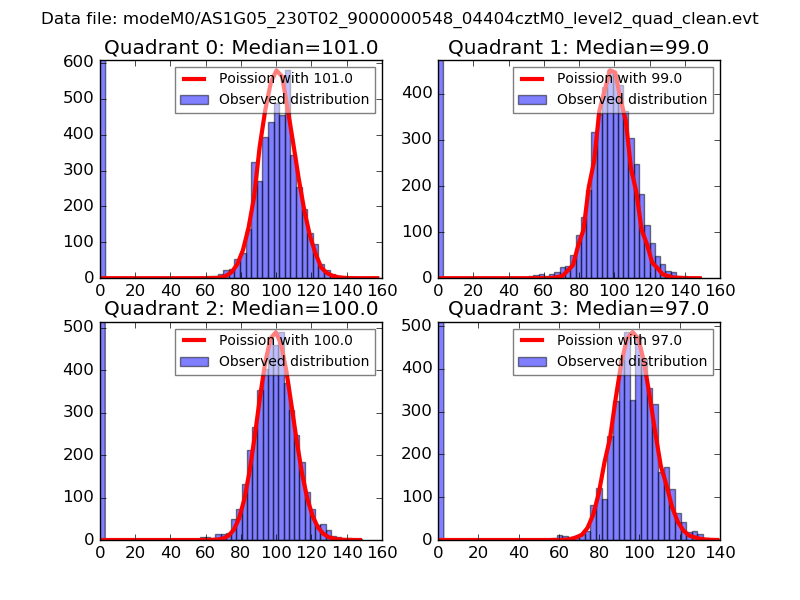 |
 |
| Quadrant-wise count rates Data is divided into 100 sec bins |
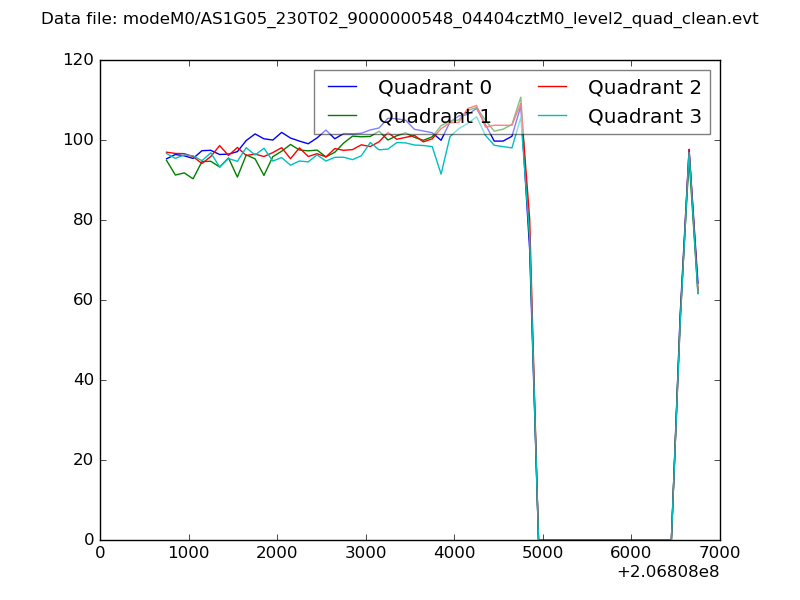 |
|
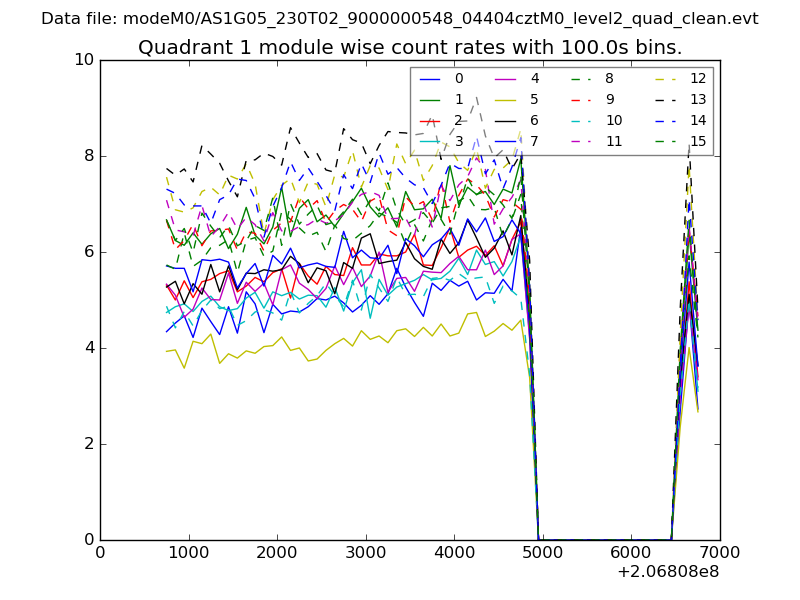
| Module-wise count rates for Quadrant A Data is divided into 100 sec bins |
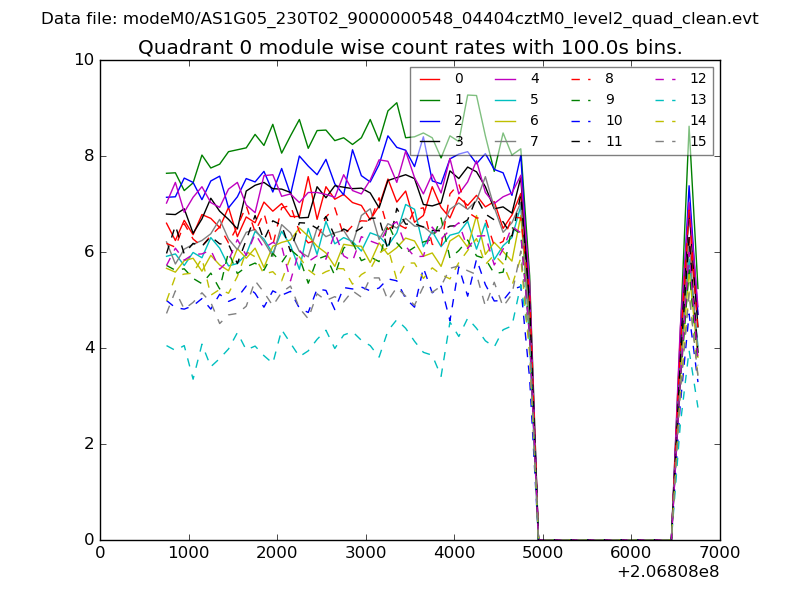 |
 |
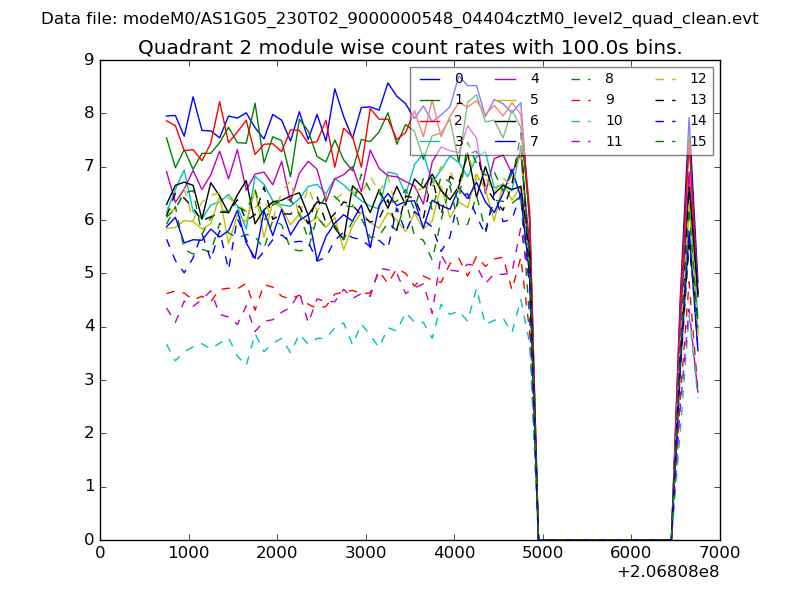
| Module-wise count rates for Quadrant B Data is divided into 100 sec bins |
 |
 |
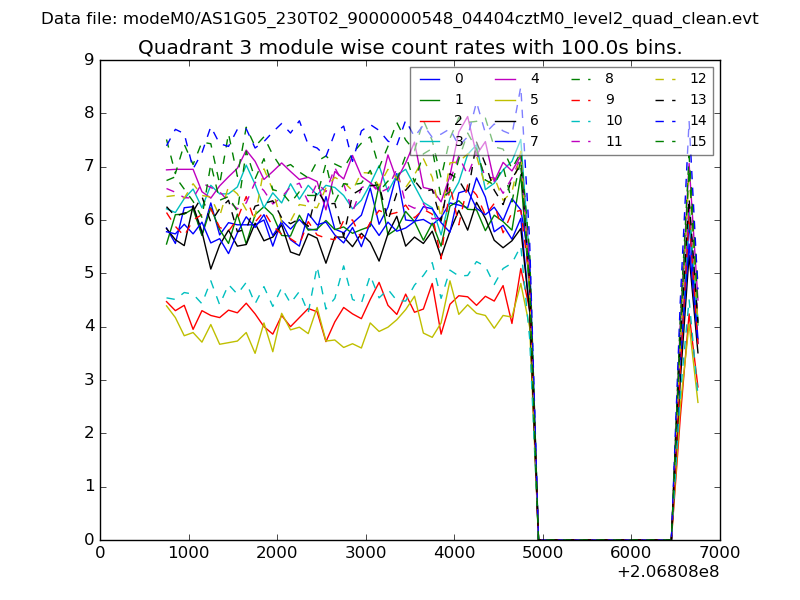
| Module-wise count rates for Quadrant C Data is divided into 100 sec bins |
 |
 |
| Module-wise count rates for Quadrant D Data is divided into 100 sec bins |
 |
 |
| Parameter | Plot |
|---|---|
| CZT HV Monitor | 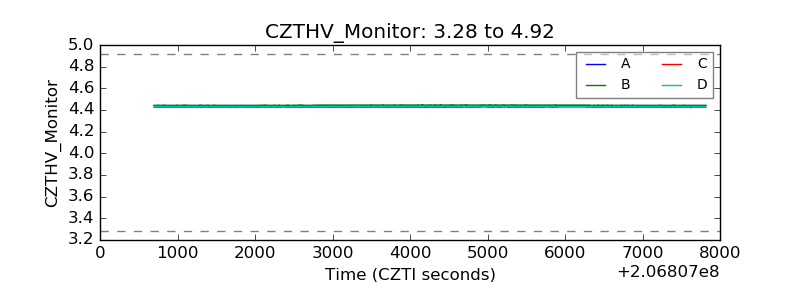 |
| D_VDD | 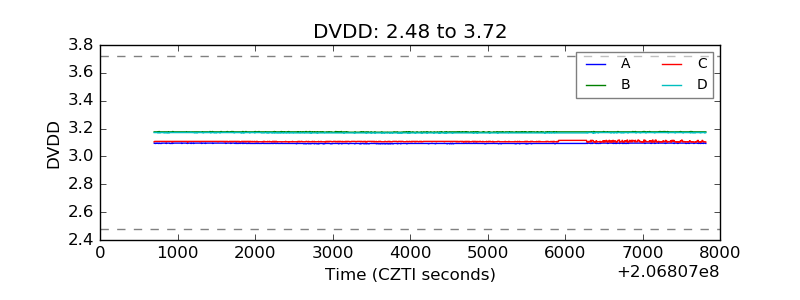 |
| Temperature 1 | 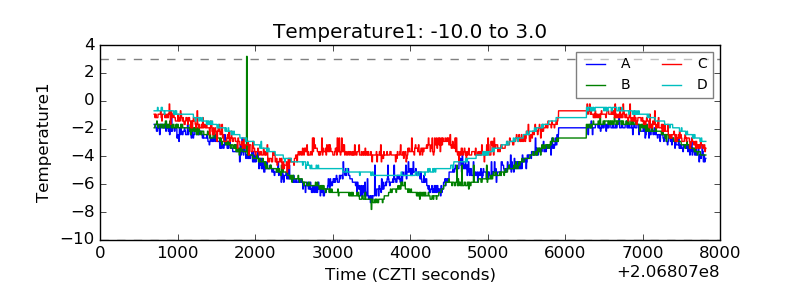 |
| Veto HV Monitor | 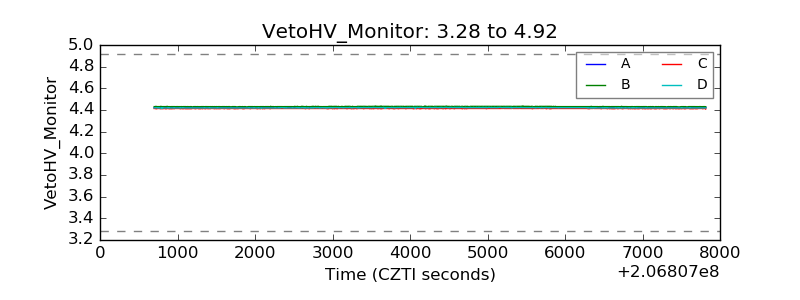 |
| Veto LLD |  |
| Alpha Counter | 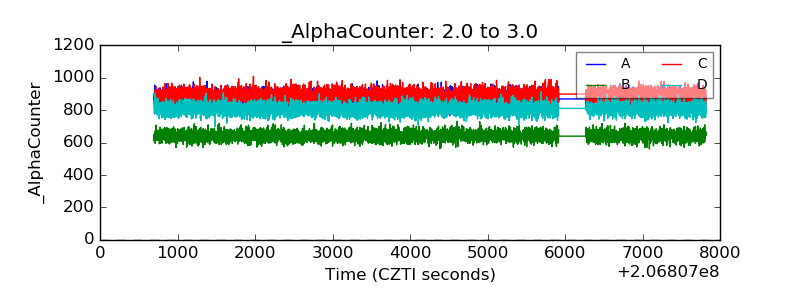 |
| _CPM_Rate | 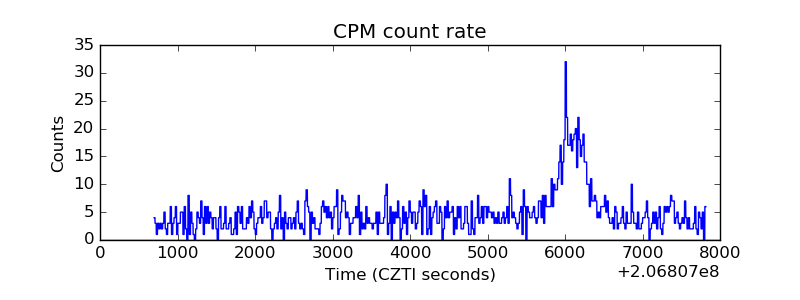 |
| CZT Counter | 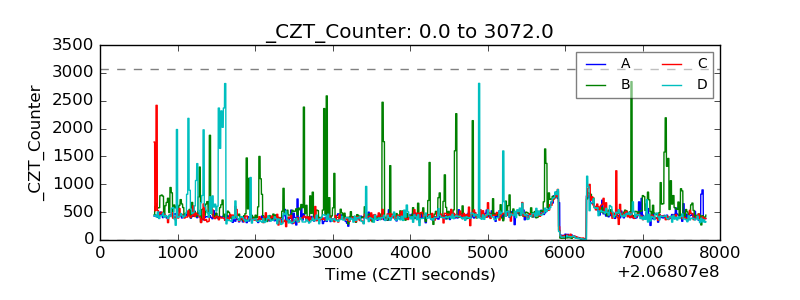 |
| +2.5 Volts monitor |  |
| +5 Volts monitor |  |
| _ROLL_ROT | 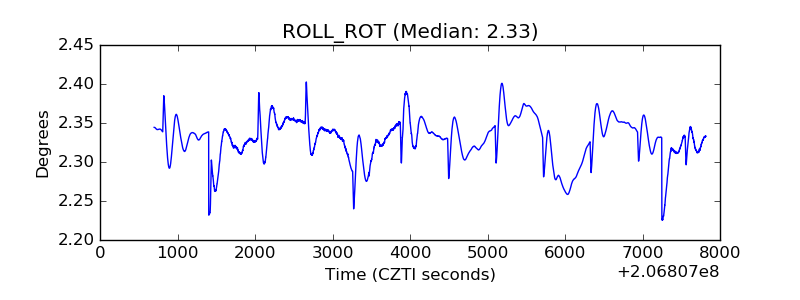 |
| _Roll_DEC | 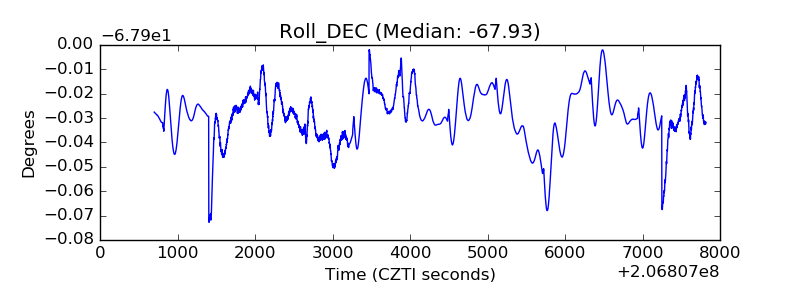 |
| _Roll_RA | 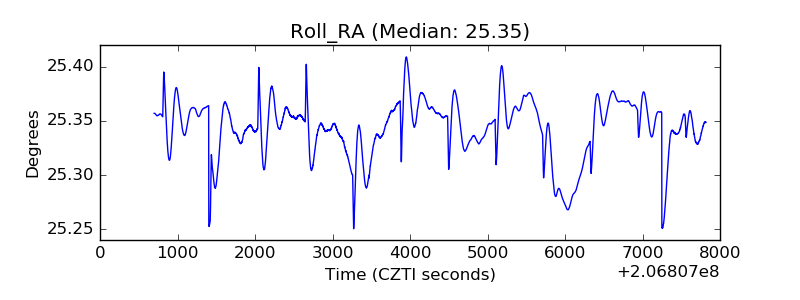 |
| Veto Counter | 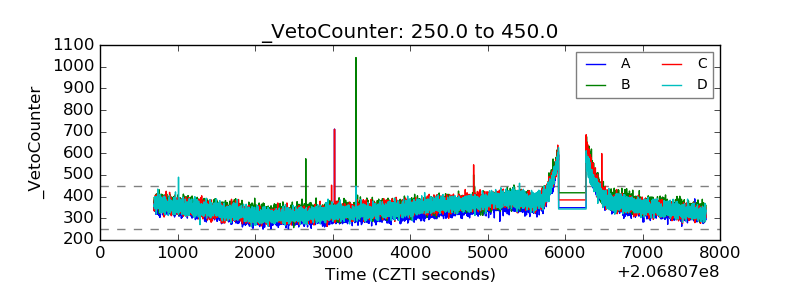 |