| Param | Original file | Final file |
|---|---|---|
| Filename | modeM0/AS1G05_230T02_9000000548_04405cztM0_level2.evt | modeM0/AS1G05_230T02_9000000548_04405cztM0_level2_quad_clean.evt |
| Size (bytes) | 460,653,120 | 84,271,680 |
| Size | 439.3 MB | 80.4 MB |
| Events in quadrant A | 3,135,772 | 522,920 |
| Events in quadrant B | 3,716,020 | 513,496 |
| Events in quadrant C | 3,392,699 | 514,759 |
| Events in quadrant D | 3,224,609 | 507,151 |
| Mode M9 | |||
|---|---|---|---|
| Quadrant | BADHDUFLAG | Total packets | Discarded packets |
| A | 0 | 3 | 0 |
| B | 0 | 3 | 0 |
| C | 0 | 3 | 0 |
| D | 0 | 3 | 0 |
| Mode SS | |||
|---|---|---|---|
| Quadrant | BADHDUFLAG | Total packets | Discarded packets |
| A | 0 | 142 | 0 |
| B | 0 | 142 | 0 |
| C | 0 | 142 | 0 |
| D | 0 | 142 | 0 |
| Mode M0 | |||
|---|---|---|---|
| Quadrant | BADHDUFLAG | Total packets | Discarded packets |
| A | 0 | 14624 | 2 |
| B | 0 | 16048 | 1 |
| C | 0 | 15285 | 1 |
| D | 0 | 15176 | 1 |
| Quadrant | Total seconds | Saturated seconds | Saturation percentage |
|---|---|---|---|
| A | 7093 | 86 | 1.212463% |
| B | 7093 | 184 | 2.594107% |
| C | 7093 | 68 | 0.958692% |
| D | 7093 | 75 | 1.057381% |
Noise dominated data is calculated using 1-second bins in cleaned event files. If a bin has >2000 counts, and if more than 50% of those come from <1% of pixels, then it is considered to be noise-dominated and hence unusable.
| Quadrant | # 1 sec bins | Bins with >0 counts | Bins with >2000 counts | High rate bins dominated by noise | Noise dominated (total time) | Noise dominated (detector-on time) | Marked lightcurve |
|---|---|---|---|---|---|---|---|
| A | 7358 | 7094 | 4 | 4 | 0.05% | 0.06% |  |
| B | 7358 | 7094 | 70 | 70 | 0.95% | 0.99% |  |
| C | 7358 | 7094 | 22 | 22 | 0.30% | 0.31% | 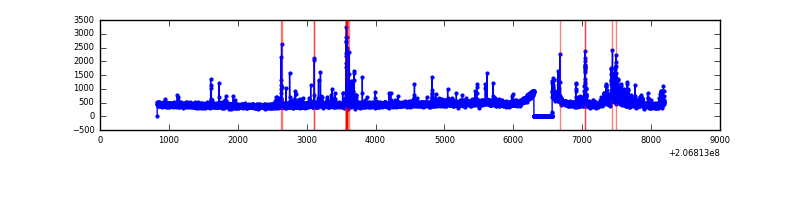 |
| D | 7358 | 7094 | 42 | 42 | 0.57% | 0.59% | 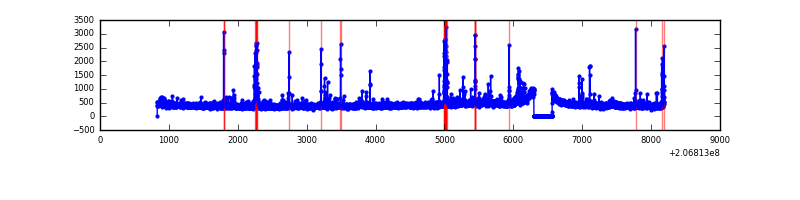 |
Top three noisy pixels from each quadrant. If the there are fewer than three noisy pixels in the level2.evt file, extra rows are filled as -1
| Pixel properties | Quadrant properties | ||||||
|---|---|---|---|---|---|---|---|
| Quadrant | DetID | PixID | Counts | Sigma | Mean | Median | Sigma |
| A | 0 | 50 | 70455 | 428.17 | 790 | 770 | 162.7 |
| A | 8 | 15 | 12136 | 69.84 | 790 | 770 | 162.7 |
| A | 12 | 194 | 8227 | 45.82 | 790 | 770 | 162.7 |
| B | 10 | 16 | 412207 | 2676.99 | 791 | 771 | 153.7 |
| B | 14 | 167 | 105780 | 683.24 | 791 | 771 | 153.7 |
| B | 7 | 252 | 30463 | 193.19 | 791 | 771 | 153.7 |
| C | 9 | 247 | 312937 | 1763.27 | 762 | 766 | 177.0 |
| C | 12 | 4 | 26112 | 143.16 | 762 | 766 | 177.0 |
| C | 9 | 16 | 24334 | 133.12 | 762 | 766 | 177.0 |
| D | 13 | 239 | 79747 | 426.44 | 763 | 739 | 185.3 |
| D | 12 | 233 | 70158 | 374.68 | 763 | 739 | 185.3 |
| D | 2 | 14 | 33766 | 178.26 | 763 | 739 | 185.3 |
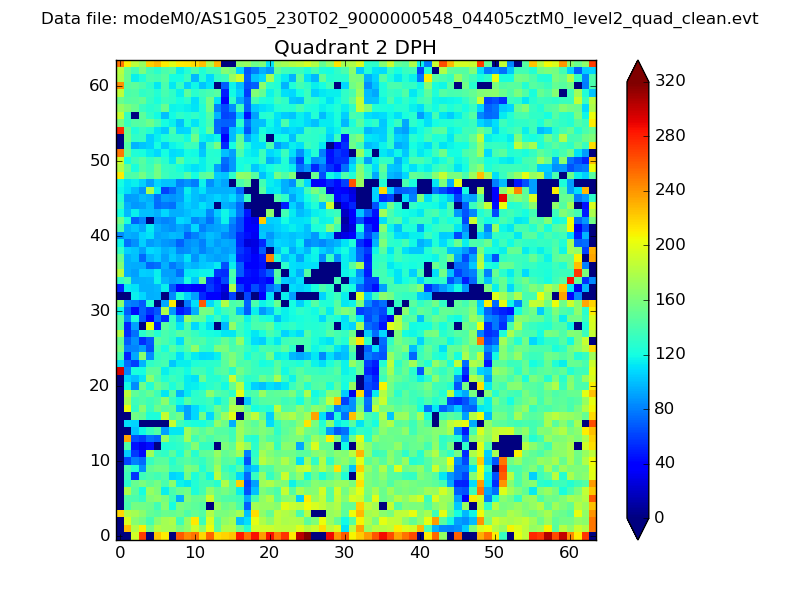
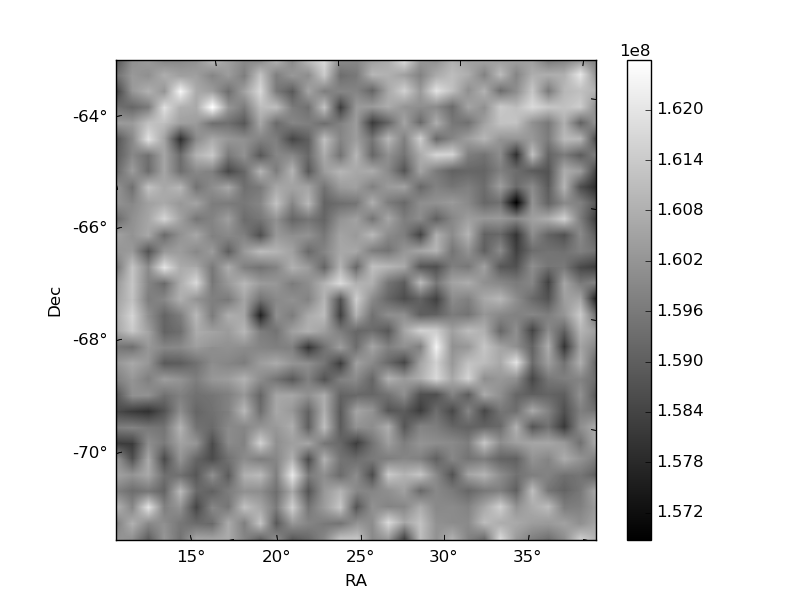
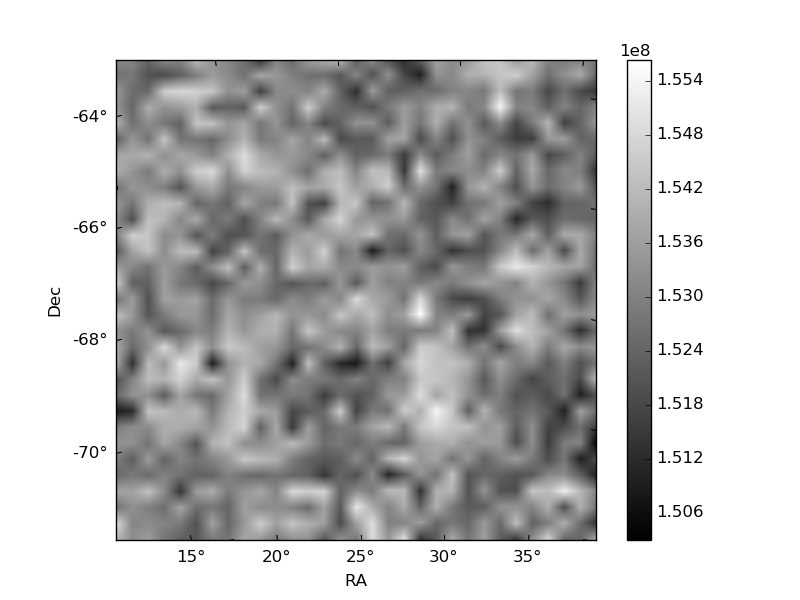
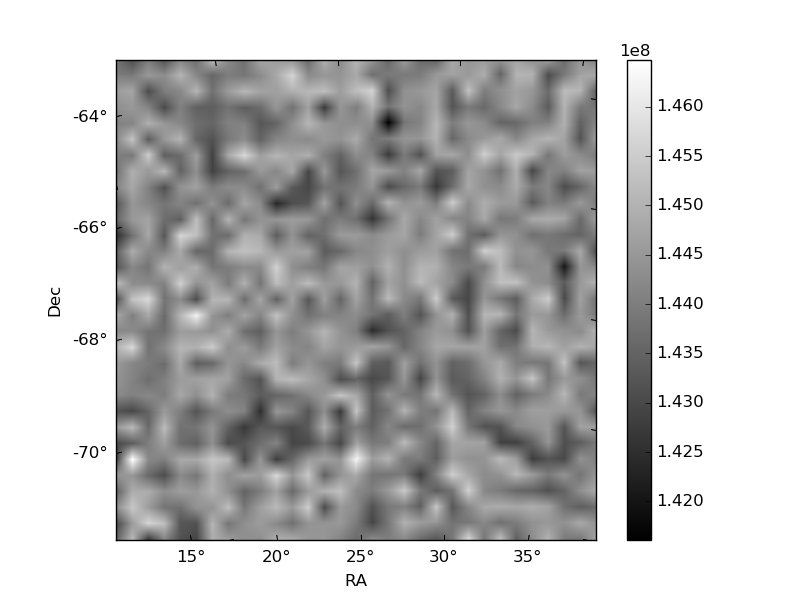
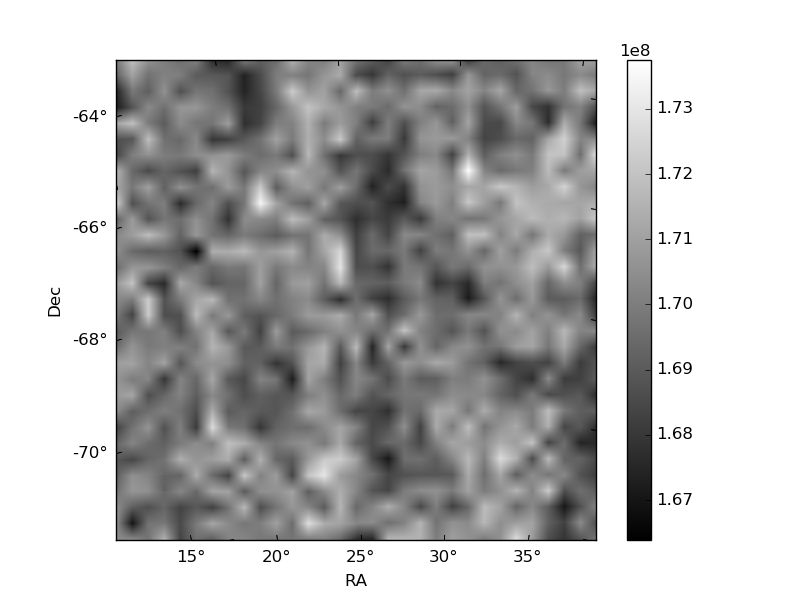
Histogram calculated using DETX and DETY for each event in the final _common_clean file
| Quadrant A | 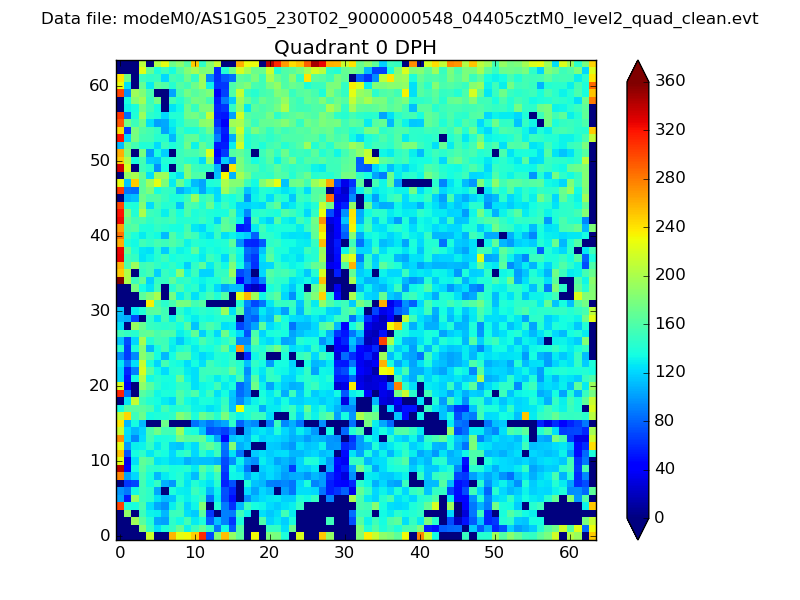 |
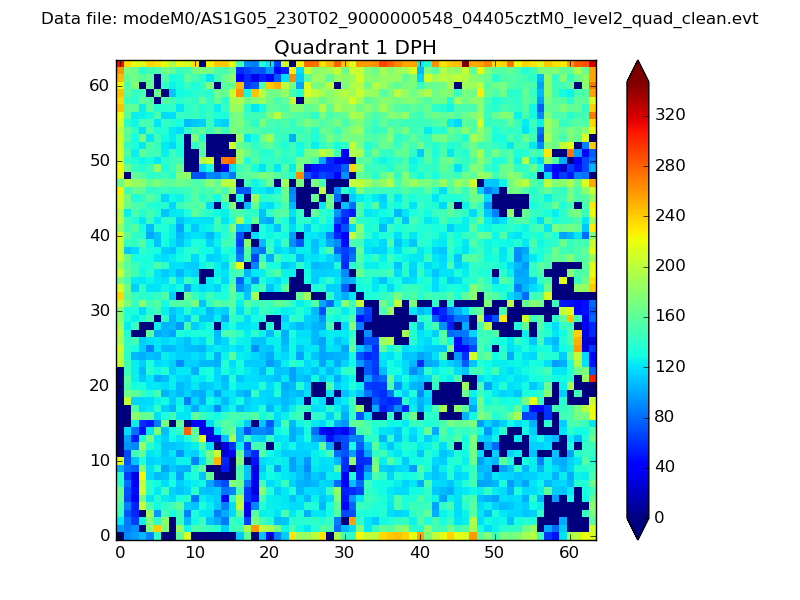 |
Quadrant B |
|---|---|---|---|
| Quadrant D | 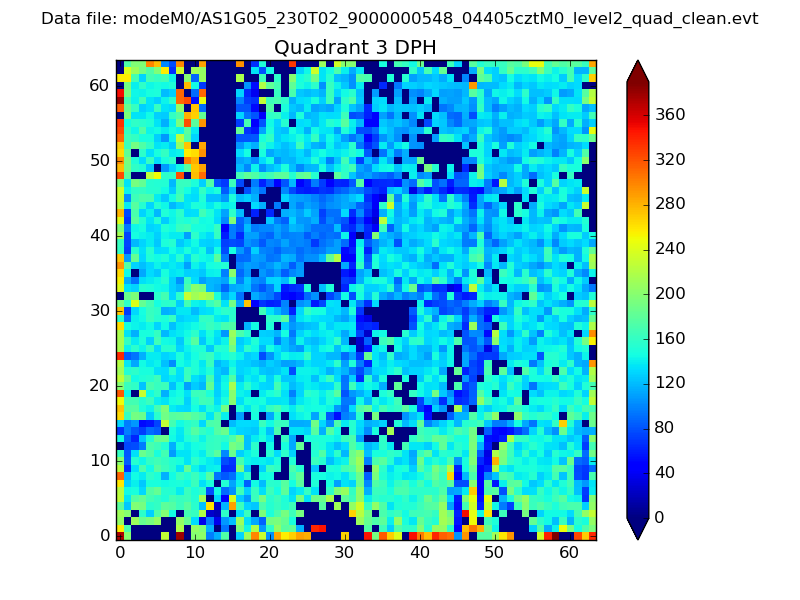 |
 |
Quadrant C |
| Plot type | Count rate plots | Images |
|---|---|---|
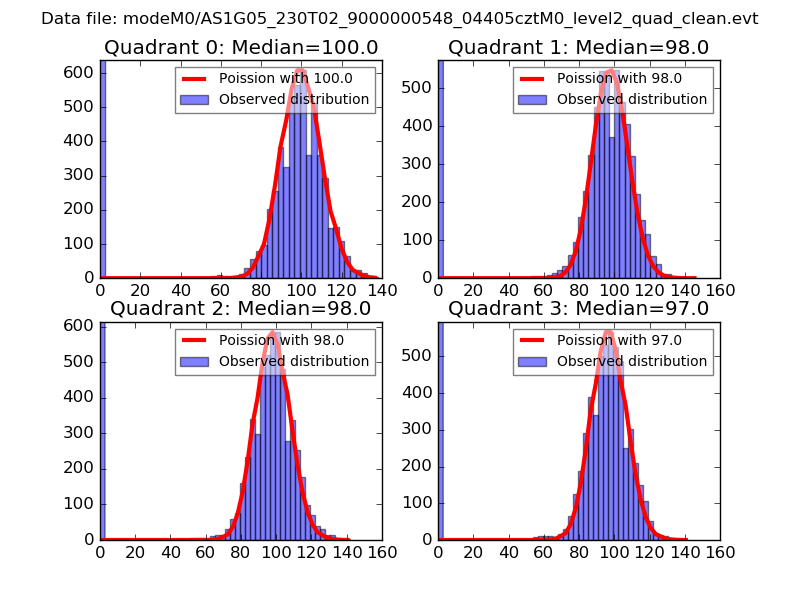
| Comparison with Poisson distribution Blue bars denote a histogram of data divided into 1 sec bins. Red curve is a Poisson curve with rate = median count rate of data. |
 |
 |
| Quadrant-wise count rates Data is divided into 100 sec bins |
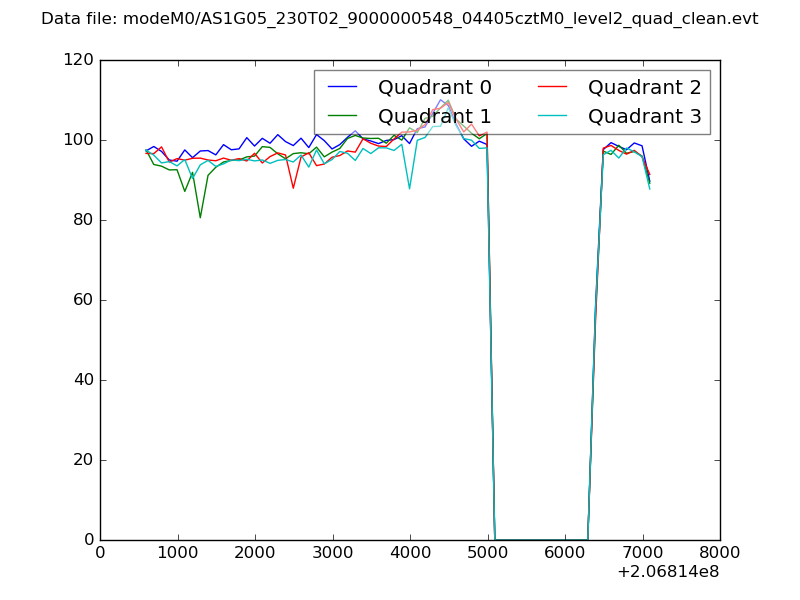 |
|
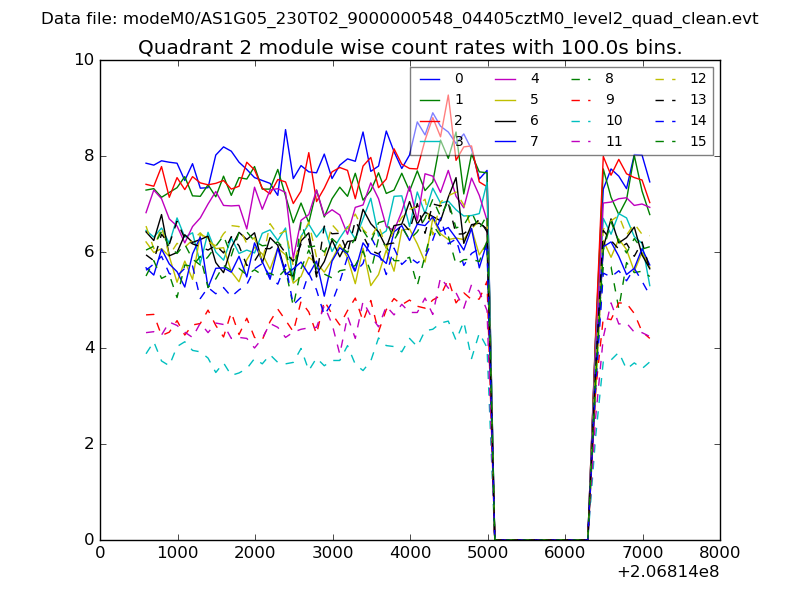
| Module-wise count rates for Quadrant A Data is divided into 100 sec bins |
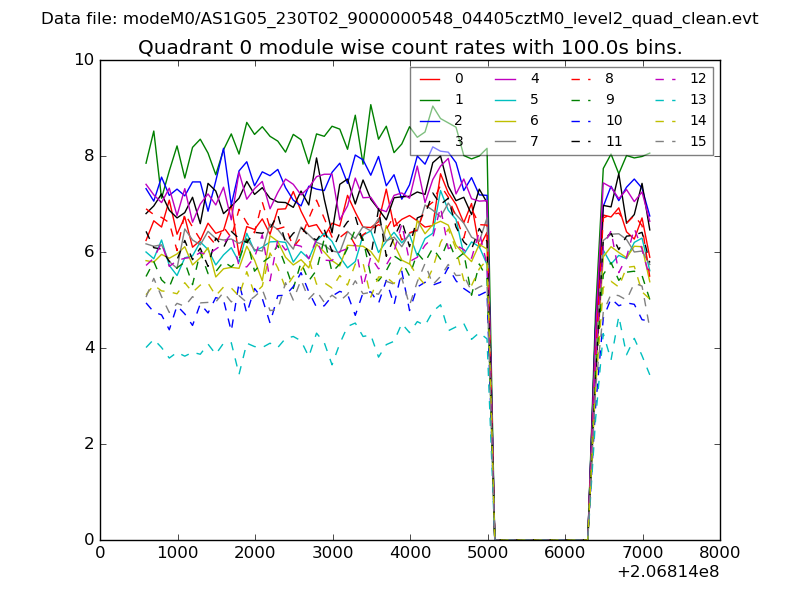 |
 |
| Module-wise count rates for Quadrant B Data is divided into 100 sec bins |
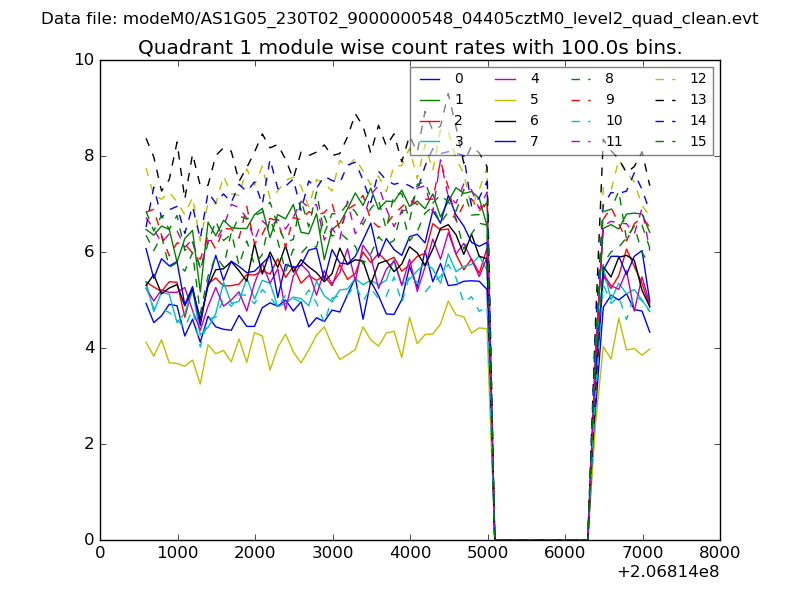 |
 |
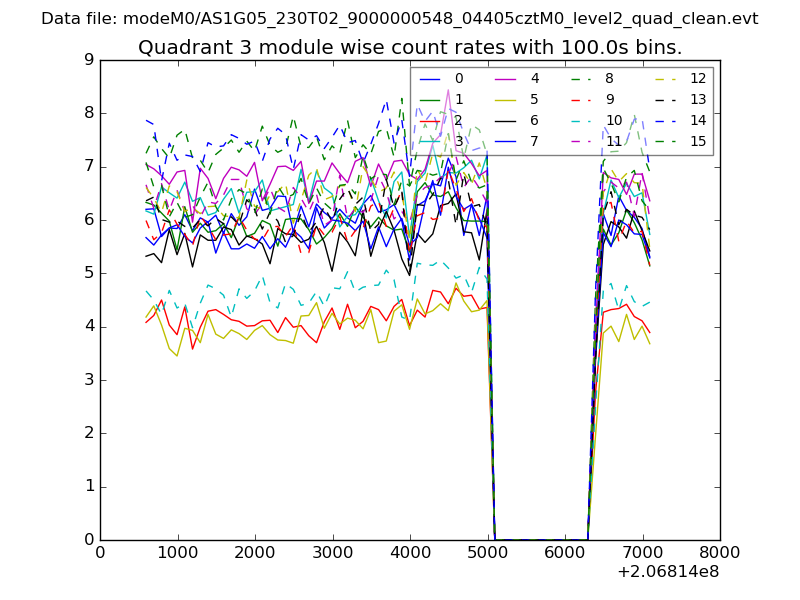
| Module-wise count rates for Quadrant C Data is divided into 100 sec bins |
 |
 |
| Module-wise count rates for Quadrant D Data is divided into 100 sec bins |
 |
 |
| Parameter | Plot |
|---|---|
| CZT HV Monitor | 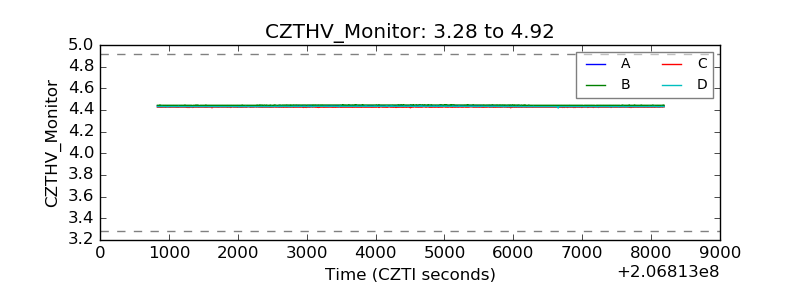 |
| D_VDD | 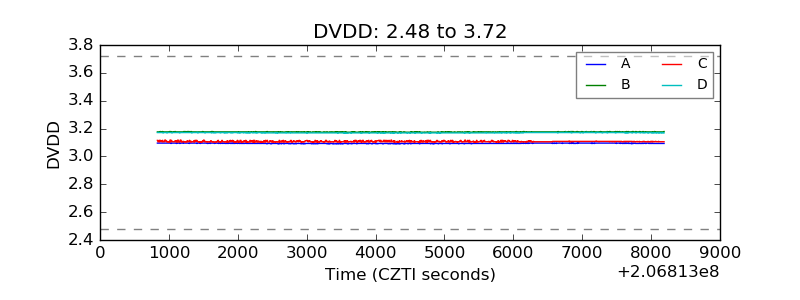 |
| Temperature 1 | 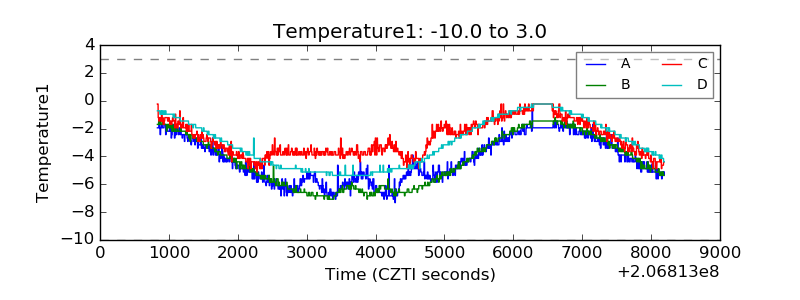 |
| Veto HV Monitor | 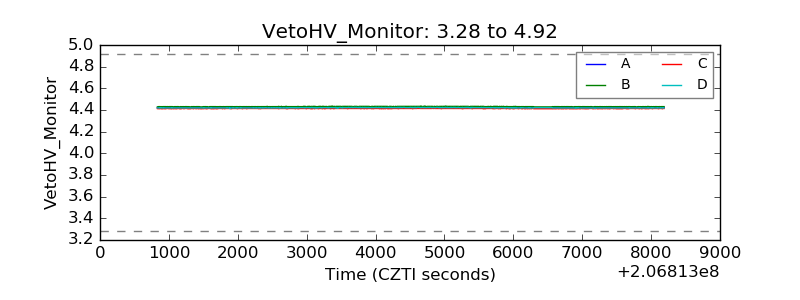 |
| Veto LLD | 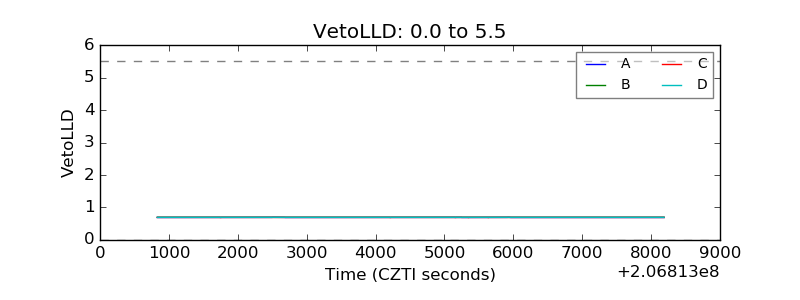 |
| Alpha Counter | 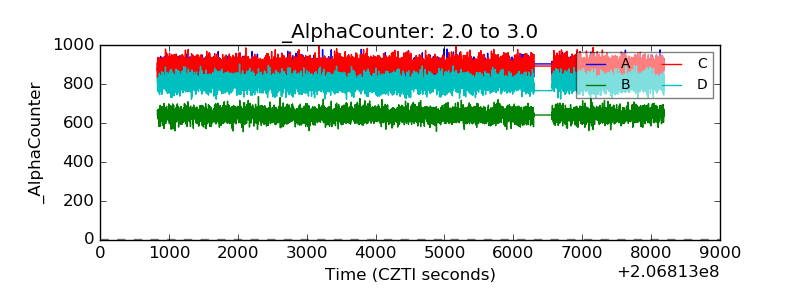 |
| _CPM_Rate | 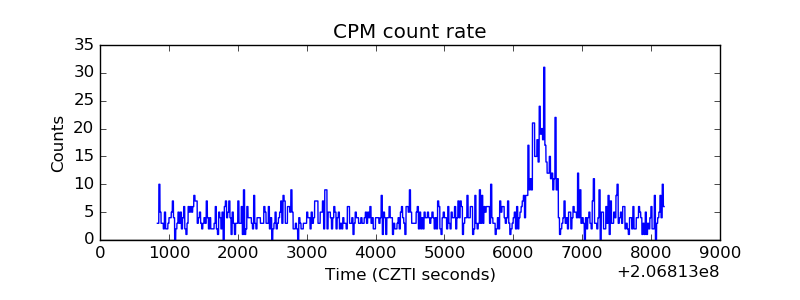 |
| CZT Counter | 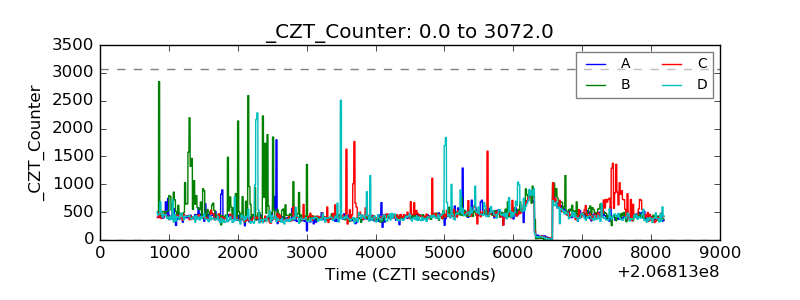 |
| +2.5 Volts monitor |  |
| +5 Volts monitor |  |
| _ROLL_ROT | 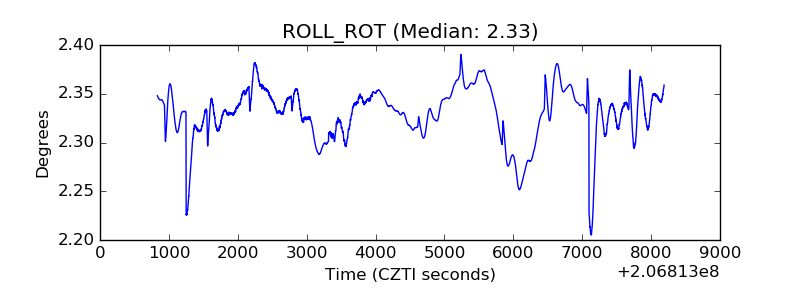 |
| _Roll_DEC | 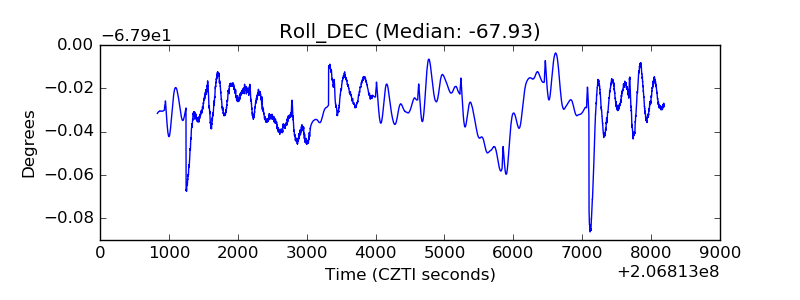 |
| _Roll_RA | 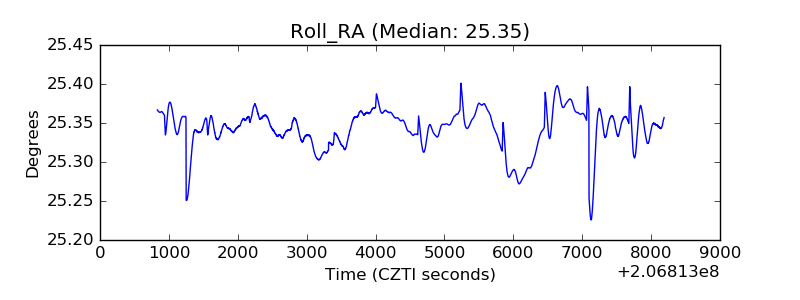 |
| Veto Counter | 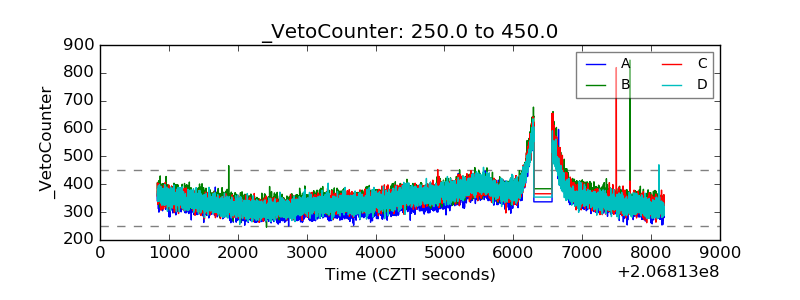 |