| Param | Original file | Final file |
|---|---|---|
| Filename | modeM0/AS1G05_230T02_9000000548_04409cztM0_level2.evt | modeM0/AS1G05_230T02_9000000548_04409cztM0_level2_quad_clean.evt |
| Size (bytes) | 815,506,560 | 167,316,480 |
| Size | 777.7 MB | 159.6 MB |
| Events in quadrant A | 5,766,123 | 1,060,803 |
| Events in quadrant B | 5,945,499 | 1,049,683 |
| Events in quadrant C | 6,149,768 | 1,045,910 |
| Events in quadrant D | 5,962,668 | 1,020,599 |
| Mode M9 | |||
|---|---|---|---|
| Quadrant | BADHDUFLAG | Total packets | Discarded packets |
| A | 0 | 10 | 0 |
| B | 0 | 10 | 0 |
| C | 0 | 10 | 0 |
| D | 0 | 10 | 0 |
| Mode SS | |||
|---|---|---|---|
| Quadrant | BADHDUFLAG | Total packets | Discarded packets |
| A | 0 | 262 | 0 |
| B | 0 | 262 | 0 |
| C | 0 | 262 | 0 |
| D | 0 | 262 | 0 |
| Mode M0 | |||
|---|---|---|---|
| Quadrant | BADHDUFLAG | Total packets | Discarded packets |
| A | 0 | 26795 | 2 |
| B | 0 | 26952 | 2 |
| C | 0 | 27698 | 2 |
| D | 0 | 27832 | 2 |
| Quadrant | Total seconds | Saturated seconds | Saturation percentage |
|---|---|---|---|
| A | 12885 | 100 | 0.776096% |
| B | 12885 | 88 | 0.682965% |
| C | 12885 | 84 | 0.651921% |
| D | 12885 | 159 | 1.233993% |
Noise dominated data is calculated using 1-second bins in cleaned event files. If a bin has >2000 counts, and if more than 50% of those come from <1% of pixels, then it is considered to be noise-dominated and hence unusable.
| Quadrant | # 1 sec bins | Bins with >0 counts | Bins with >2000 counts | High rate bins dominated by noise | Noise dominated (total time) | Noise dominated (detector-on time) | Marked lightcurve |
|---|---|---|---|---|---|---|---|
| A | 13900 | 12886 | 40 | 40 | 0.29% | 0.31% | 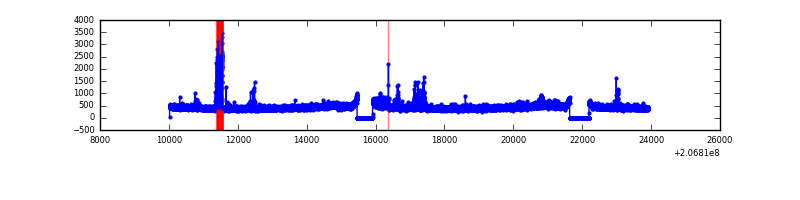 |
| B | 13900 | 12886 | 5 | 5 | 0.04% | 0.04% | 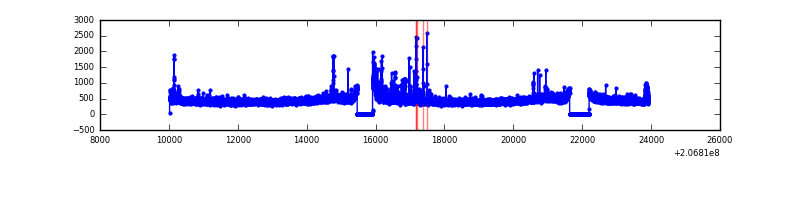 |
| C | 13900 | 12886 | 52 | 52 | 0.37% | 0.40% | 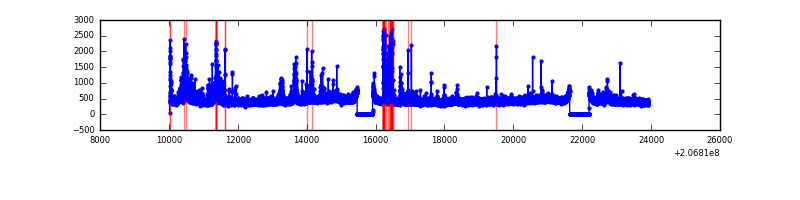 |
| D | 13900 | 12886 | 131 | 131 | 0.94% | 1.02% | 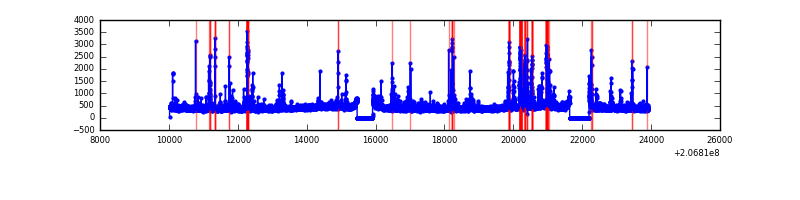 |
Top three noisy pixels from each quadrant. If the there are fewer than three noisy pixels in the level2.evt file, extra rows are filled as -1
| Pixel properties | Quadrant properties | ||||||
|---|---|---|---|---|---|---|---|
| Quadrant | DetID | PixID | Counts | Sigma | Mean | Median | Sigma |
| A | 0 | 50 | 279944 | 960.47 | 1413 | 1378 | 290.0 |
| A | 14 | 111 | 35461 | 117.51 | 1413 | 1378 | 290.0 |
| A | 12 | 194 | 14450 | 45.07 | 1413 | 1378 | 290.0 |
| B | 10 | 16 | 84122 | 303.38 | 1428 | 1396 | 272.7 |
| B | 15 | 54 | 73086 | 262.9 | 1428 | 1396 | 272.7 |
| B | 8 | 3 | 63755 | 228.69 | 1428 | 1396 | 272.7 |
| C | 9 | 247 | 481318 | 1509.11 | 1375 | 1384 | 318.0 |
| C | 9 | 16 | 181646 | 566.82 | 1375 | 1384 | 318.0 |
| C | 12 | 4 | 51858 | 158.71 | 1375 | 1384 | 318.0 |
| D | 12 | 22 | 204208 | 618.51 | 1365 | 1323 | 328.0 |
| D | 13 | 223 | 184381 | 558.07 | 1365 | 1323 | 328.0 |
| D | 2 | 136 | 110883 | 334.0 | 1365 | 1323 | 328.0 |
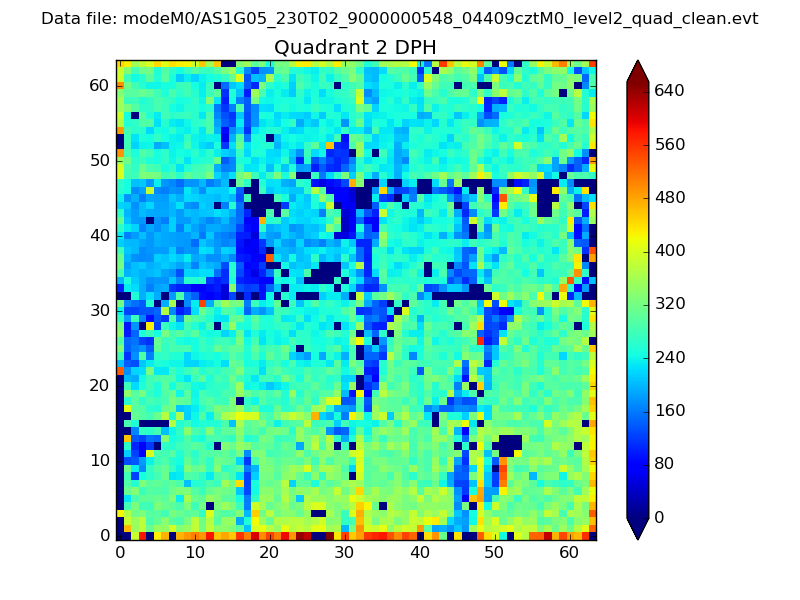
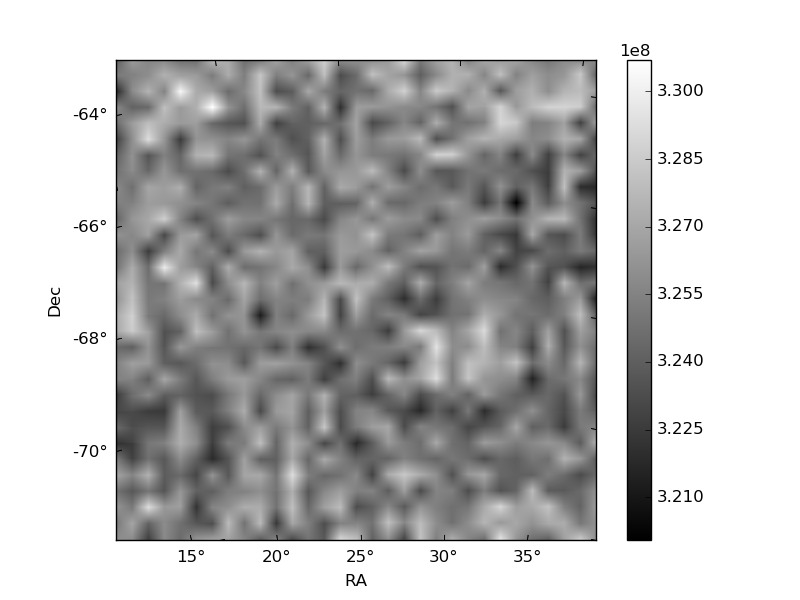
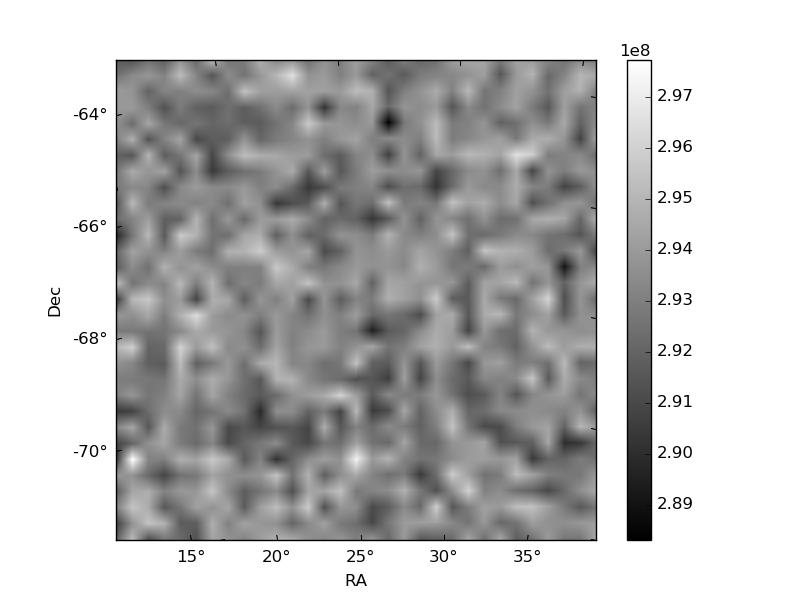
Histogram calculated using DETX and DETY for each event in the final _common_clean file
| Quadrant A | 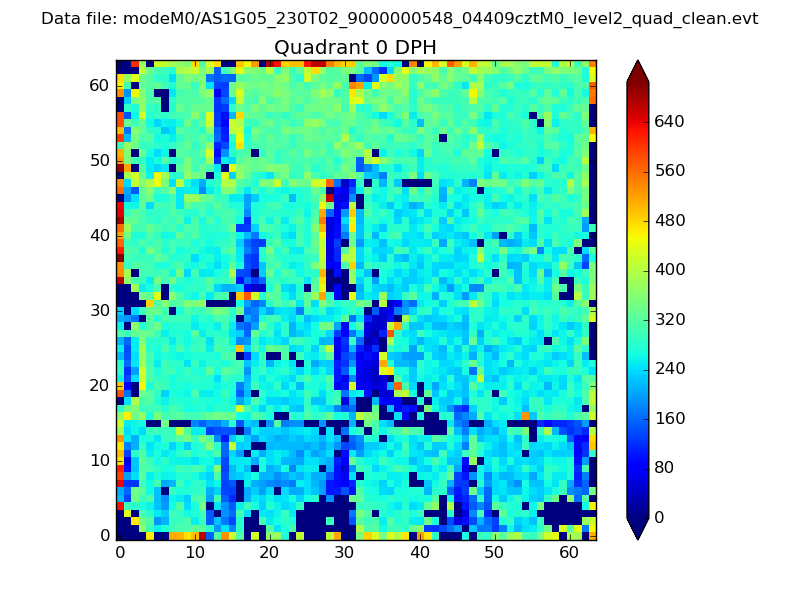 |
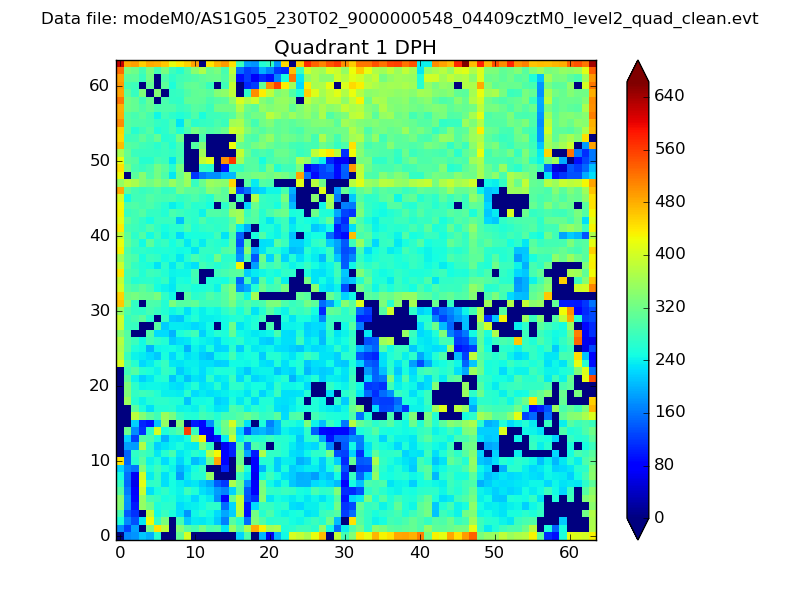 |
Quadrant B |
|---|---|---|---|
| Quadrant D | 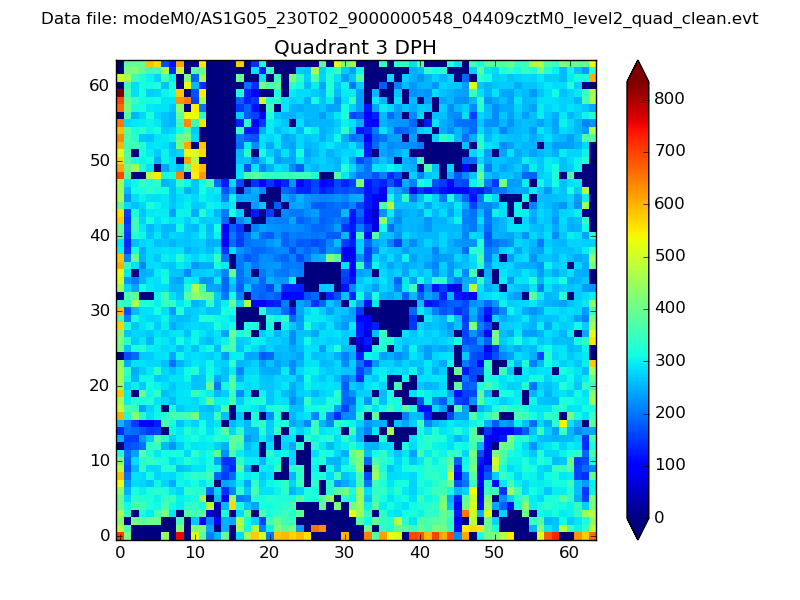 |
 |
Quadrant C |
| Plot type | Count rate plots | Images |
|---|---|---|
| Comparison with Poisson distribution Blue bars denote a histogram of data divided into 1 sec bins. Red curve is a Poisson curve with rate = median count rate of data. |
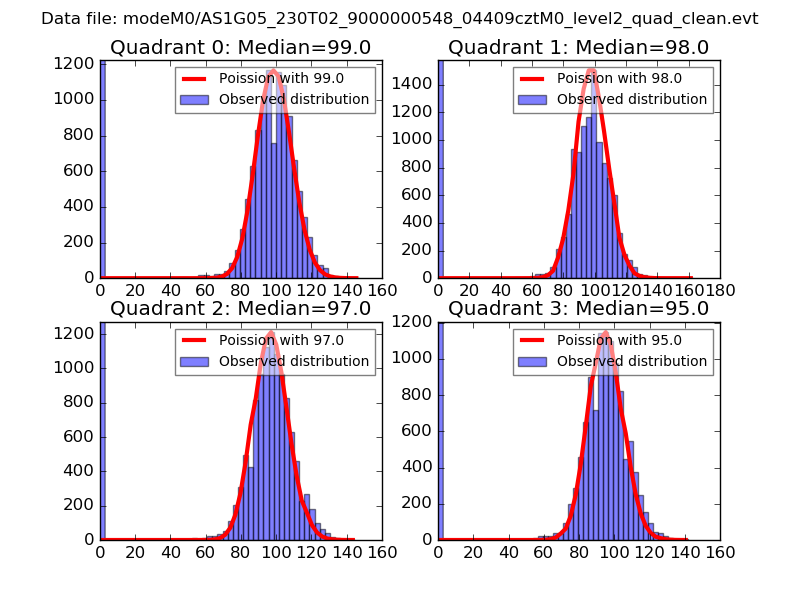 |
 |
| Quadrant-wise count rates Data is divided into 100 sec bins |
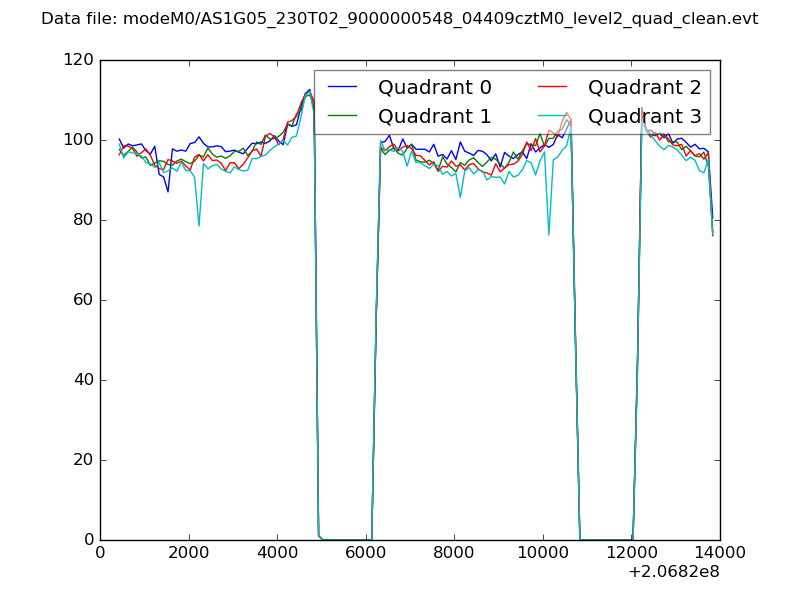 |
|
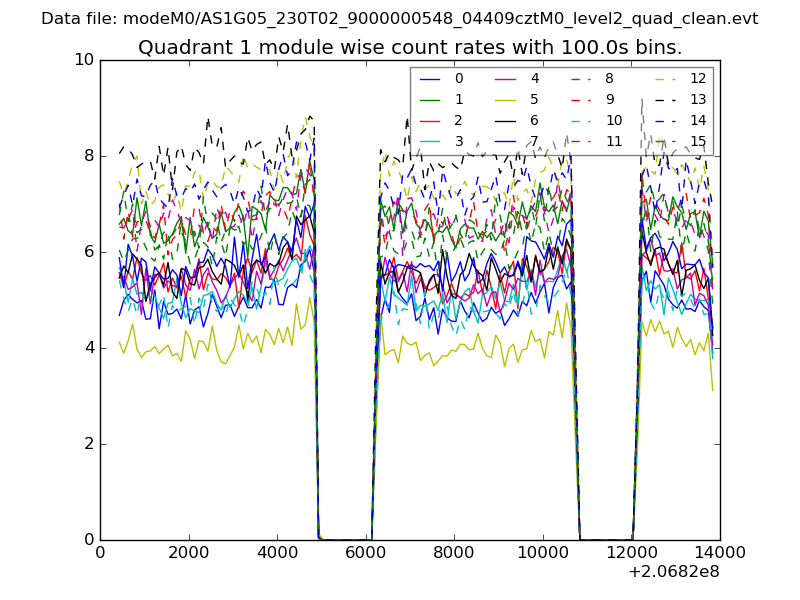
| Module-wise count rates for Quadrant A Data is divided into 100 sec bins |
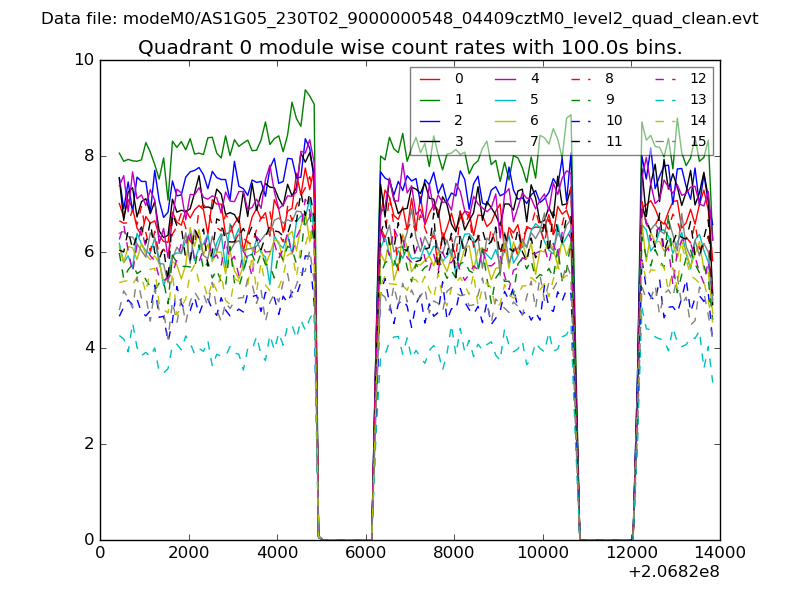 |
 |
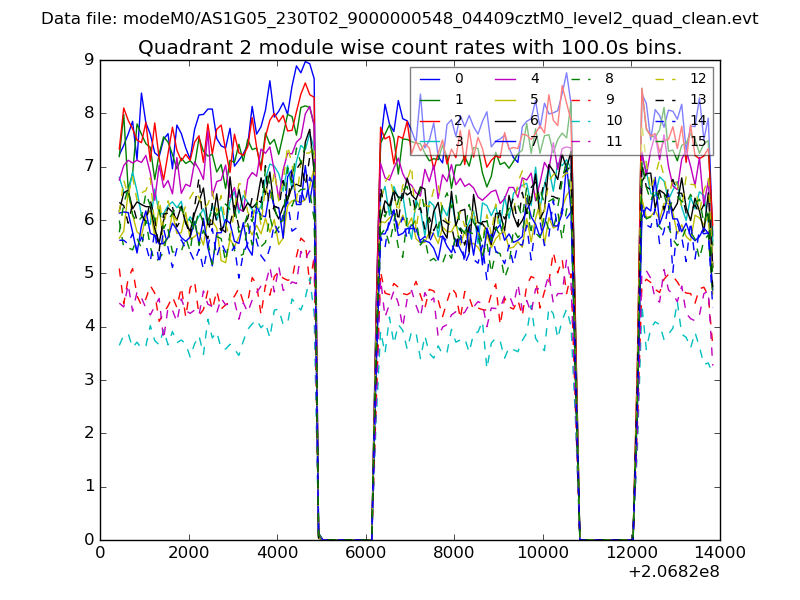
| Module-wise count rates for Quadrant B Data is divided into 100 sec bins |
 |
 |
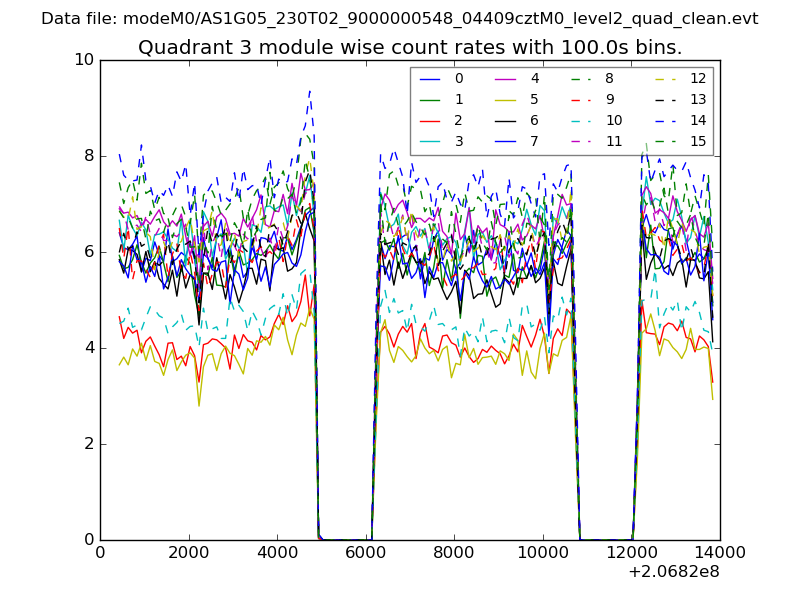
| Module-wise count rates for Quadrant C Data is divided into 100 sec bins |
 |
 |
| Module-wise count rates for Quadrant D Data is divided into 100 sec bins |
 |
 |
| Parameter | Plot |
|---|---|
| CZT HV Monitor | 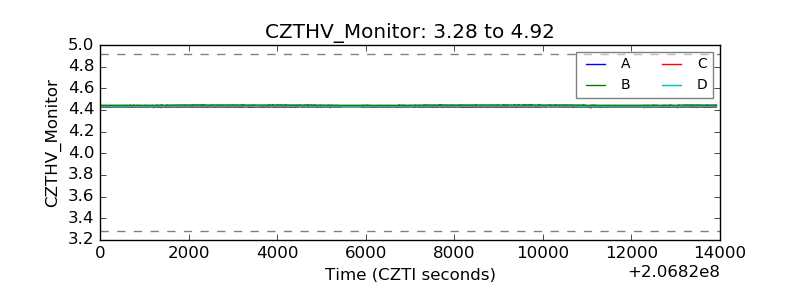 |
| D_VDD | 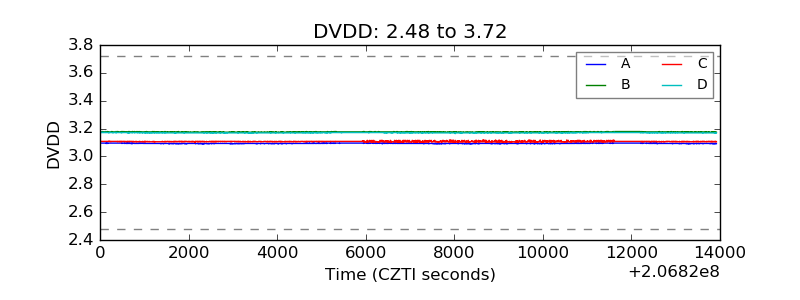 |
| Temperature 1 | 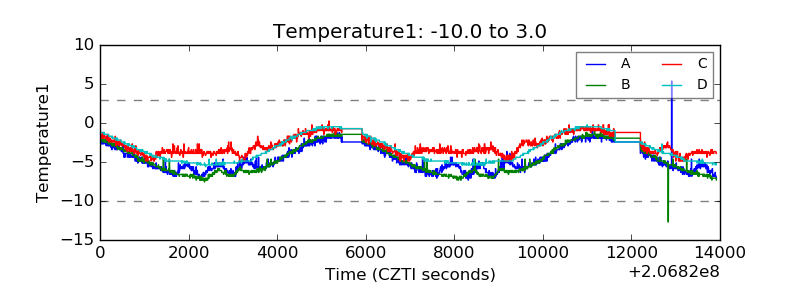 |
| Veto HV Monitor | 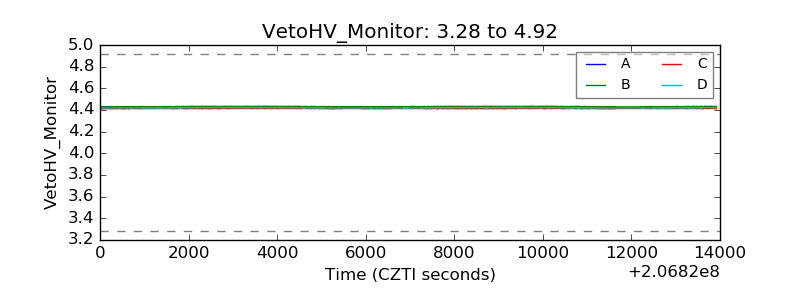 |
| Veto LLD | 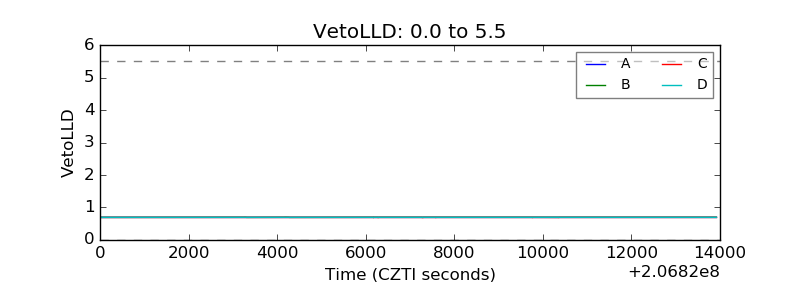 |
| Alpha Counter | 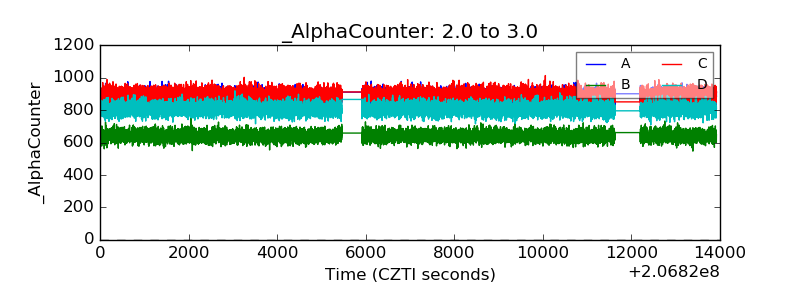 |
| _CPM_Rate | 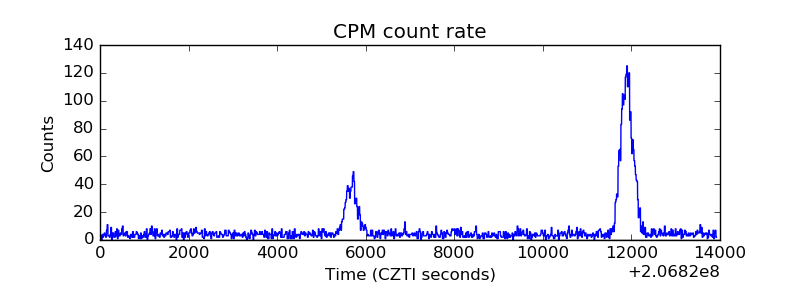 |
| CZT Counter | 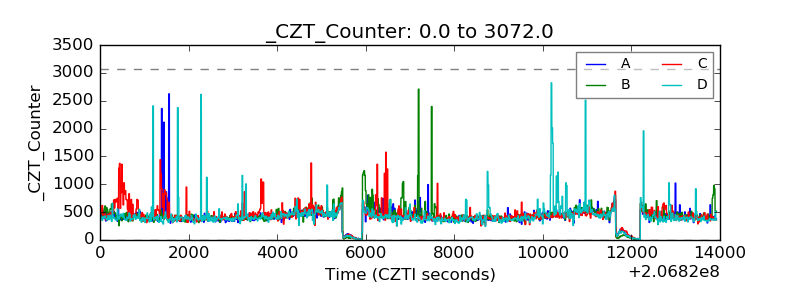 |
| +2.5 Volts monitor |  |
| +5 Volts monitor |  |
| _ROLL_ROT | 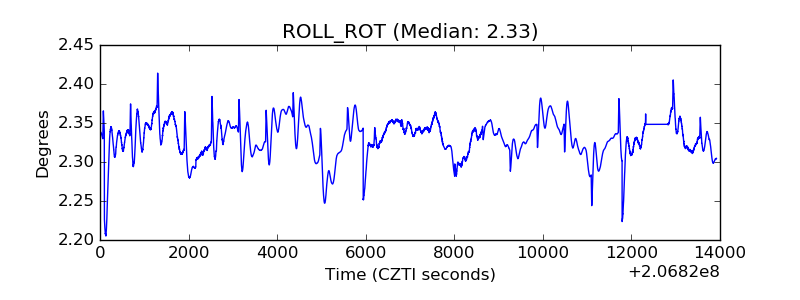 |
| _Roll_DEC | 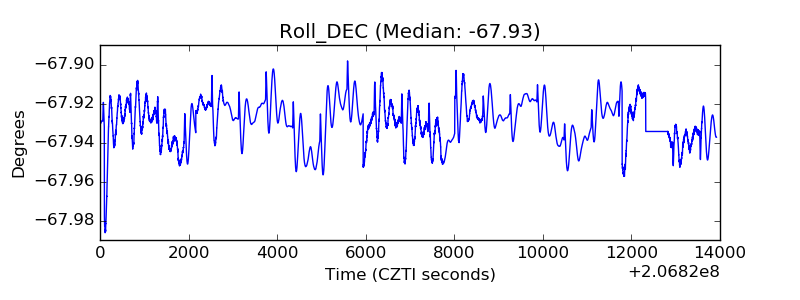 |
| _Roll_RA |  |
| Veto Counter | 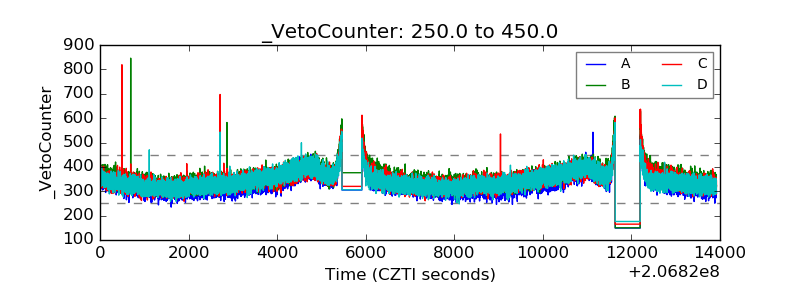 |