| Param | Original file | Final file |
|---|---|---|
| Filename | modeM0/AS1G05_230T04_9000000550cztM0_level2.fits | modeM0/AS1G05_230T04_9000000550cztM0_level2_quad_clean.evt |
| Size (bytes) | 975,951,360 | 1,212,687,360 |
| Size | 930.7 MB | 1.1 GB |
| Events in quadrant A | 5,871,330 | 7,844,953 |
| Events in quadrant B | 5,605,346 | 7,701,165 |
| Events in quadrant C | 5,872,688 | 7,706,902 |
| Events in quadrant D | 4,772,744 | 6,050,699 |
| Mode SS | |||
|---|---|---|---|
| Quadrant | BADHDUFLAG | Total packets | Discarded packets |
| A | 0 | 2200 | 0 |
| B | 0 | 2200 | 0 |
| C | 0 | 2200 | 0 |
| D | 0 | 2200 | 0 |
| Mode M9 | |||
|---|---|---|---|
| Quadrant | BADHDUFLAG | Total packets | Discarded packets |
| A | 0 | 186 | 0 |
| B | 0 | 186 | 0 |
| C | 0 | 186 | 0 |
| D | 0 | 186 | 0 |
| Mode M0 | |||
|---|---|---|---|
| Quadrant | BADHDUFLAG | Total packets | Discarded packets |
| A | 0 | 239644 | 0 |
| B | 0 | 262764 | 0 |
| C | 0 | 229533 | 0 |
| D | 0 | 392909 | 0 |
| Quadrant | Total seconds | Saturated seconds | Saturation percentage |
|---|---|---|---|
| A | 108370 | 2563 | 2.365046% |
| B | 108371 | 4353 | 4.016757% |
| C | 108371 | 960 | 0.885846% |
| D | 108371 | 15269 | 14.089563% |
Noise dominated data is calculated using 1-second bins in cleaned event files. If a bin has >2000 counts, and if more than 50% of those come from <1% of pixels, then it is considered to be noise-dominated and hence unusable.
| Quadrant | # 1 sec bins | Bins with >0 counts | Bins with >2000 counts | High rate bins dominated by noise | Noise dominated (total time) | Noise dominated (detector-on time) | Marked lightcurve |
|---|---|---|---|---|---|---|---|
| A | 126552 | 108356 | 0 | 0 | 0.00% | 0.00% |  |
| B | 126552 | 108341 | 0 | 0 | 0.00% | 0.00% |  |
| C | 126552 | 108371 | 0 | 0 | 0.00% | 0.00% |  |
| D | 126552 | 108367 | 0 | 0 | 0.00% | 0.00% |  |
Top three noisy pixels from each quadrant. If the there are fewer than three noisy pixels in the level2.evt file, extra rows are filled as -1
| Pixel properties | Quadrant properties | ||||||
|---|---|---|---|---|---|---|---|
| Quadrant | DetID | PixID | Counts | Sigma | Mean | Median | Sigma |
| A | 0 | 29 | 4947 | 8.94 | 1529 | 1430 | 393.6 |
| A | 7 | 110 | 4791 | 8.54 | 1529 | 1430 | 393.6 |
| A | 9 | 19 | 4506 | 7.82 | 1529 | 1430 | 393.6 |
| B | 2 | 9 | 4886 | 11.83 | 1481 | 1412 | 293.6 |
| B | 12 | 226 | 4065 | 9.04 | 1481 | 1412 | 293.6 |
| B | 14 | 254 | 3906 | 8.49 | 1481 | 1412 | 293.6 |
| C | 1 | 80 | 4318 | 7.02 | 1549 | 1438 | 410.4 |
| C | 1 | 81 | 4217 | 6.77 | 1549 | 1438 | 410.4 |
| C | 12 | 241 | 4129 | 6.56 | 1549 | 1438 | 410.4 |
| D | 11 | 82 | 4091 | 7.85 | 1362 | 1242 | 362.8 |
| D | 3 | 14 | 3651 | 6.64 | 1362 | 1242 | 362.8 |
| D | 6 | 231 | 3595 | 6.48 | 1362 | 1242 | 362.8 |
Histogram calculated using DETX and DETY for each event in the final _common_clean file
| Quadrant A | 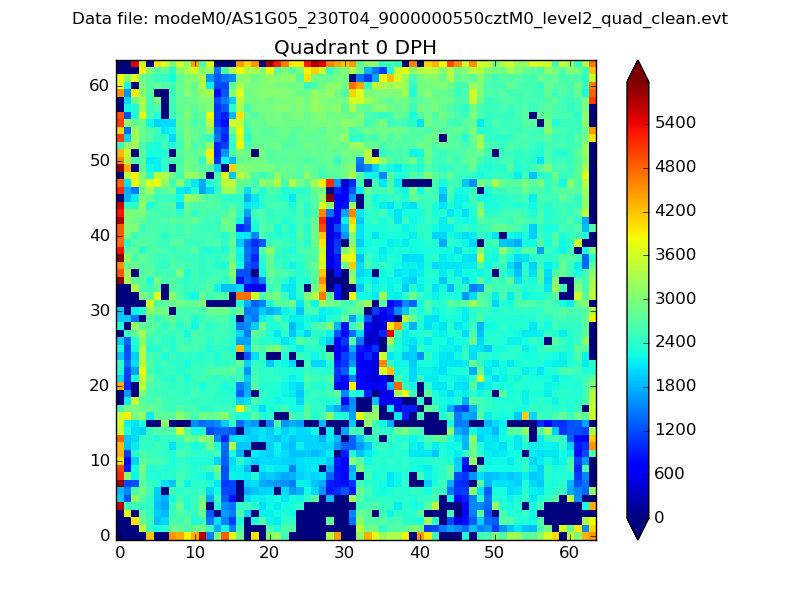 |
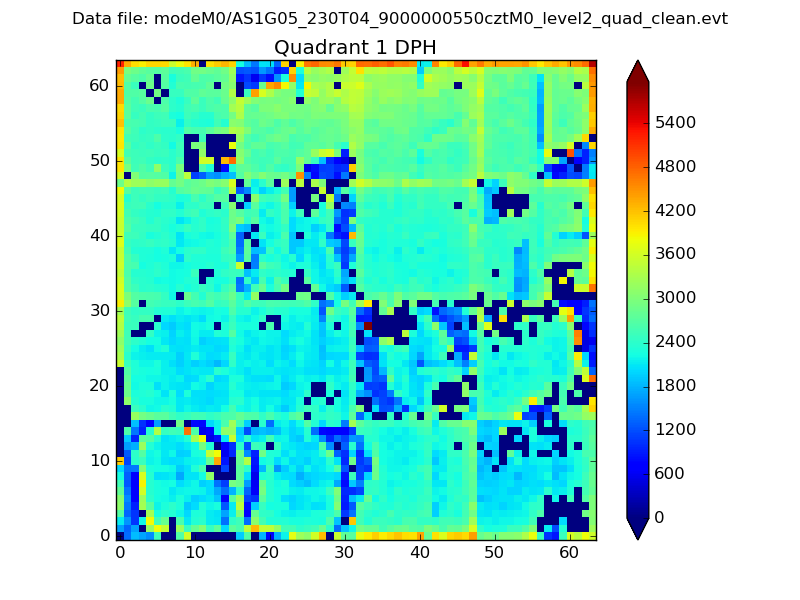 |
Quadrant B |
|---|---|---|---|
| Quadrant D |  |
 |
Quadrant C |
| Plot type | Count rate plots | Images |
|---|---|---|
| Comparison with Poisson distribution Blue bars denote a histogram of data divided into 1 sec bins. Red curve is a Poisson curve with rate = median count rate of data. |
 |
 |
| Quadrant-wise count rates Data is divided into 100 sec bins |
 |
|
| Module-wise count rates for Quadrant A Data is divided into 100 sec bins |
 |
 |
| Module-wise count rates for Quadrant B Data is divided into 100 sec bins |
 |
 |
| Module-wise count rates for Quadrant C Data is divided into 100 sec bins |
 |
 |
| Module-wise count rates for Quadrant D Data is divided into 100 sec bins |
 |
 |
| Parameter | Plot |
|---|---|
| CZT HV Monitor |  |
| D_VDD | 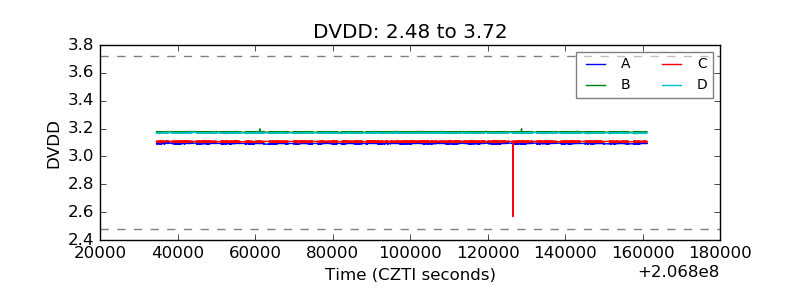 |
| Temperature 1 |  |
| Veto HV Monitor |  |
| Veto LLD |  |
| Alpha Counter |  |
| _CPM_Rate |  |
| CZT Counter |  |
| +2.5 Volts monitor |  |
| +5 Volts monitor |  |
| _ROLL_ROT |  |
| _Roll_DEC |  |
| _Roll_RA |  |
| Veto Counter |  |