| Param | Original file | Final file |
|---|---|---|
| Filename | modeM0/AS1G05_230T04_9000000550_04409cztM0_level2.evt | modeM0/AS1G05_230T04_9000000550_04409cztM0_level2_quad_clean.evt |
| Size (bytes) | 533,819,520 | 110,260,800 |
| Size | 509.1 MB | 105.2 MB |
| Events in quadrant A | 4,067,754 | 688,105 |
| Events in quadrant B | 3,857,878 | 690,343 |
| Events in quadrant C | 3,740,491 | 694,060 |
| Events in quadrant D | 3,918,347 | 671,391 |
| Mode SS | |||
|---|---|---|---|
| Quadrant | BADHDUFLAG | Total packets | Discarded packets |
| A | 0 | 174 | 0 |
| B | 0 | 174 | 0 |
| C | 0 | 174 | 0 |
| D | 0 | 174 | 0 |
| Mode M9 | |||
|---|---|---|---|
| Quadrant | BADHDUFLAG | Total packets | Discarded packets |
| A | 0 | 12 | 0 |
| B | 0 | 11 | 0 |
| C | 0 | 11 | 0 |
| D | 0 | 11 | 0 |
| Mode M0 | |||
|---|---|---|---|
| Quadrant | BADHDUFLAG | Total packets | Discarded packets |
| A | 0 | 18342 | 0 |
| B | 0 | 17542 | 0 |
| C | 0 | 17476 | 0 |
| D | 0 | 18328 | 0 |
| Quadrant | Total seconds | Saturated seconds | Saturation percentage |
|---|---|---|---|
| A | 8576 | 155 | 1.807369% |
| B | 8577 | 35 | 0.408068% |
| C | 8577 | 32 | 0.373091% |
| D | 8577 | 77 | 0.897750% |
Noise dominated data is calculated using 1-second bins in cleaned event files. If a bin has >2000 counts, and if more than 50% of those come from <1% of pixels, then it is considered to be noise-dominated and hence unusable.
| Quadrant | # 1 sec bins | Bins with >0 counts | Bins with >2000 counts | High rate bins dominated by noise | Noise dominated (total time) | Noise dominated (detector-on time) | Marked lightcurve |
|---|---|---|---|---|---|---|---|
| A | 9317 | 8578 | 68 | 68 | 0.73% | 0.79% | 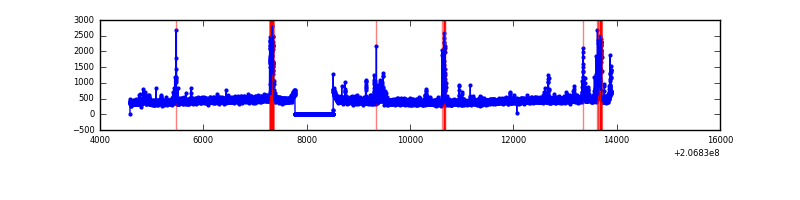 |
| B | 9317 | 8578 | 2 | 2 | 0.02% | 0.02% | 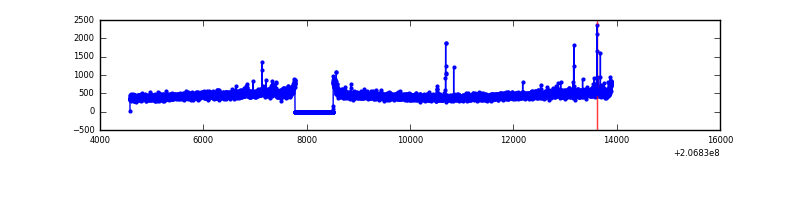 |
| C | 9317 | 8578 | 1 | 1 | 0.01% | 0.01% | 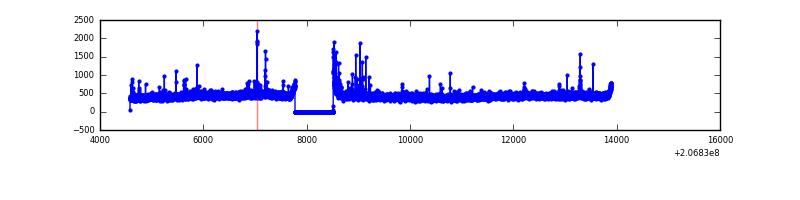 |
| D | 9317 | 8578 | 46 | 46 | 0.49% | 0.54% |  |
Top three noisy pixels from each quadrant. If the there are fewer than three noisy pixels in the level2.evt file, extra rows are filled as -1
| Pixel properties | Quadrant properties | ||||||
|---|---|---|---|---|---|---|---|
| Quadrant | DetID | PixID | Counts | Sigma | Mean | Median | Sigma |
| A | 0 | 50 | 190234 | 980.41 | 945 | 924 | 193.1 |
| A | 13 | 251 | 158764 | 817.43 | 945 | 924 | 193.1 |
| A | 14 | 111 | 71733 | 366.71 | 945 | 924 | 193.1 |
| B | 8 | 3 | 46506 | 249.84 | 957 | 935 | 182.4 |
| B | 15 | 204 | 36599 | 195.53 | 957 | 935 | 182.4 |
| B | 14 | 167 | 27415 | 145.18 | 957 | 935 | 182.4 |
| C | 9 | 16 | 56954 | 260.52 | 926 | 926 | 215.1 |
| C | 9 | 247 | 36599 | 165.87 | 926 | 926 | 215.1 |
| C | 12 | 4 | 19263 | 85.26 | 926 | 926 | 215.1 |
| D | 13 | 239 | 131786 | 585.54 | 924 | 896 | 223.5 |
| D | 12 | 227 | 62316 | 274.76 | 924 | 896 | 223.5 |
| D | 13 | 25 | 43546 | 190.8 | 924 | 896 | 223.5 |
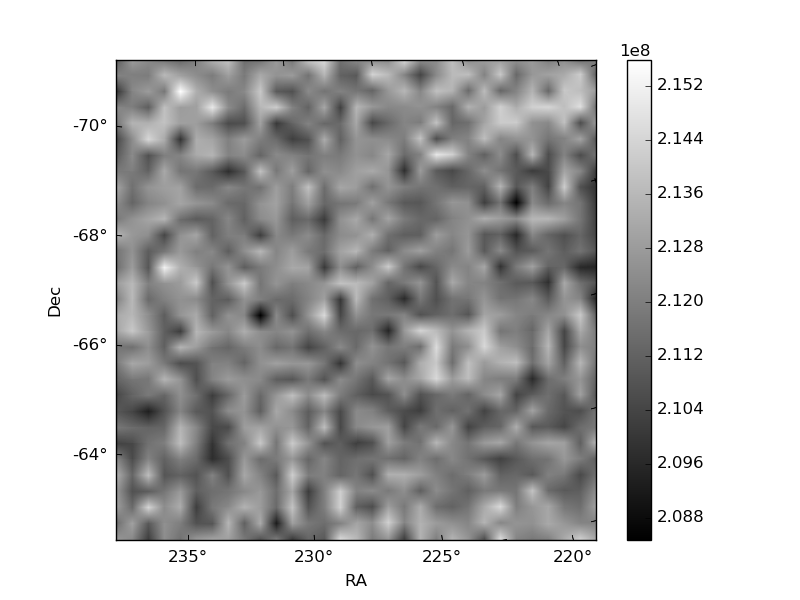
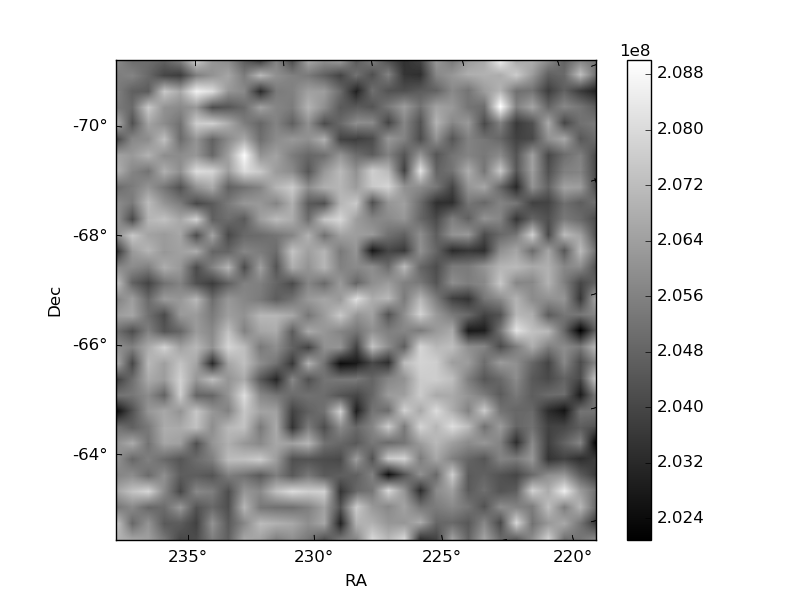
Histogram calculated using DETX and DETY for each event in the final _common_clean file
| Quadrant A | 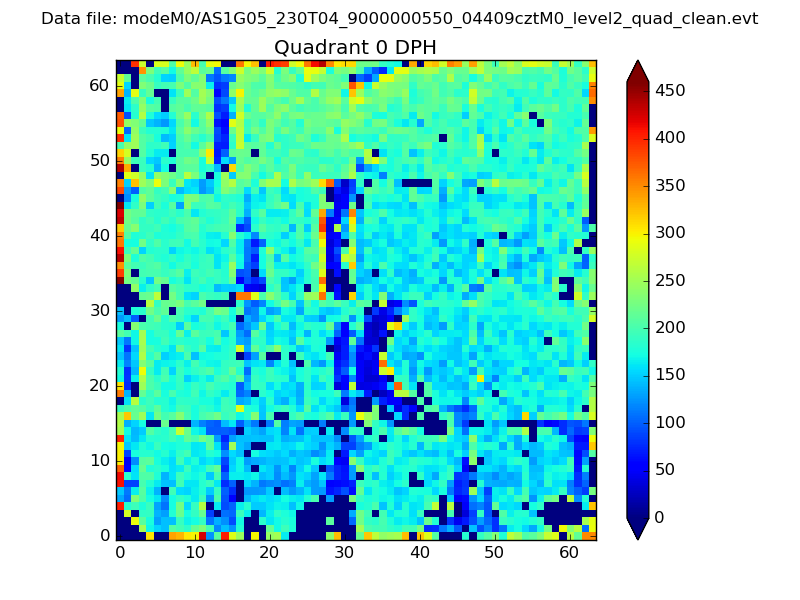 |
 |
Quadrant B |
|---|---|---|---|
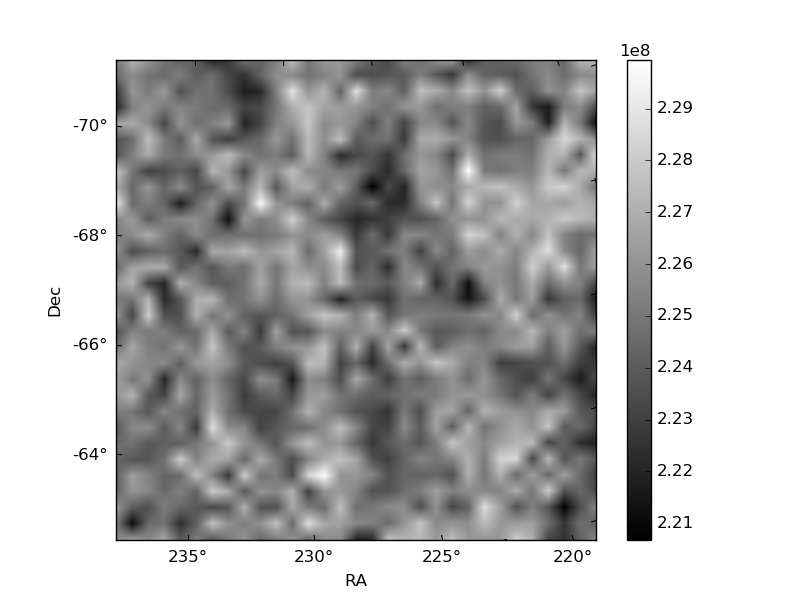
| Quadrant D |  |
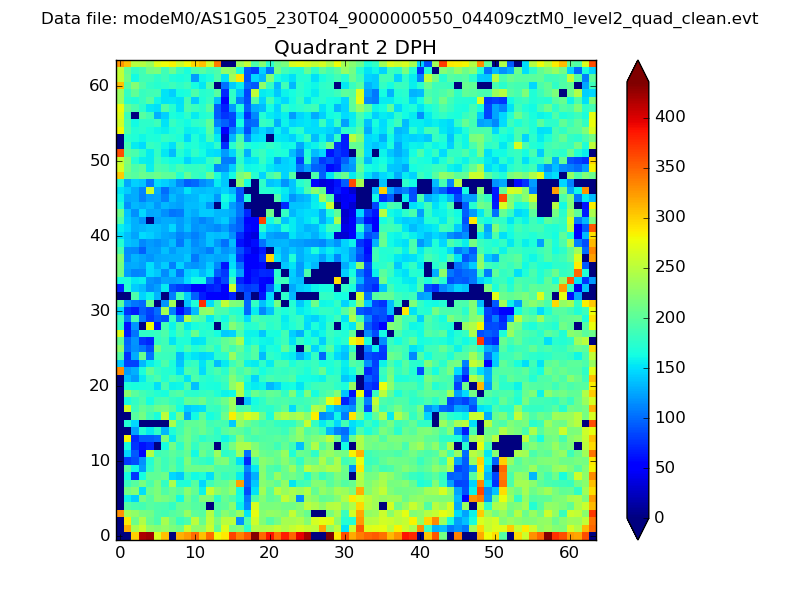 |
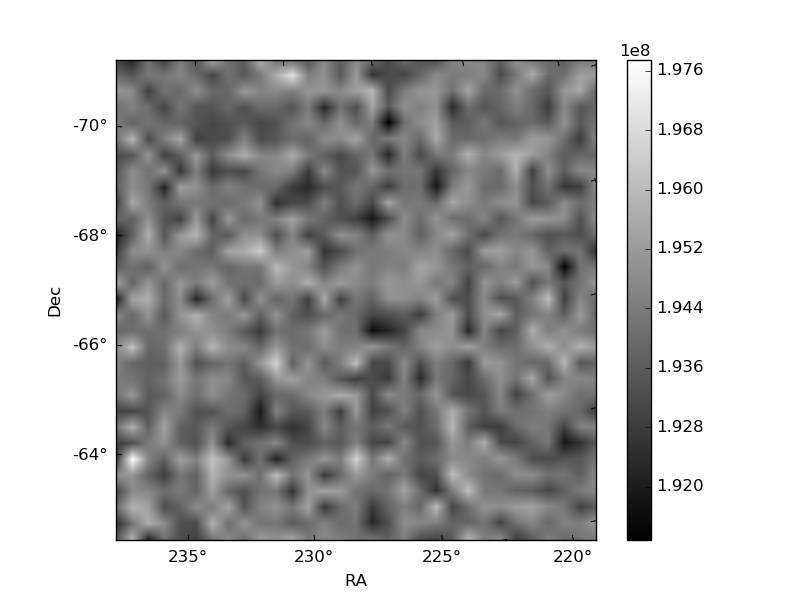
Quadrant C |
| Plot type | Count rate plots | Images |
|---|---|---|
| Comparison with Poisson distribution Blue bars denote a histogram of data divided into 1 sec bins. Red curve is a Poisson curve with rate = median count rate of data. |
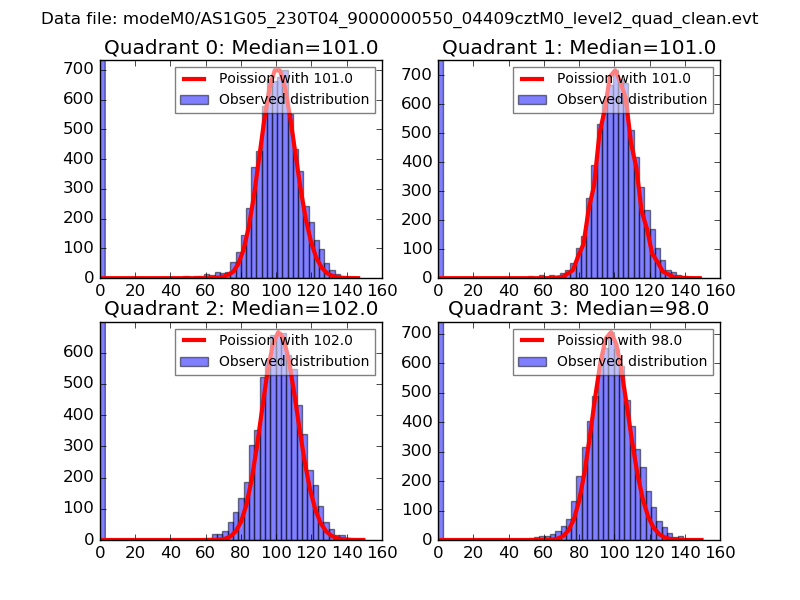 |
 |
| Quadrant-wise count rates Data is divided into 100 sec bins |
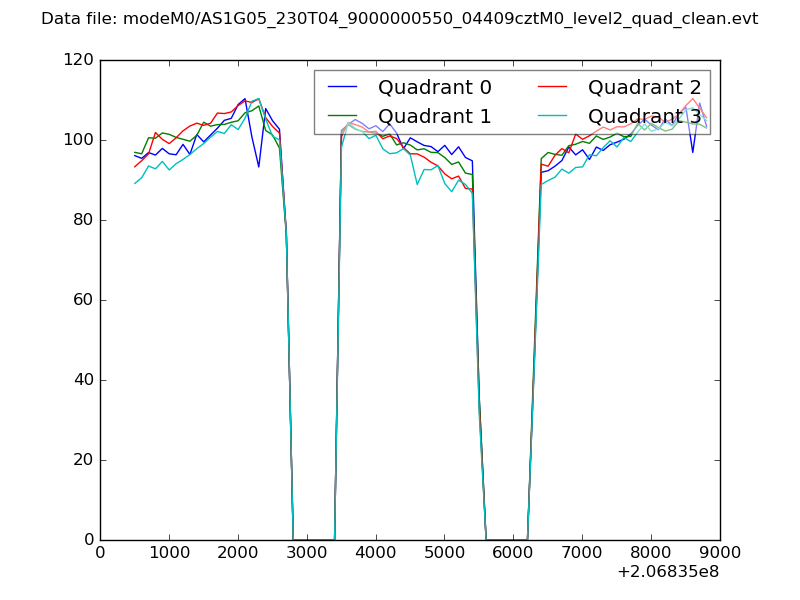 |
|
| Module-wise count rates for Quadrant A Data is divided into 100 sec bins |
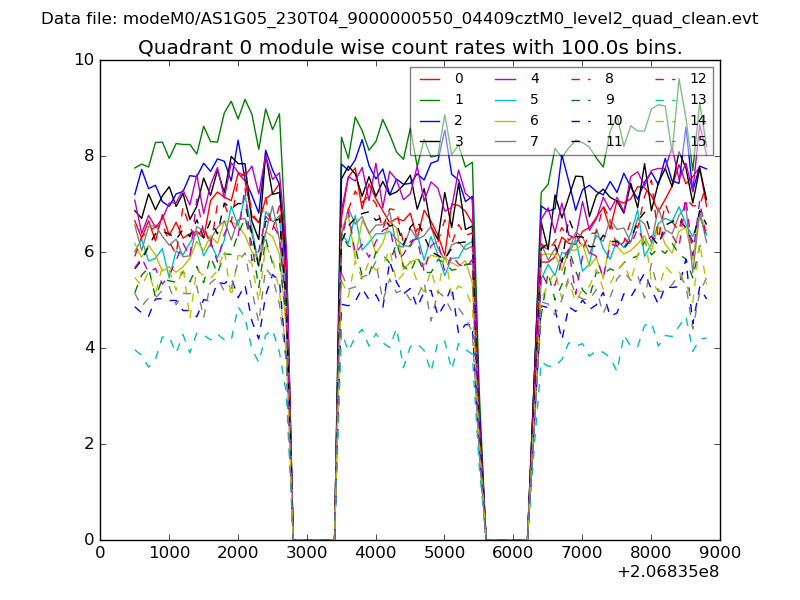 |
 |
| Module-wise count rates for Quadrant B Data is divided into 100 sec bins |
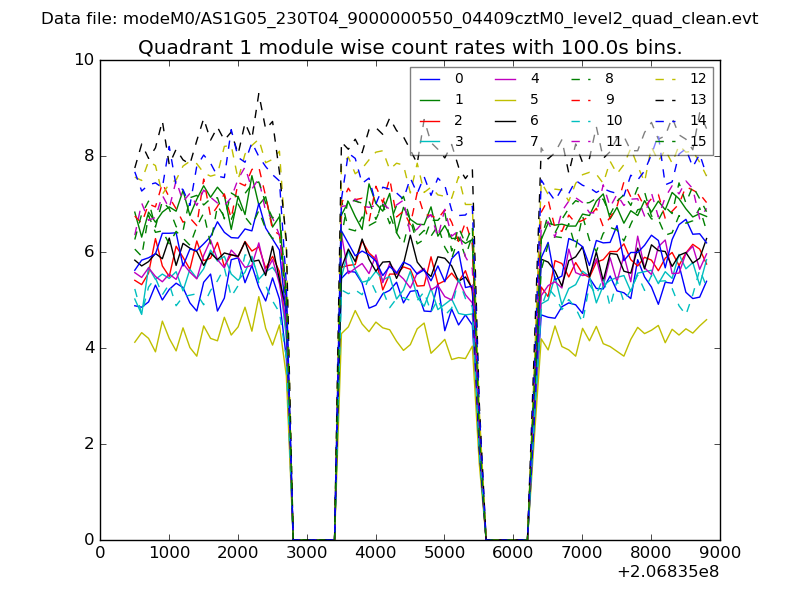 |
 |
| Module-wise count rates for Quadrant C Data is divided into 100 sec bins |
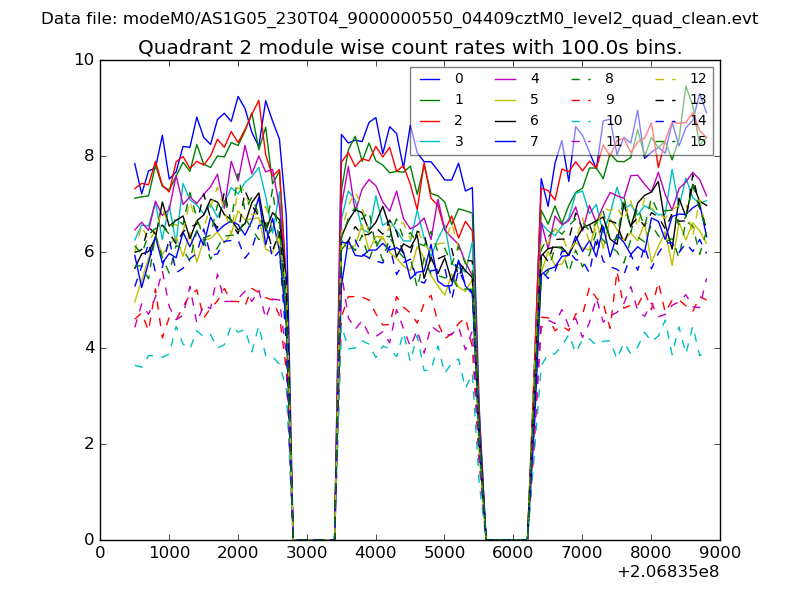 |
 |
| Module-wise count rates for Quadrant D Data is divided into 100 sec bins |
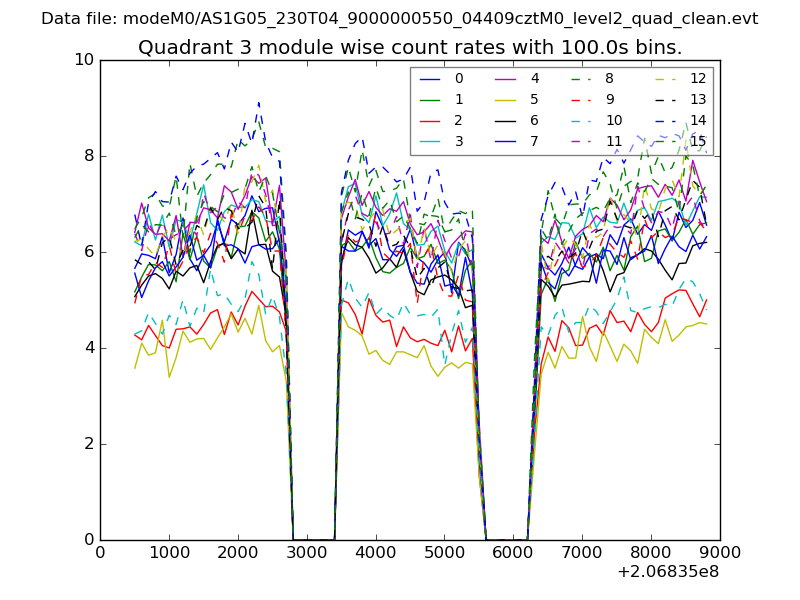 |
 |
| Parameter | Plot |
|---|---|
| CZT HV Monitor | 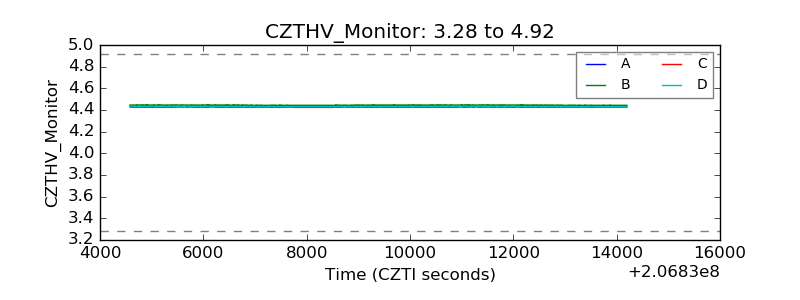 |
| D_VDD | 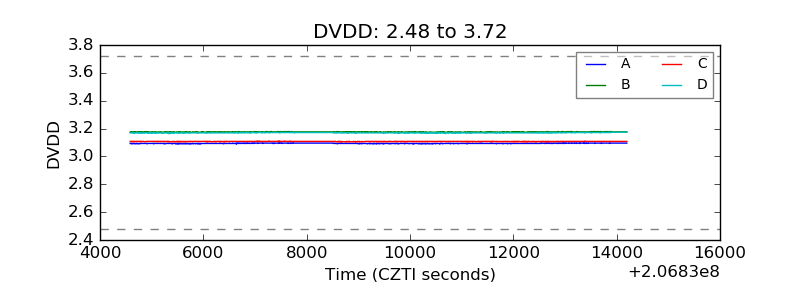 |
| Temperature 1 | 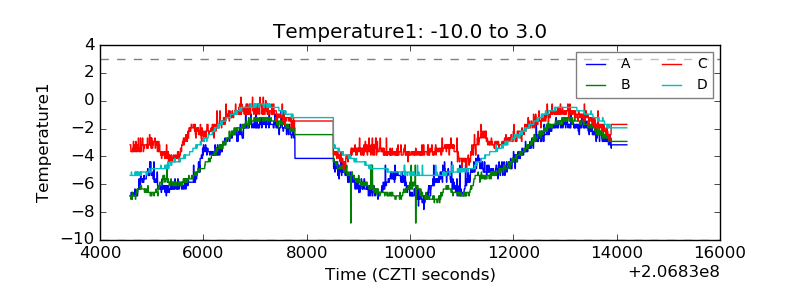 |
| Veto HV Monitor | 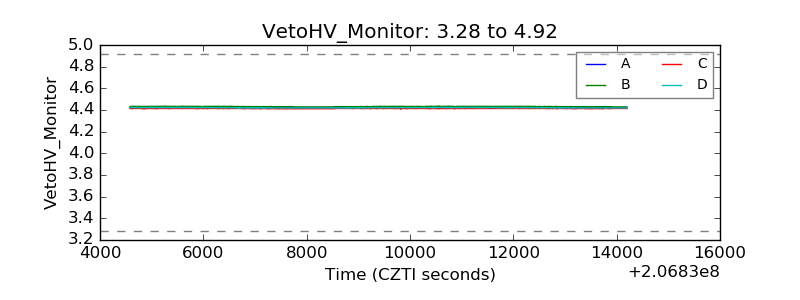 |
| Veto LLD | 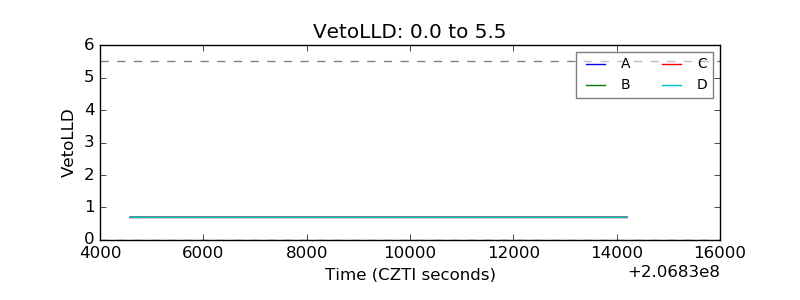 |
| Alpha Counter | 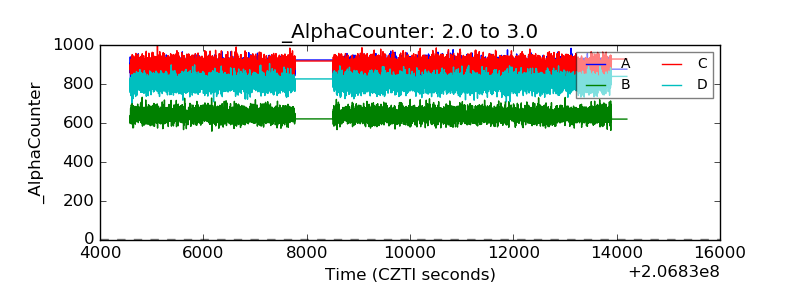 |
| _CPM_Rate | 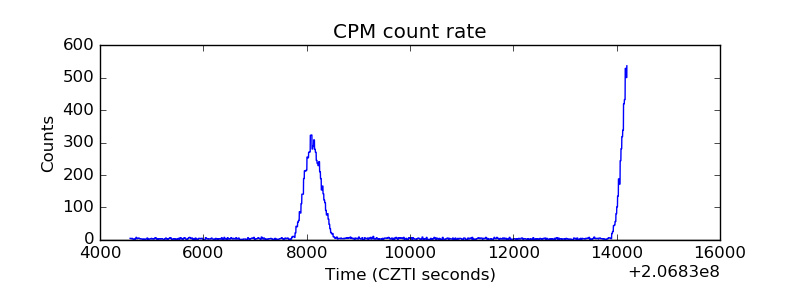 |
| CZT Counter | 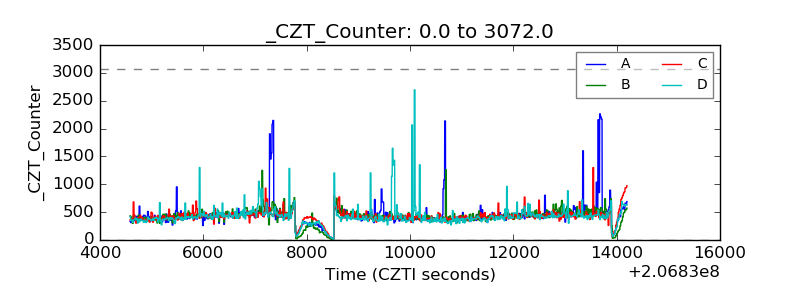 |
| +2.5 Volts monitor |  |
| +5 Volts monitor |  |
| _ROLL_ROT | 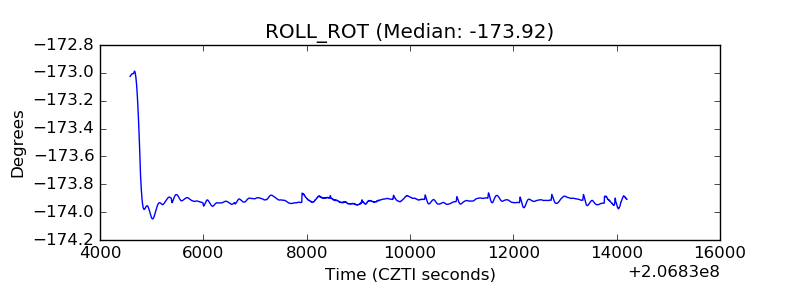 |
| _Roll_DEC | 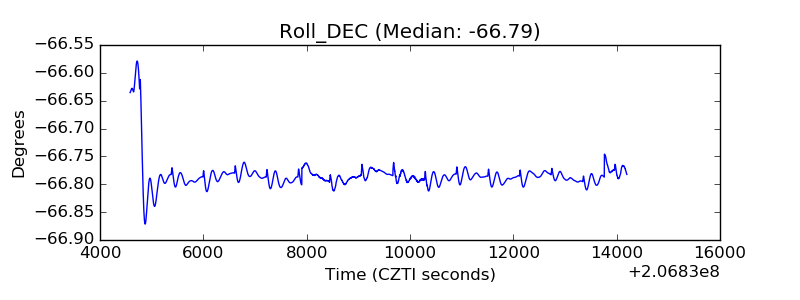 |
| _Roll_RA | 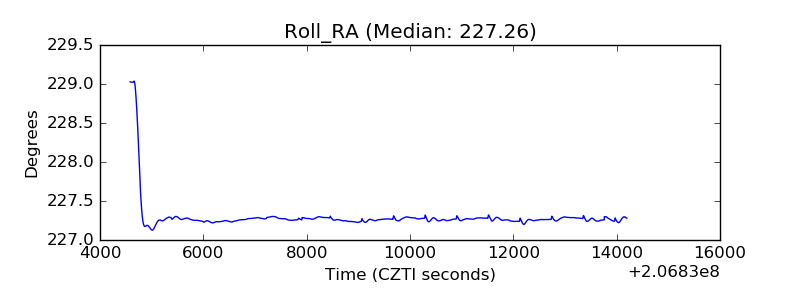 |
| Veto Counter | 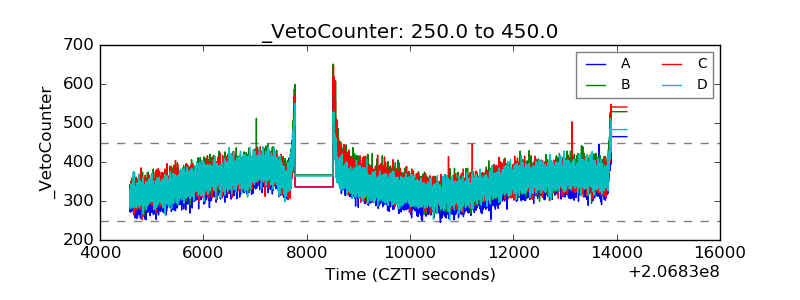 |