| Param | Original file | Final file |
|---|---|---|
| Filename | modeM0/AS1G05_230T04_9000000550_04410cztM0_level2.evt | modeM0/AS1G05_230T04_9000000550_04410cztM0_level2_quad_clean.evt |
| Size (bytes) | 417,873,600 | 91,949,760 |
| Size | 398.5 MB | 87.7 MB |
| Events in quadrant A | 2,988,970 | 586,051 |
| Events in quadrant B | 3,037,215 | 583,408 |
| Events in quadrant C | 3,181,758 | 581,736 |
| Events in quadrant D | 2,991,027 | 565,896 |
| Mode SS | |||
|---|---|---|---|
| Quadrant | BADHDUFLAG | Total packets | Discarded packets |
| A | 0 | 136 | 0 |
| B | 0 | 136 | 0 |
| C | 0 | 136 | 0 |
| D | 0 | 136 | 0 |
| Mode M9 | |||
|---|---|---|---|
| Quadrant | BADHDUFLAG | Total packets | Discarded packets |
| A | 0 | 19 | 0 |
| B | 0 | 19 | 0 |
| C | 0 | 19 | 0 |
| D | 0 | 20 | 0 |
| Mode M0 | |||
|---|---|---|---|
| Quadrant | BADHDUFLAG | Total packets | Discarded packets |
| A | 0 | 13755 | 3 |
| B | 0 | 13717 | 2 |
| C | 0 | 14234 | 2 |
| D | 0 | 13967 | 2 |
| Quadrant | Total seconds | Saturated seconds | Saturation percentage |
|---|---|---|---|
| A | 6706 | 33 | 0.492097% |
| B | 6706 | 28 | 0.417537% |
| C | 6706 | 31 | 0.462273% |
| D | 6706 | 31 | 0.462273% |
Noise dominated data is calculated using 1-second bins in cleaned event files. If a bin has >2000 counts, and if more than 50% of those come from <1% of pixels, then it is considered to be noise-dominated and hence unusable.
| Quadrant | # 1 sec bins | Bins with >0 counts | Bins with >2000 counts | High rate bins dominated by noise | Noise dominated (total time) | Noise dominated (detector-on time) | Marked lightcurve |
|---|---|---|---|---|---|---|---|
| A | 7766 | 6707 | 13 | 13 | 0.17% | 0.19% | 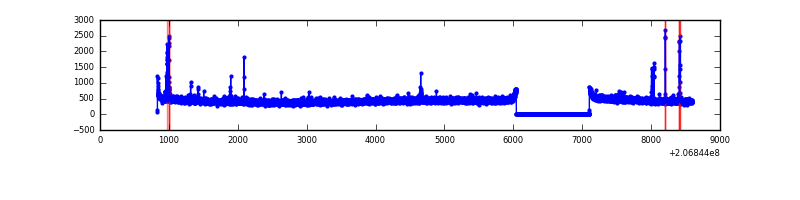 |
| B | 7766 | 6707 | 2 | 2 | 0.03% | 0.03% | 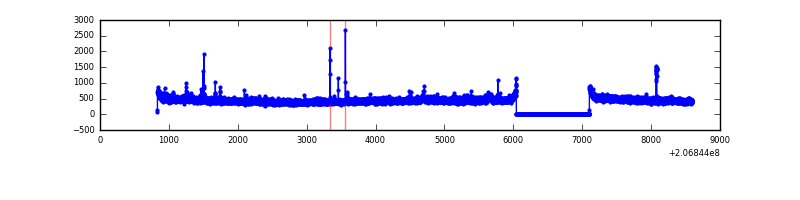 |
| C | 7766 | 6707 | 21 | 21 | 0.27% | 0.31% | 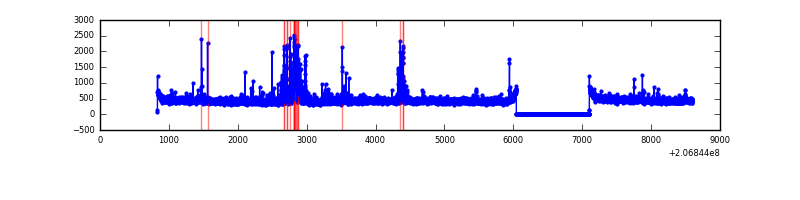 |
| D | 7766 | 6707 | 15 | 15 | 0.19% | 0.22% | 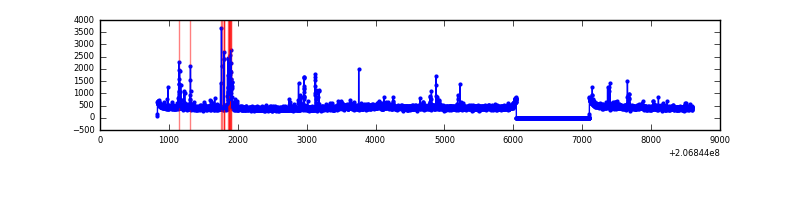 |
Top three noisy pixels from each quadrant. If the there are fewer than three noisy pixels in the level2.evt file, extra rows are filled as -1
| Pixel properties | Quadrant properties | ||||||
|---|---|---|---|---|---|---|---|
| Quadrant | DetID | PixID | Counts | Sigma | Mean | Median | Sigma |
| A | 13 | 251 | 35213 | 225.94 | 750 | 731 | 152.6 |
| A | 0 | 50 | 34608 | 221.97 | 750 | 731 | 152.6 |
| A | 8 | 15 | 17708 | 111.24 | 750 | 731 | 152.6 |
| B | 14 | 167 | 26386 | 175.86 | 760 | 740 | 145.8 |
| B | 12 | 18 | 16343 | 107.0 | 760 | 740 | 145.8 |
| B | 10 | 16 | 13200 | 85.44 | 760 | 740 | 145.8 |
| C | 9 | 16 | 272370 | 1592.39 | 735 | 738 | 170.6 |
| C | 9 | 247 | 20866 | 118.0 | 735 | 738 | 170.6 |
| C | 12 | 4 | 14679 | 81.73 | 735 | 738 | 170.6 |
| D | 13 | 239 | 119543 | 683.05 | 726 | 705 | 174.0 |
| D | 2 | 136 | 36105 | 203.47 | 726 | 705 | 174.0 |
| D | 8 | 112 | 22553 | 125.58 | 726 | 705 | 174.0 |
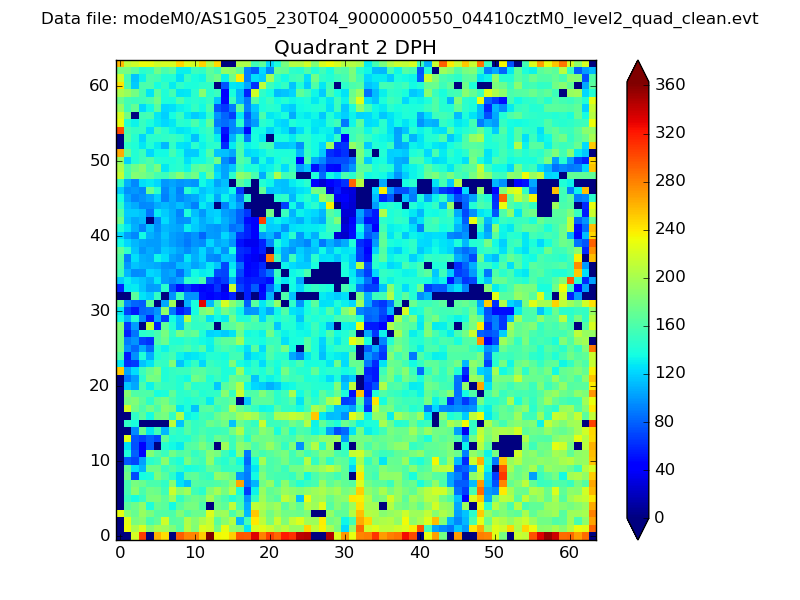
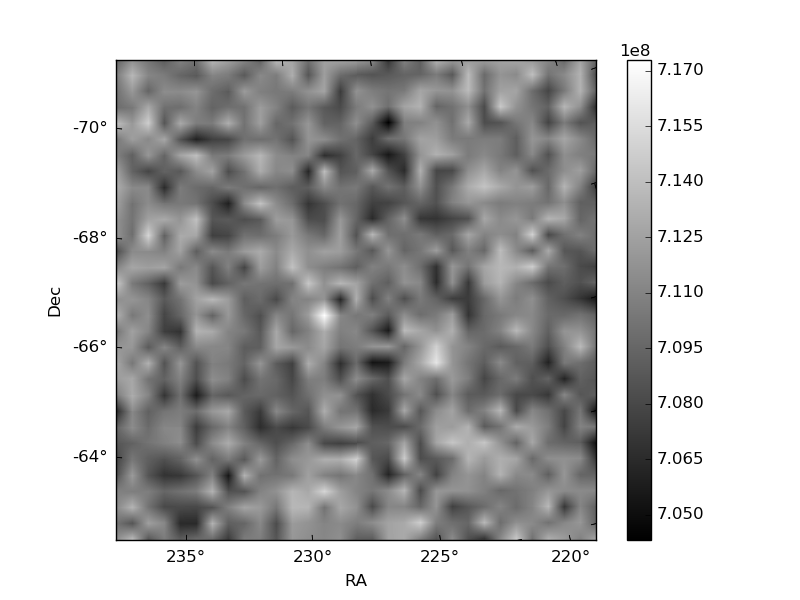
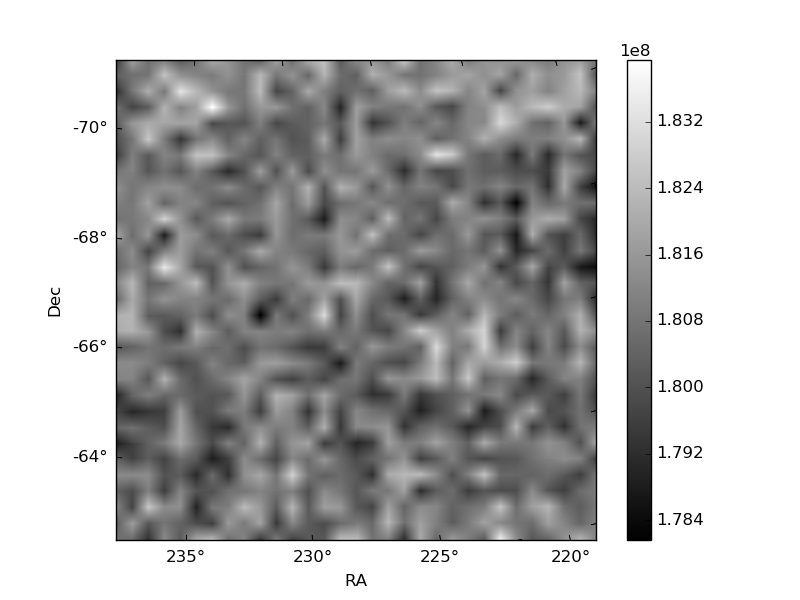
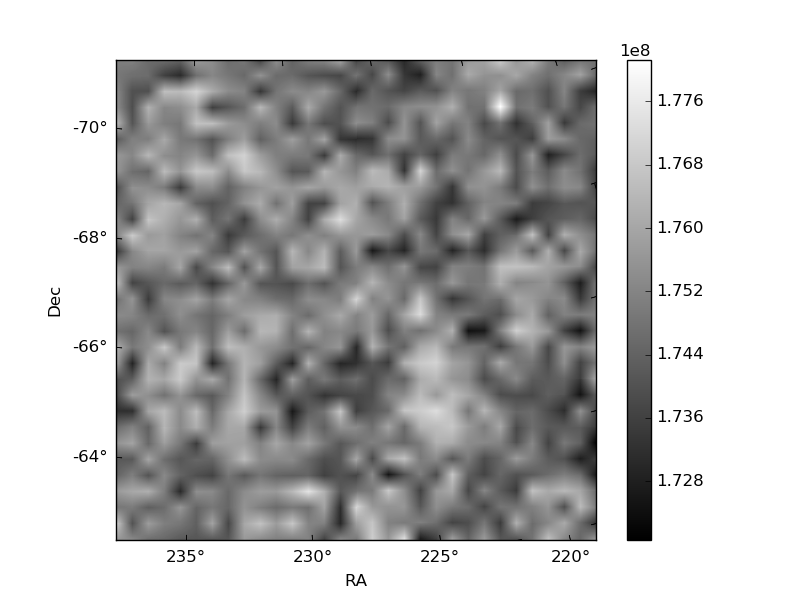
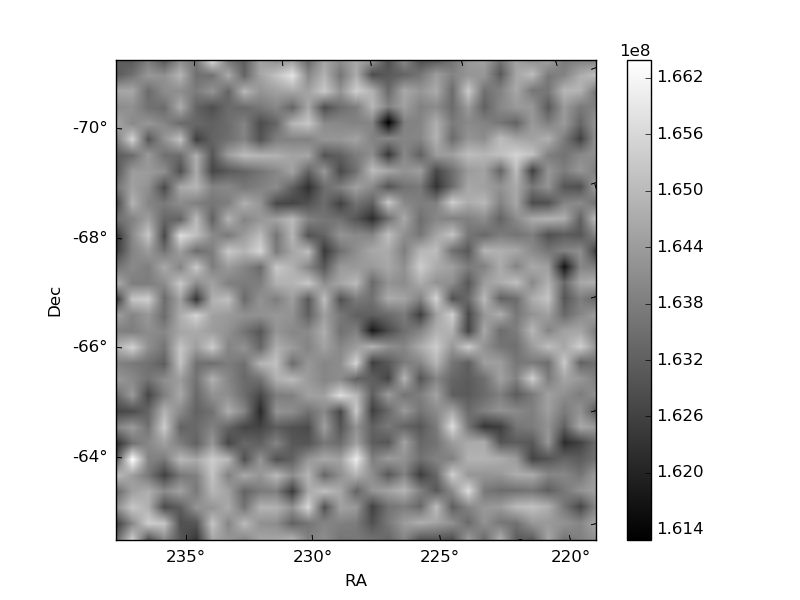
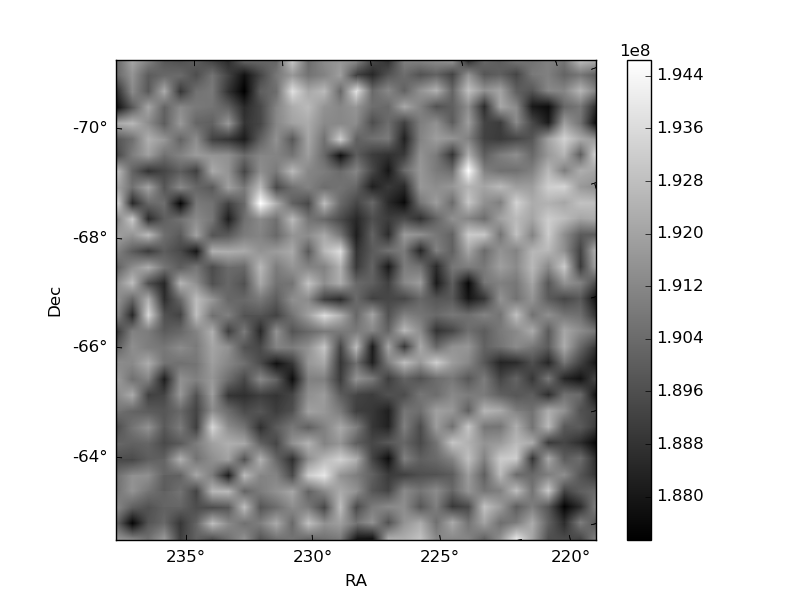
Histogram calculated using DETX and DETY for each event in the final _common_clean file
| Quadrant A | 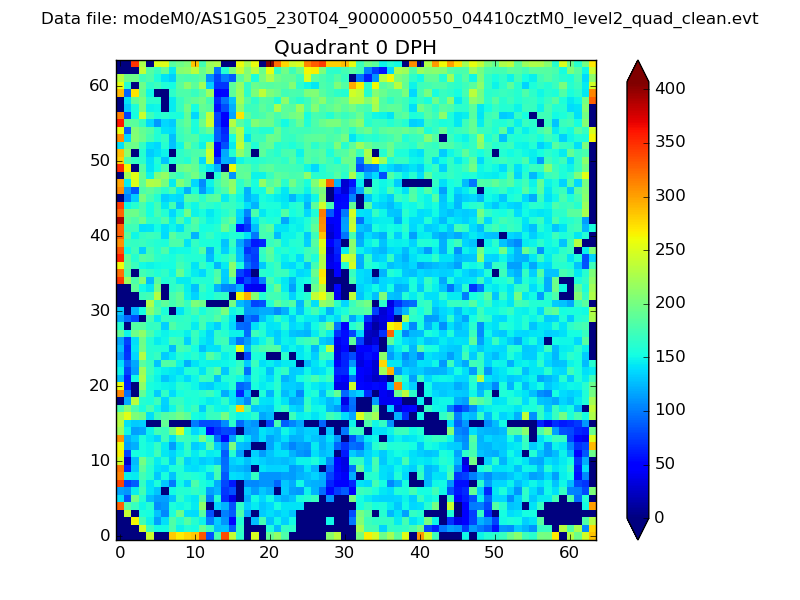 |
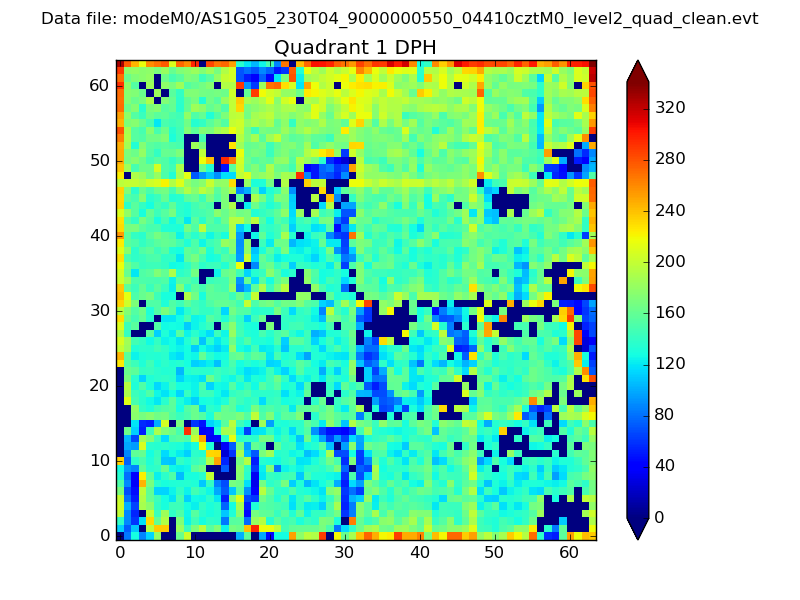 |
Quadrant B |
|---|---|---|---|
| Quadrant D | 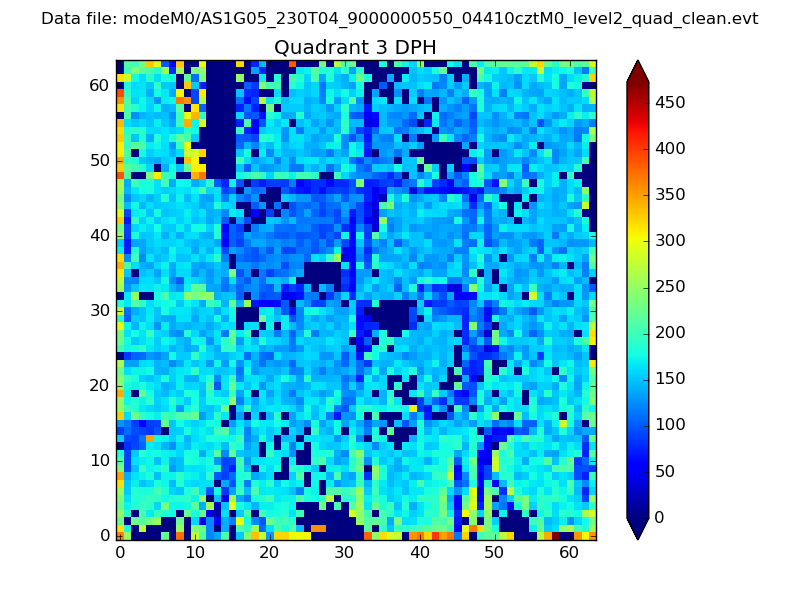 |
 |
Quadrant C |
| Plot type | Count rate plots | Images |
|---|---|---|
| Comparison with Poisson distribution Blue bars denote a histogram of data divided into 1 sec bins. Red curve is a Poisson curve with rate = median count rate of data. |
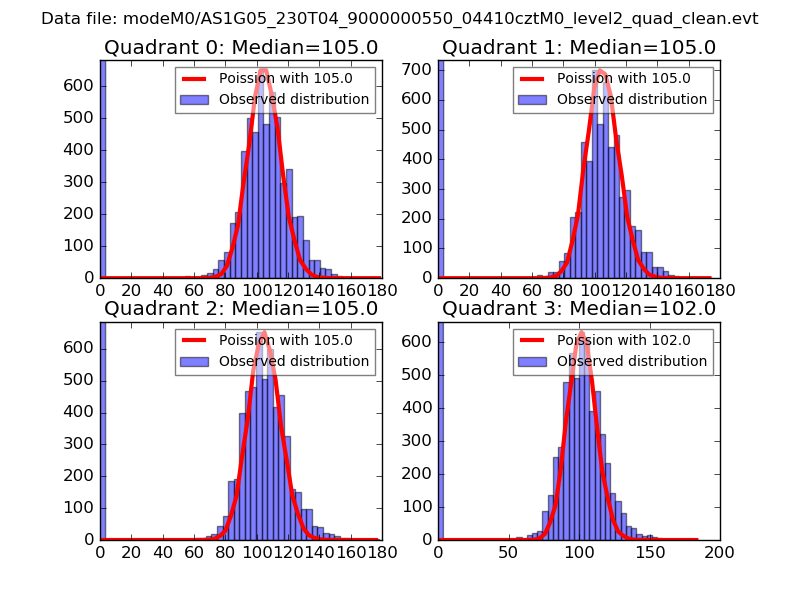 |
 |
| Quadrant-wise count rates Data is divided into 100 sec bins |
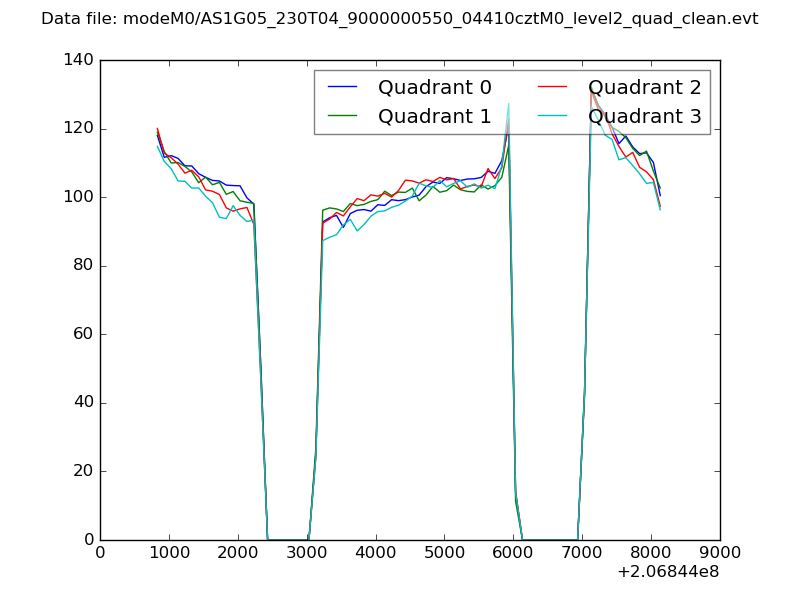 |
|
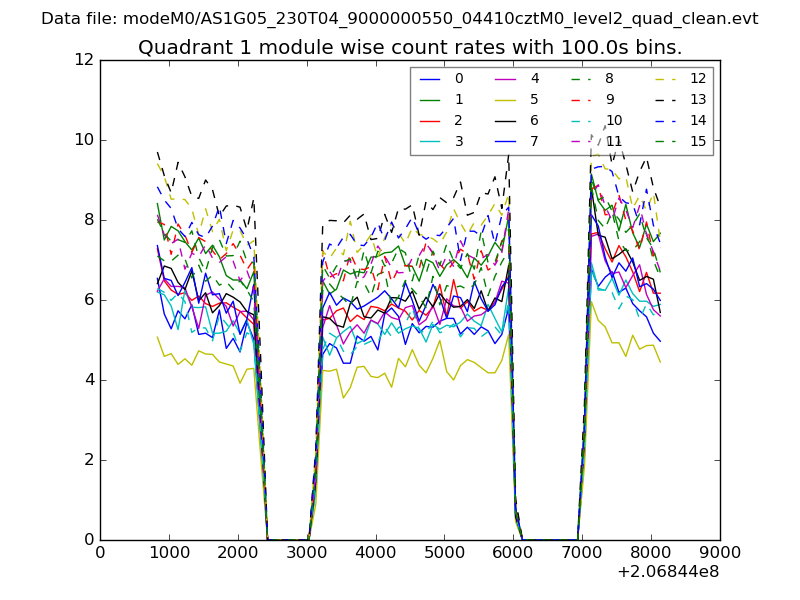
| Module-wise count rates for Quadrant A Data is divided into 100 sec bins |
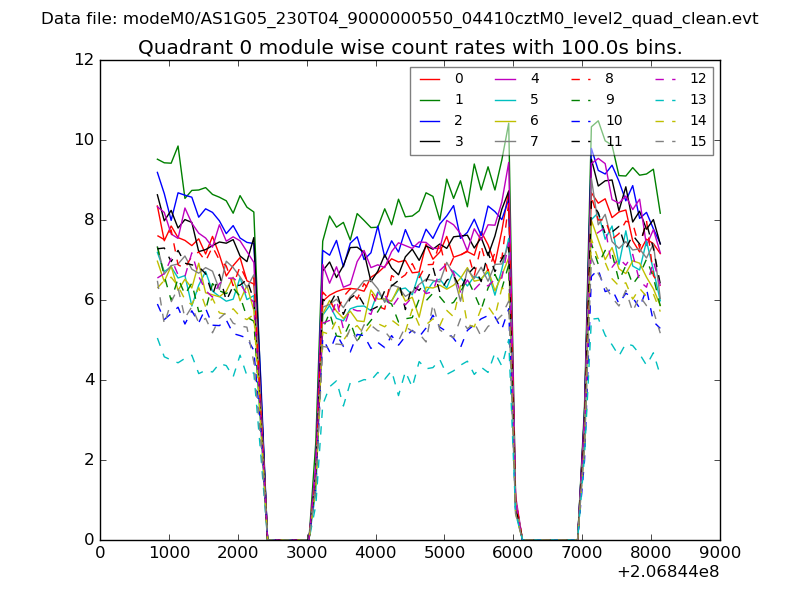 |
 |
| Module-wise count rates for Quadrant B Data is divided into 100 sec bins |
 |
 |
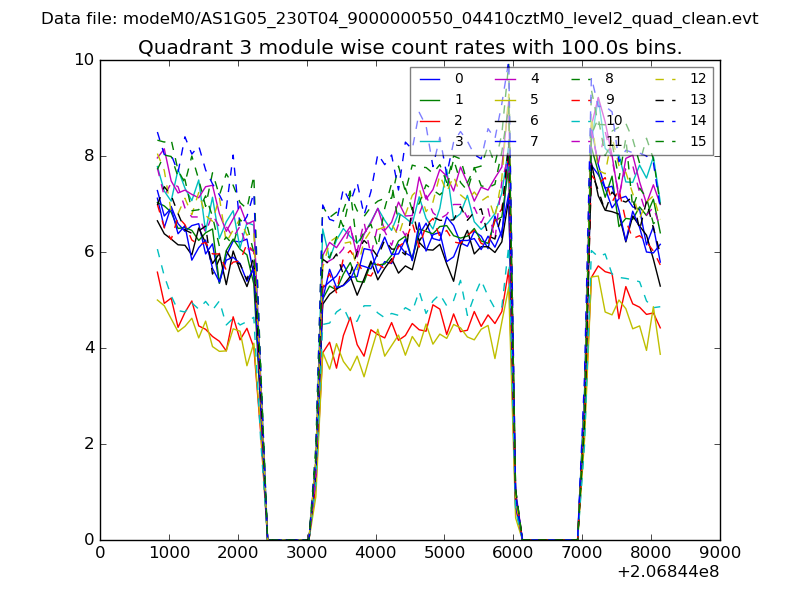
| Module-wise count rates for Quadrant C Data is divided into 100 sec bins |
 |
 |
| Module-wise count rates for Quadrant D Data is divided into 100 sec bins |
 |
 |
| Parameter | Plot |
|---|---|
| CZT HV Monitor | 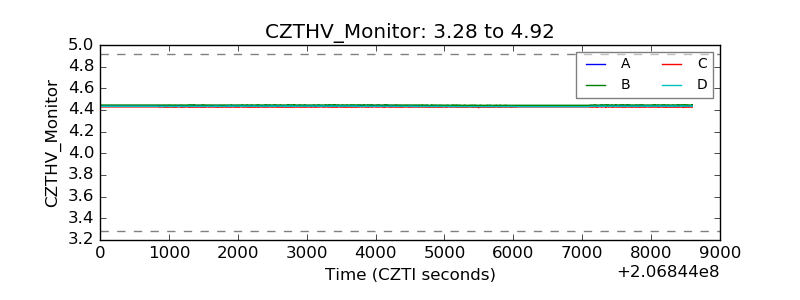 |
| D_VDD | 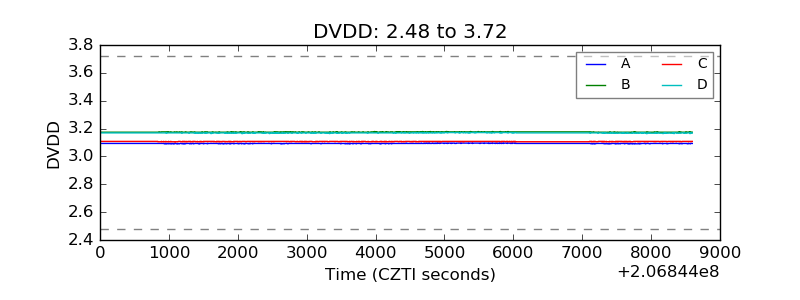 |
| Temperature 1 | 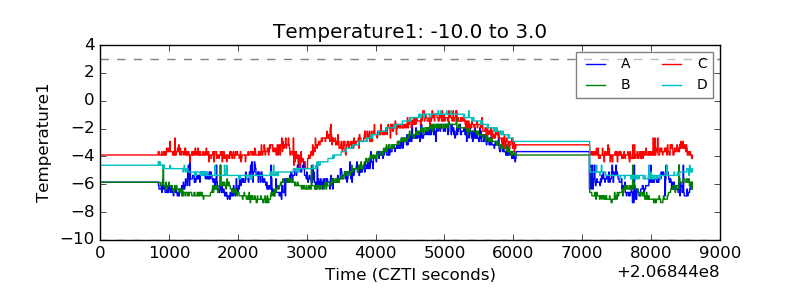 |
| Veto HV Monitor | 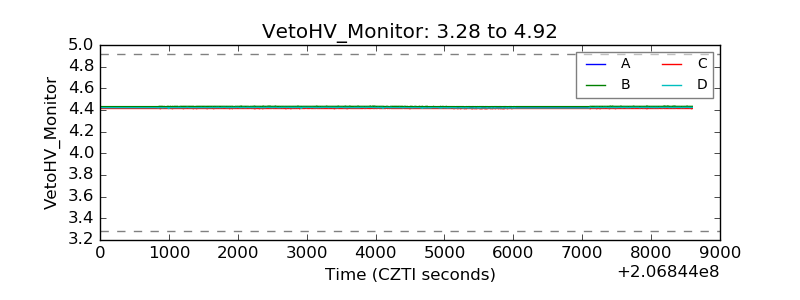 |
| Veto LLD | 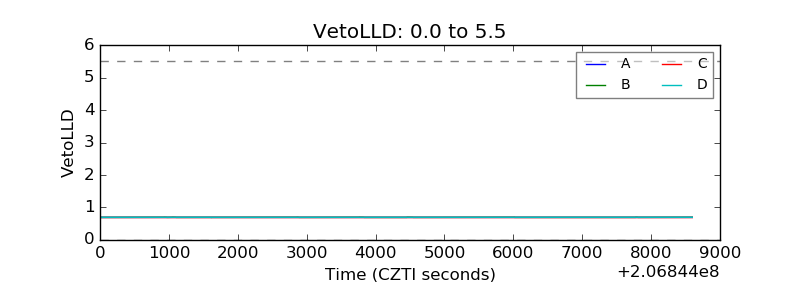 |
| Alpha Counter | 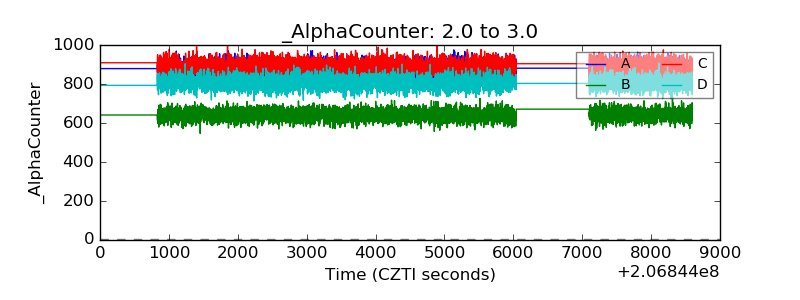 |
| _CPM_Rate | 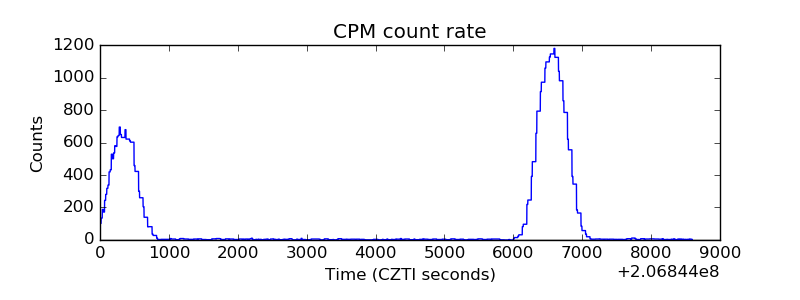 |
| CZT Counter | 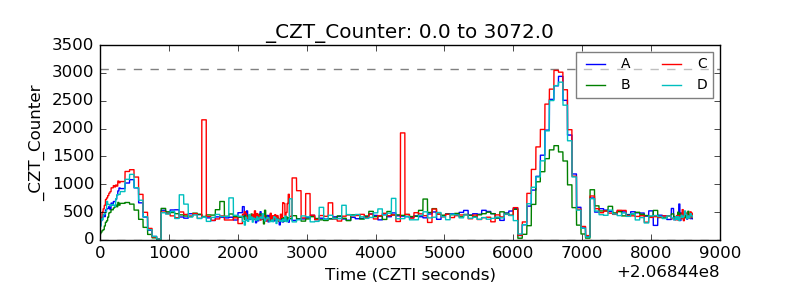 |
| +2.5 Volts monitor | 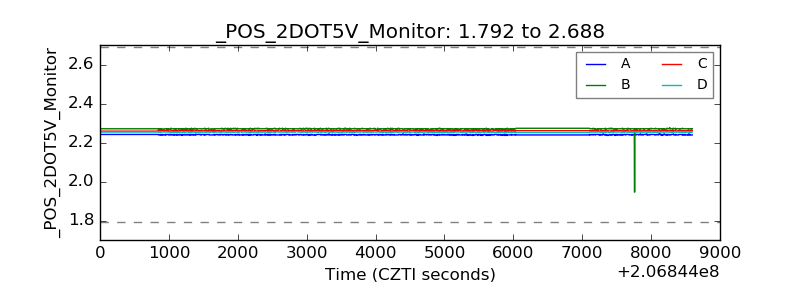 |
| +5 Volts monitor | 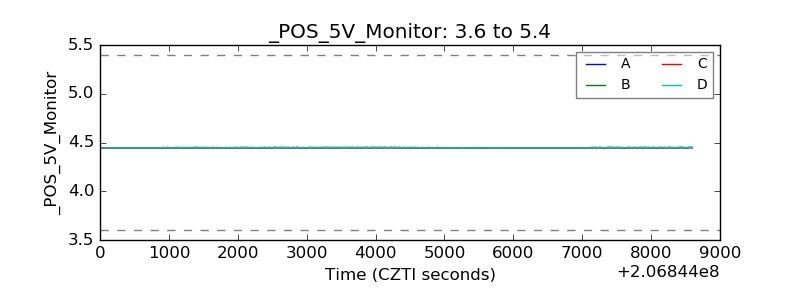 |
| _ROLL_ROT | 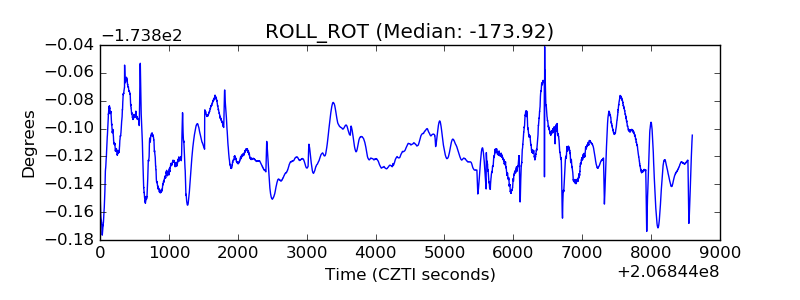 |
| _Roll_DEC | 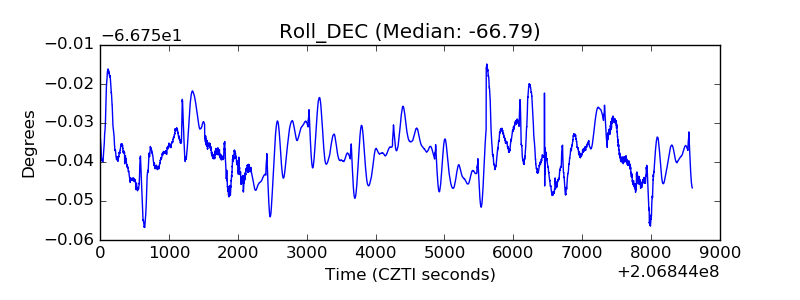 |
| _Roll_RA | 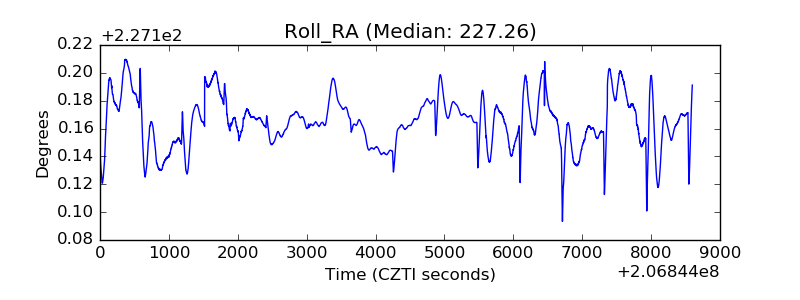 |
| Veto Counter | 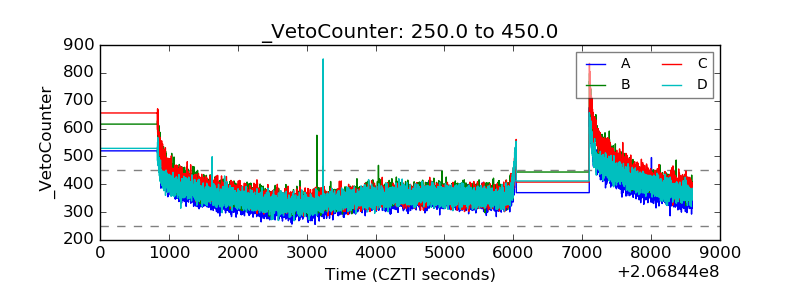 |