| Param | Original file | Final file |
|---|---|---|
| Filename | modeM0/AS1G05_230T04_9000000550_04413cztM0_level2.evt | modeM0/AS1G05_230T04_9000000550_04413cztM0_level2_quad_clean.evt |
| Size (bytes) | 476,513,280 | 83,062,080 |
| Size | 454.4 MB | 79.2 MB |
| Events in quadrant A | 2,913,596 | 524,523 |
| Events in quadrant B | 3,111,445 | 526,512 |
| Events in quadrant C | 2,965,201 | 528,294 |
| Events in quadrant D | 5,012,626 | 495,619 |
| Mode SS | |||
|---|---|---|---|
| Quadrant | BADHDUFLAG | Total packets | Discarded packets |
| A | 0 | 126 | 0 |
| B | 0 | 126 | 0 |
| C | 0 | 126 | 0 |
| D | 0 | 126 | 0 |
| Mode M9 | |||
|---|---|---|---|
| Quadrant | BADHDUFLAG | Total packets | Discarded packets |
| A | 0 | 13 | 0 |
| B | 0 | 13 | 0 |
| C | 0 | 13 | 0 |
| D | 0 | 13 | 0 |
| Mode M0 | |||
|---|---|---|---|
| Quadrant | BADHDUFLAG | Total packets | Discarded packets |
| A | 0 | 12876 | 2 |
| B | 0 | 13321 | 1 |
| C | 0 | 13017 | 1 |
| D | 0 | 19287 | 1 |
| Quadrant | Total seconds | Saturated seconds | Saturation percentage |
|---|---|---|---|
| A | 6317 | 37 | 0.585721% |
| B | 6317 | 48 | 0.759854% |
| C | 6317 | 29 | 0.459079% |
| D | 6317 | 331 | 5.239829% |
Noise dominated data is calculated using 1-second bins in cleaned event files. If a bin has >2000 counts, and if more than 50% of those come from <1% of pixels, then it is considered to be noise-dominated and hence unusable.
| Quadrant | # 1 sec bins | Bins with >0 counts | Bins with >2000 counts | High rate bins dominated by noise | Noise dominated (total time) | Noise dominated (detector-on time) | Marked lightcurve |
|---|---|---|---|---|---|---|---|
| A | 7572 | 6318 | 1 | 1 | 0.01% | 0.02% | 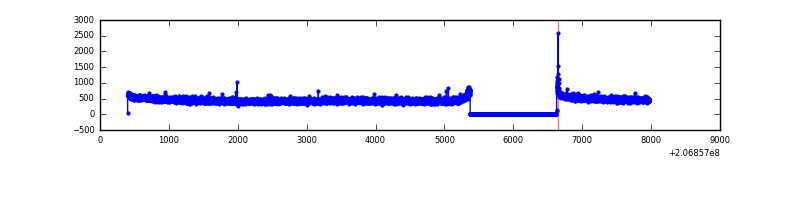 |
| B | 7572 | 6318 | 1 | 1 | 0.01% | 0.02% | 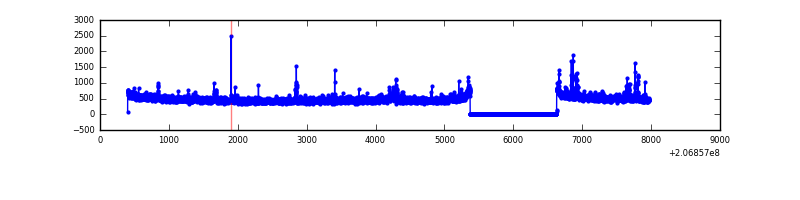 |
| C | 7572 | 6318 | 4 | 4 | 0.05% | 0.06% | 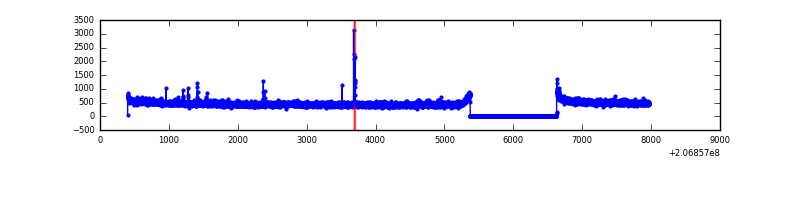 |
| D | 7572 | 6318 | 362 | 362 | 4.78% | 5.73% | 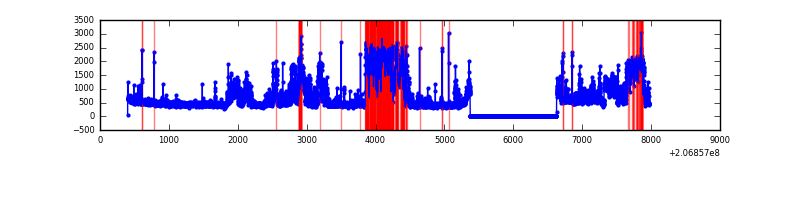 |
Top three noisy pixels from each quadrant. If the there are fewer than three noisy pixels in the level2.evt file, extra rows are filled as -1
| Pixel properties | Quadrant properties | ||||||
|---|---|---|---|---|---|---|---|
| Quadrant | DetID | PixID | Counts | Sigma | Mean | Median | Sigma |
| A | 14 | 111 | 8764 | 52.85 | 753 | 737 | 151.9 |
| A | 12 | 194 | 7613 | 45.27 | 753 | 737 | 151.9 |
| A | 0 | 226 | 7532 | 44.74 | 753 | 737 | 151.9 |
| B | 14 | 167 | 58380 | 402.73 | 763 | 746 | 143.1 |
| B | 10 | 16 | 42719 | 293.3 | 763 | 746 | 143.1 |
| B | 15 | 204 | 25918 | 175.9 | 763 | 746 | 143.1 |
| C | 14 | 48 | 38024 | 219.88 | 742 | 745 | 169.5 |
| C | 9 | 247 | 21890 | 124.72 | 742 | 745 | 169.5 |
| C | 13 | 61 | 6129 | 31.76 | 742 | 745 | 169.5 |
| D | 13 | 114 | 2081033 | 11935.72 | 729 | 708 | 174.3 |
| D | 13 | 239 | 77504 | 440.61 | 729 | 708 | 174.3 |
| D | 2 | 206 | 17743 | 97.74 | 729 | 708 | 174.3 |
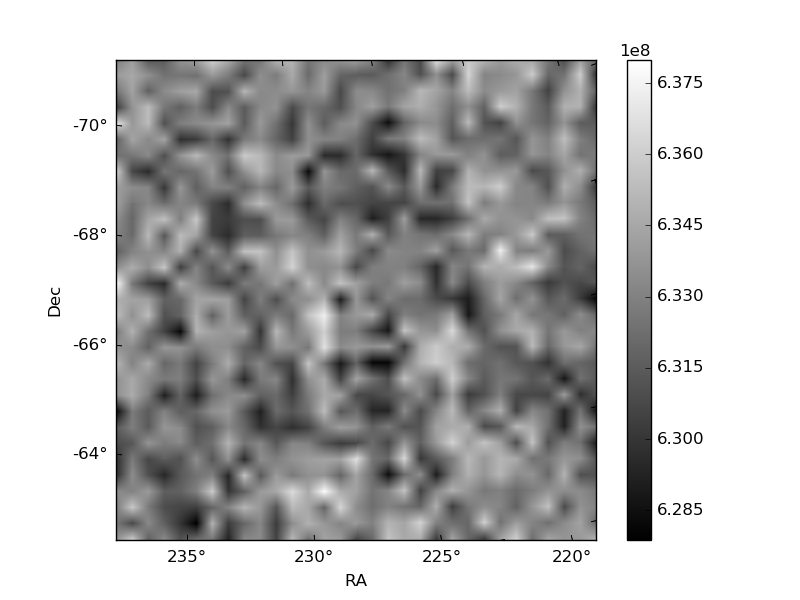
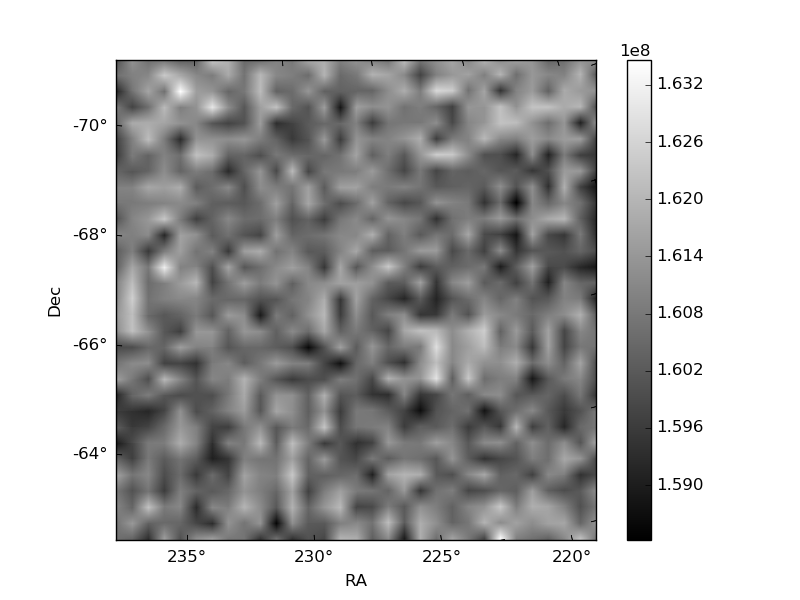
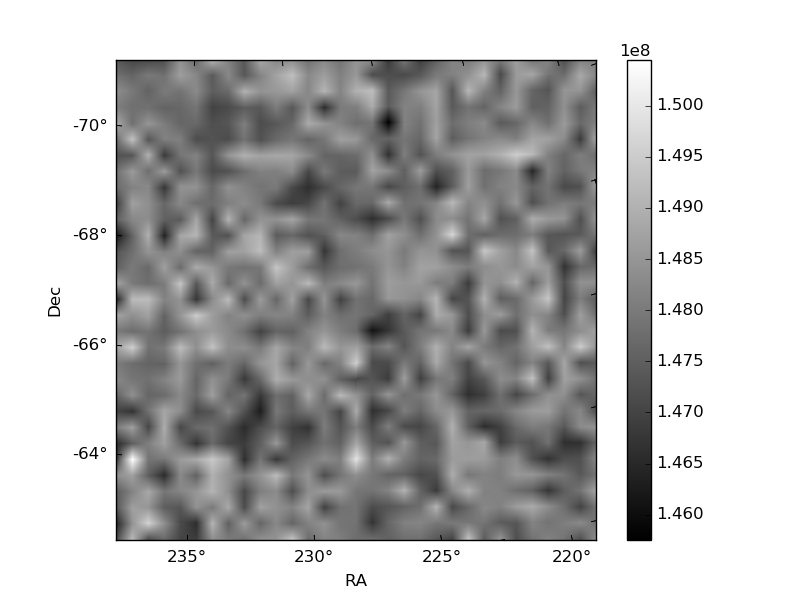
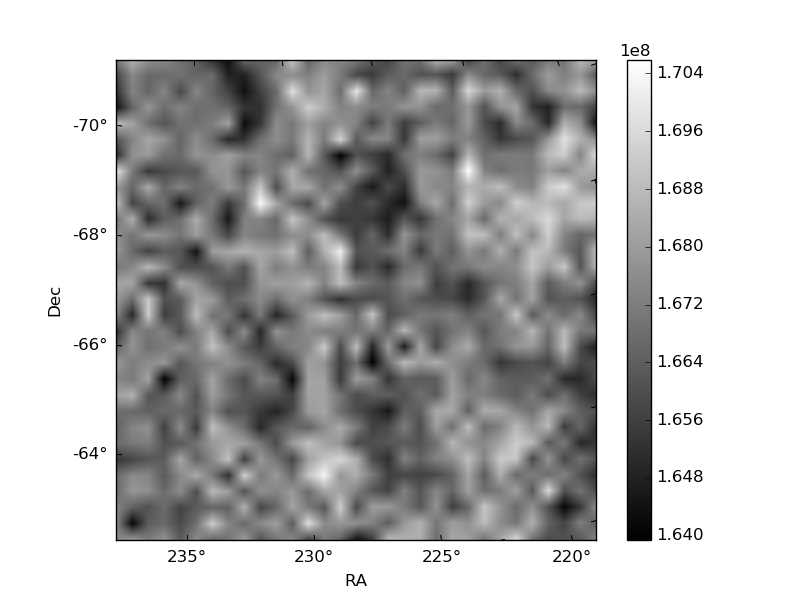
Histogram calculated using DETX and DETY for each event in the final _common_clean file
| Quadrant A | 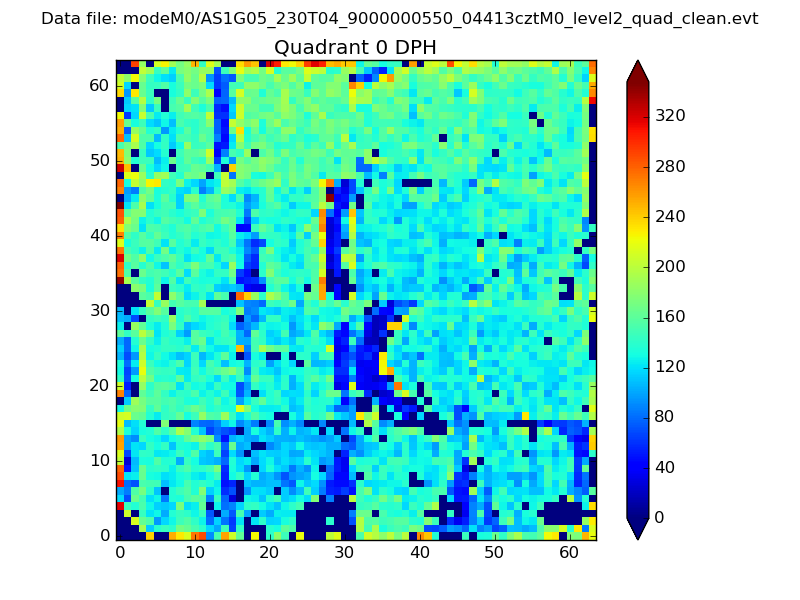 |
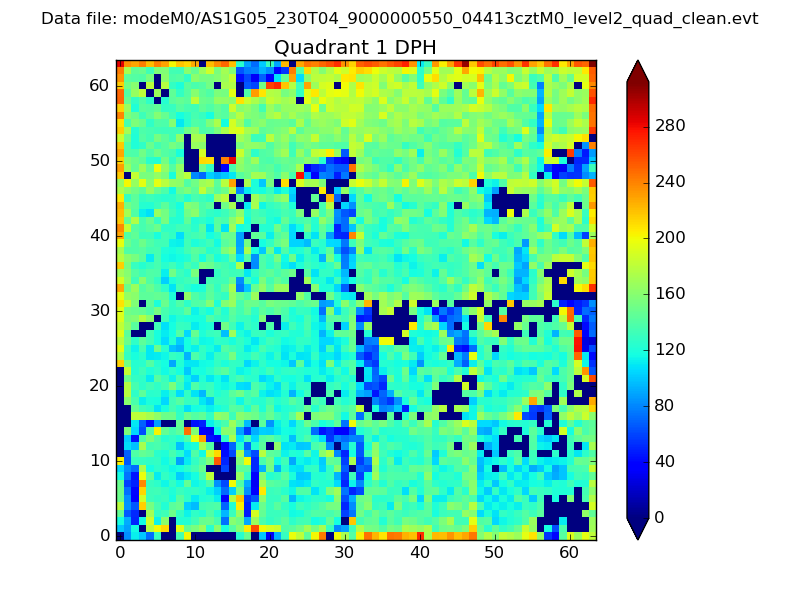 |
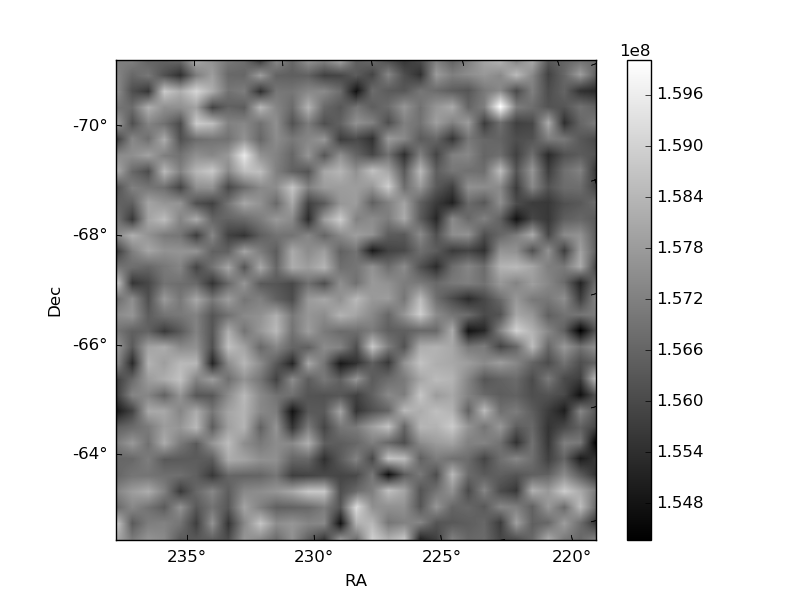
Quadrant B |
|---|---|---|---|
| Quadrant D | 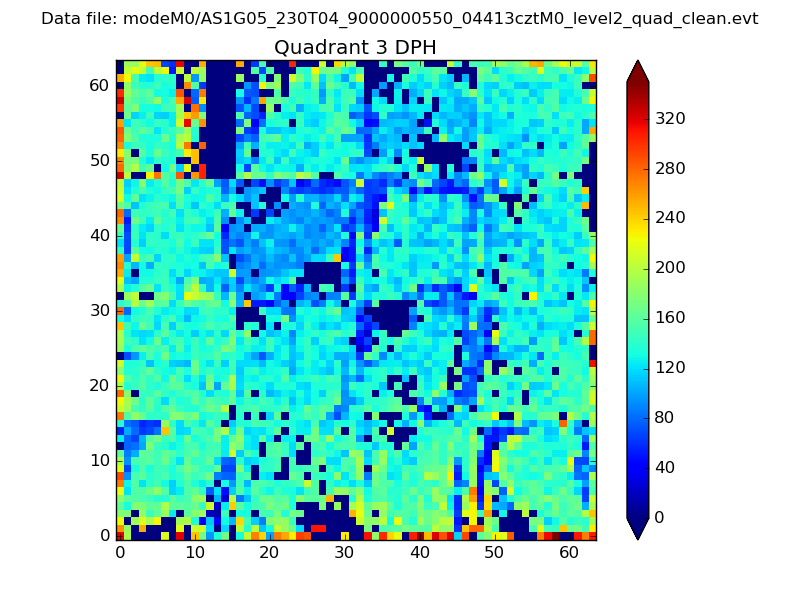 |
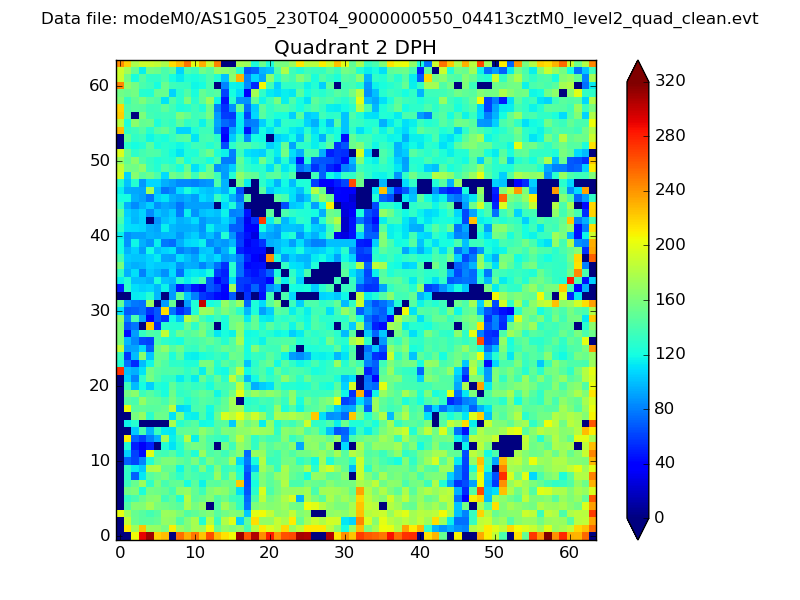 |
Quadrant C |
| Plot type | Count rate plots | Images |
|---|---|---|
| Comparison with Poisson distribution Blue bars denote a histogram of data divided into 1 sec bins. Red curve is a Poisson curve with rate = median count rate of data. |
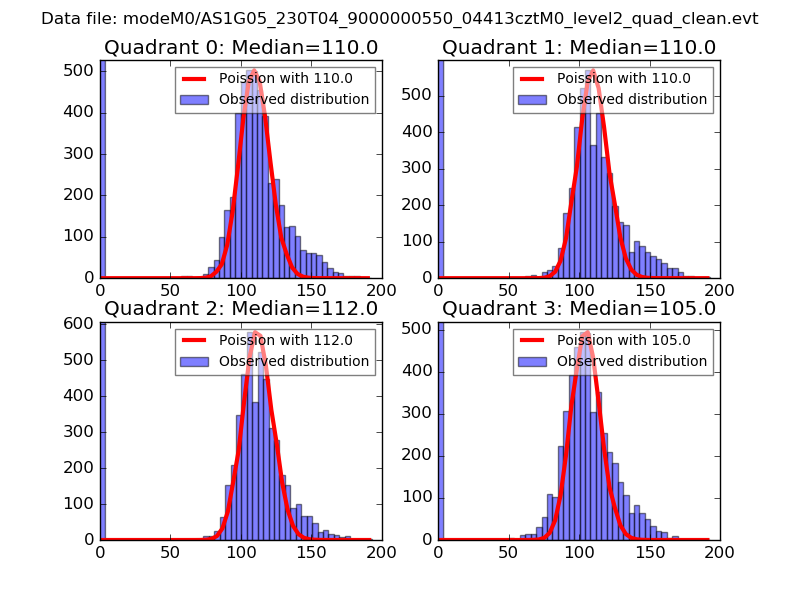 |
 |
| Quadrant-wise count rates Data is divided into 100 sec bins |
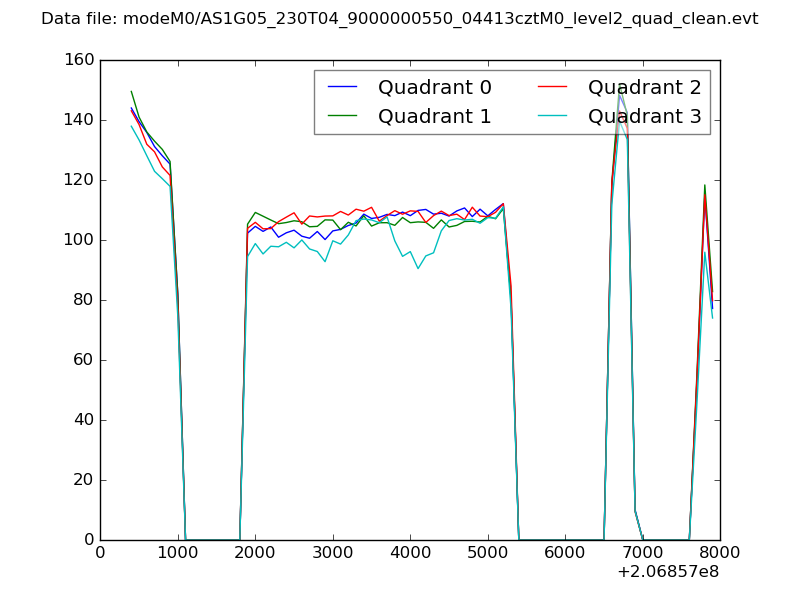 |
|
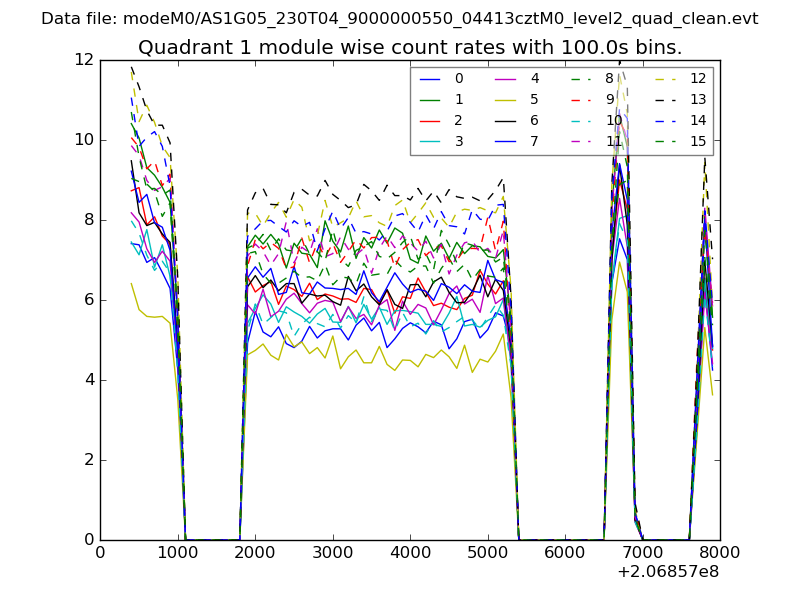
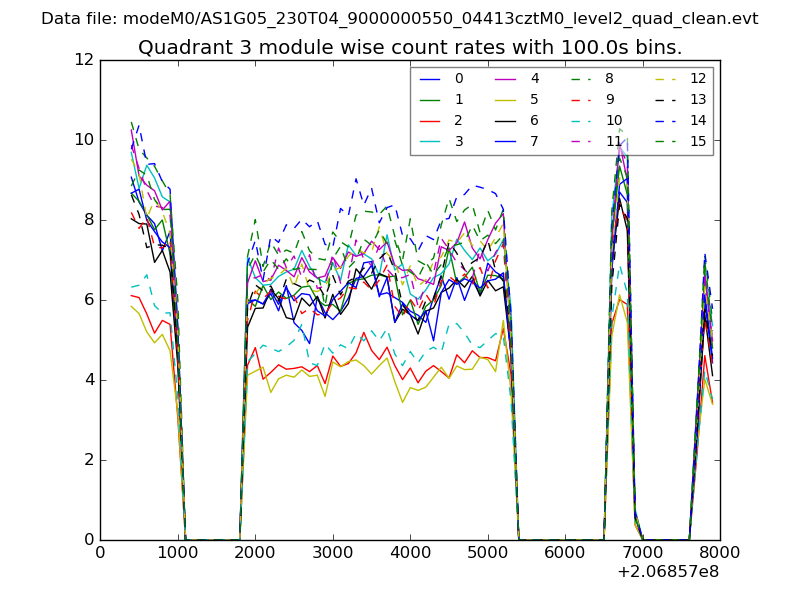
| Module-wise count rates for Quadrant A Data is divided into 100 sec bins |
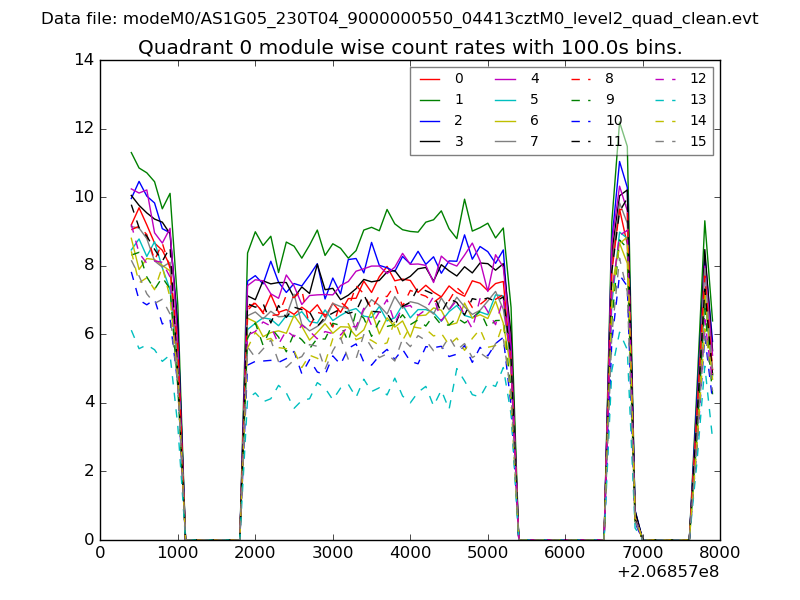 |
 |
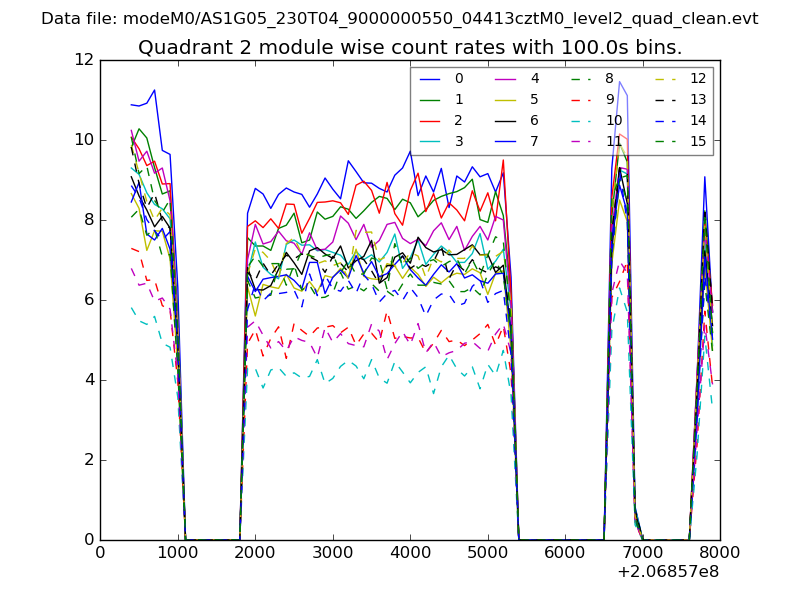
| Module-wise count rates for Quadrant B Data is divided into 100 sec bins |
 |
 |
| Module-wise count rates for Quadrant C Data is divided into 100 sec bins |
 |
 |
| Module-wise count rates for Quadrant D Data is divided into 100 sec bins |
 |
 |
| Parameter | Plot |
|---|---|
| CZT HV Monitor | 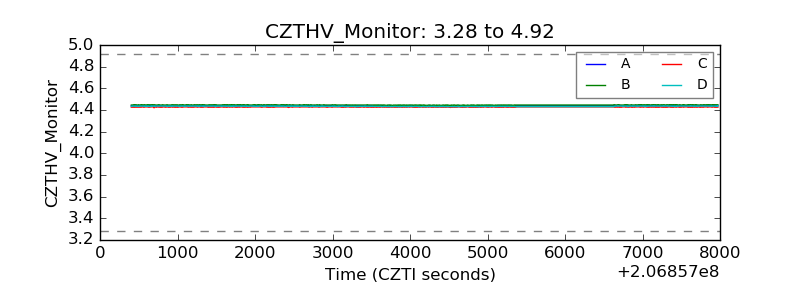 |
| D_VDD | 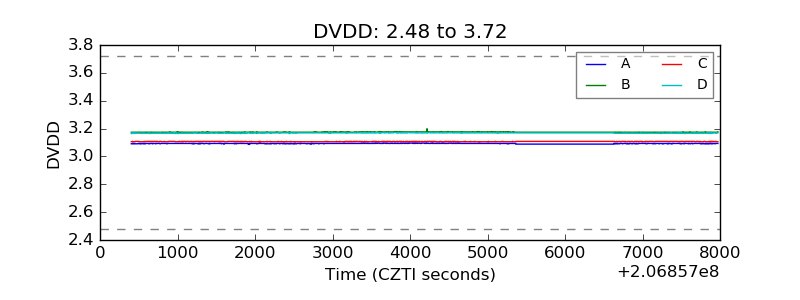 |
| Temperature 1 | 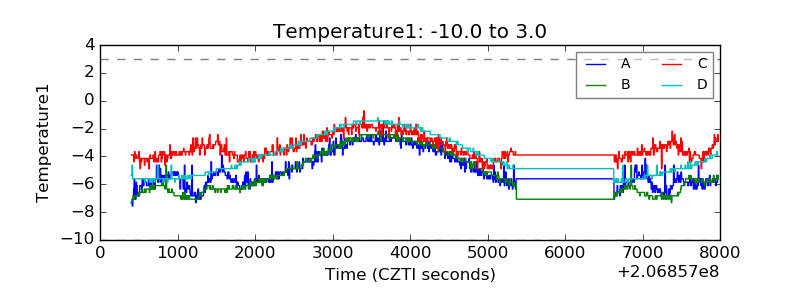 |
| Veto HV Monitor | 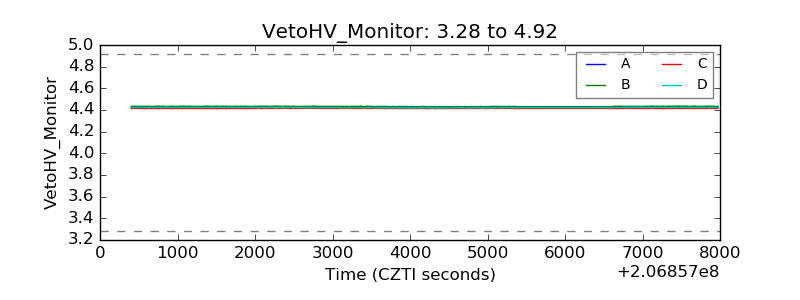 |
| Veto LLD | 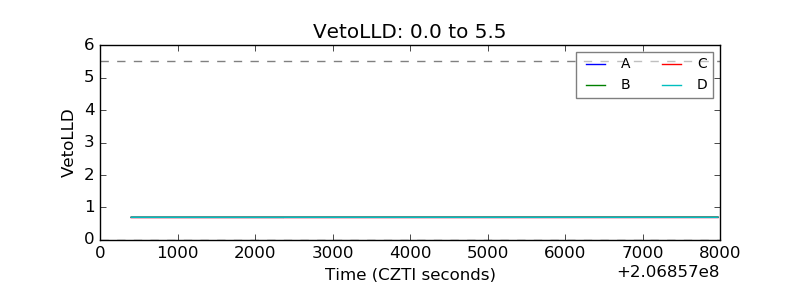 |
| Alpha Counter | 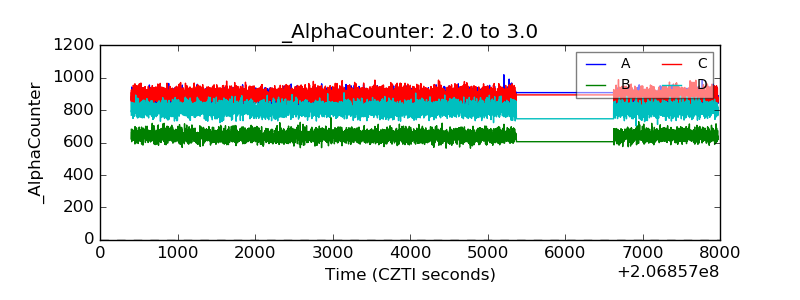 |
| _CPM_Rate | 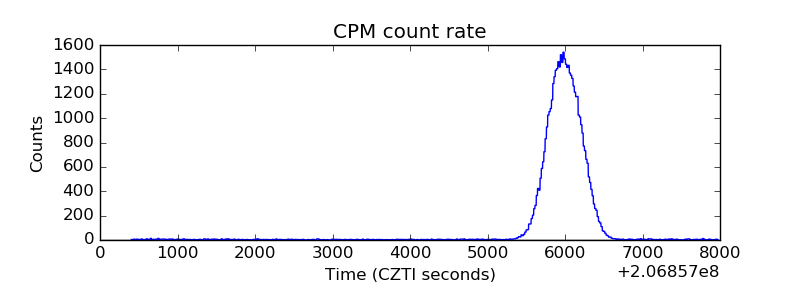 |
| CZT Counter | 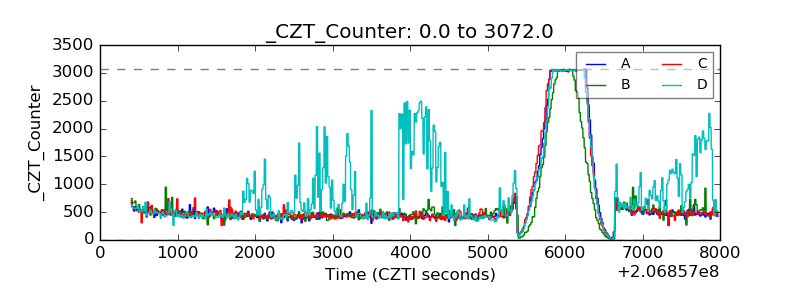 |
| +2.5 Volts monitor | 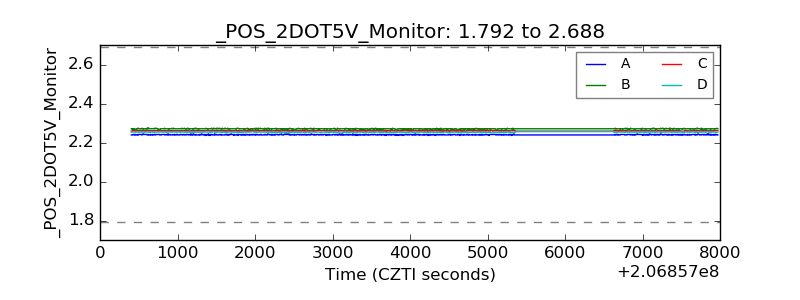 |
| +5 Volts monitor | 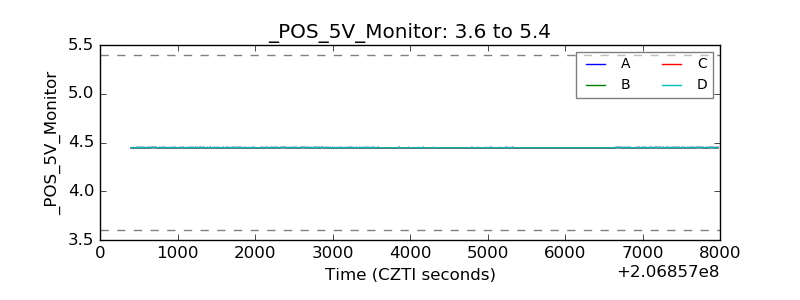 |
| _ROLL_ROT | 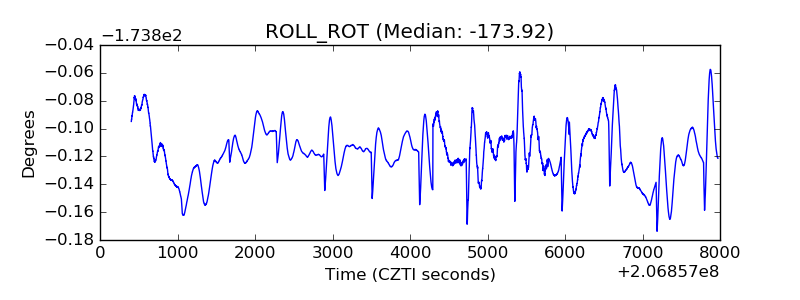 |
| _Roll_DEC | 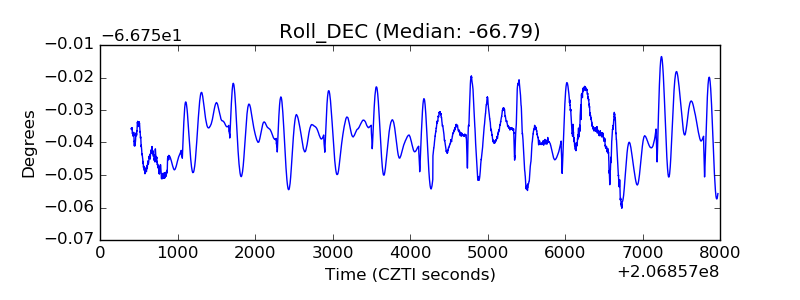 |
| _Roll_RA | 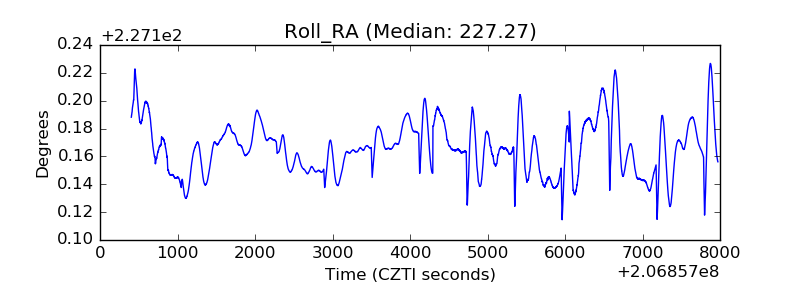 |
| Veto Counter | 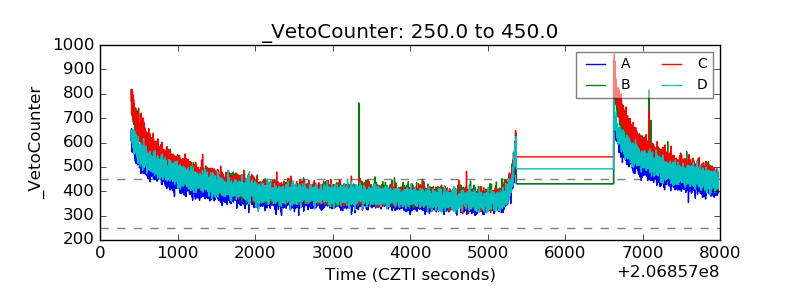 |